# Event Analysis
# 1.The Significance of Event Analysis
The behavior data generated by the user (USER) in the APP or game is called an event (EVENT). Event data records the time, type, and details of the various behaviors that the user produces. The model that filters or groups these event data and calculates aggregated indicators is called the event analysis model.
Through event analysis, the aggregation index of specific behaviors generated by users within a period of time can be calculated to know the user participation in each behavior development trend of indicators, so as to generally control products and optimize decision-making.
Take consumption events as an example, the following problems can be solved:
- The trend of daily income flow in recent January?
- What is the daily income flow and distribution of each channel in recent January?
- What is the trend of per capita payment for users from Shanghai in recent January?
- What is the comparison of total payment times for membership cards purchased by users from Shanghai and Beijing in recent January?
# 2.Location and Applicable Role of Event Analysis
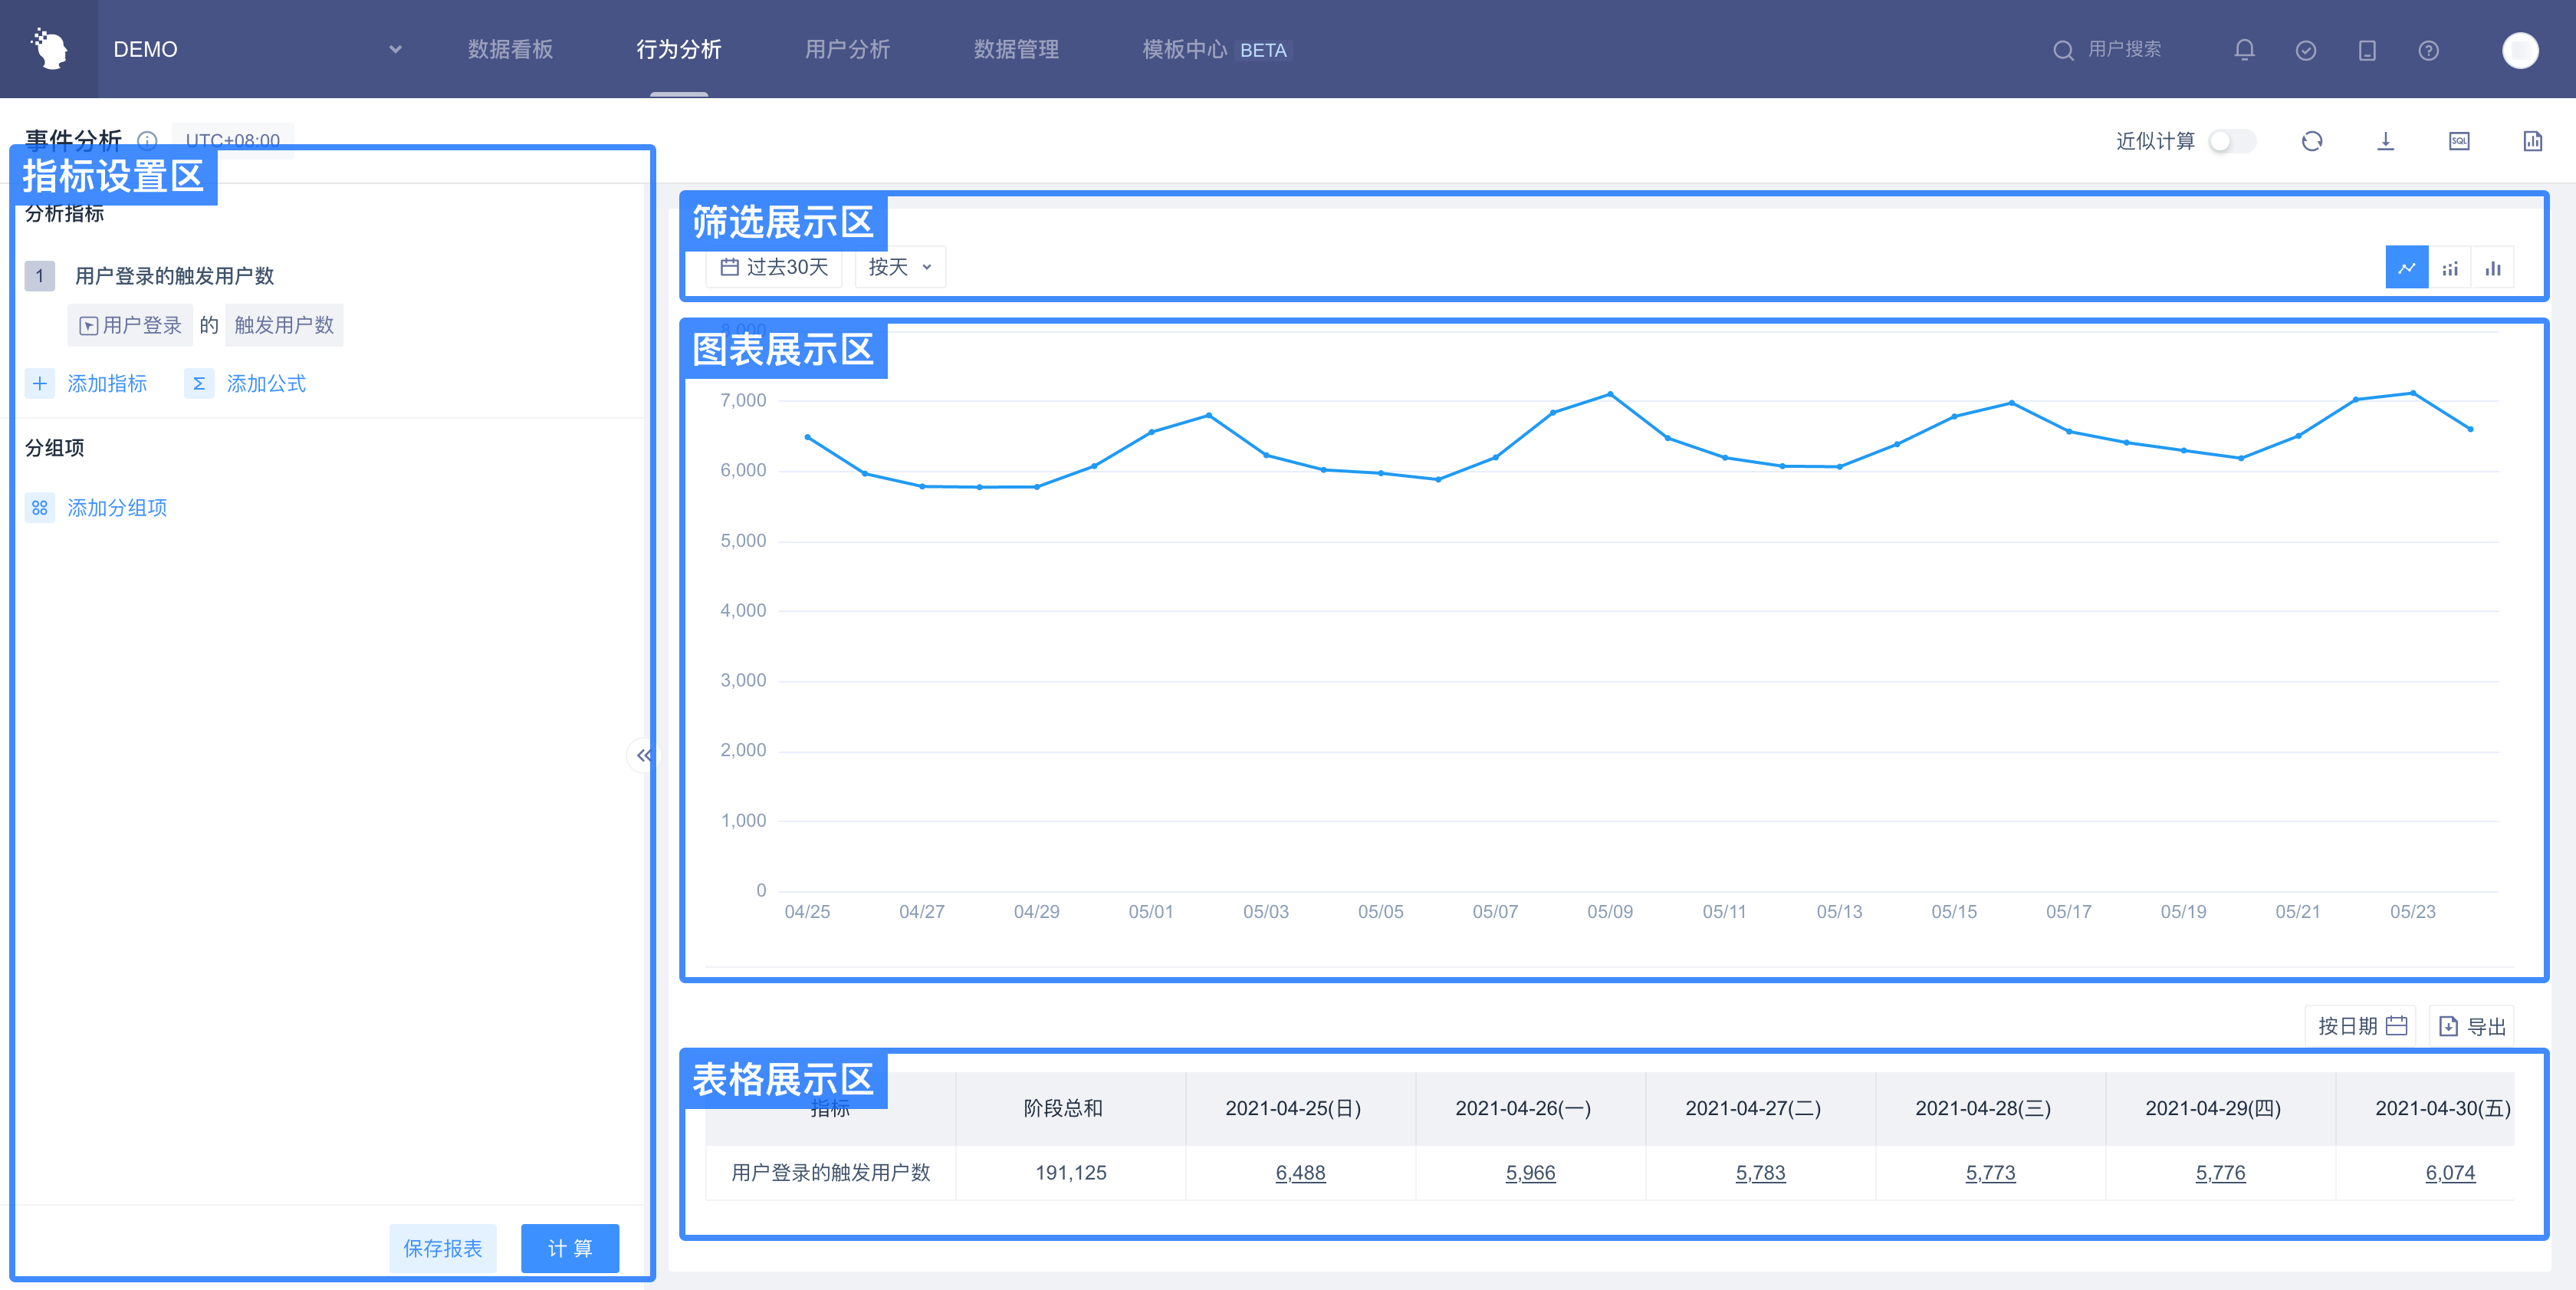
Select "Event Analysis" from "Behavior Analysis" in the top navigation bar to enter the event analysis model:
| Company Supervisor | Administrator | Analyst | Ordinary members | |
|---|---|---|---|---|
| Event analysis model | ● | ● | ▲ | △ |
Permission description:
● Role must have
▲ The role has the permission by default, but can revoke
△ The role is not available by default, but can be authorized
○ Role must not have
# 3.Event Analysis Guideline
# 3.1 Selection of Analysis Indicators
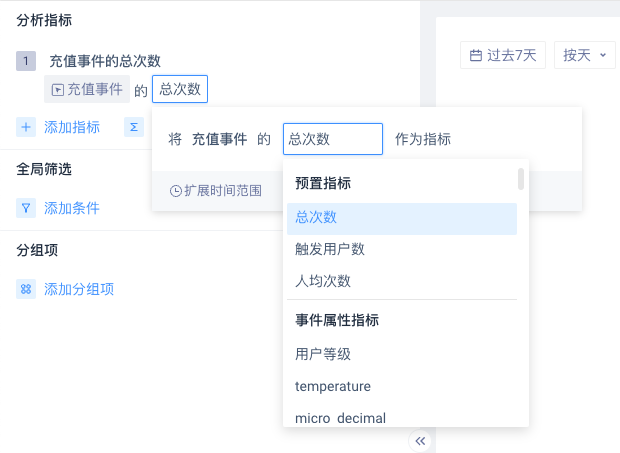
Analysis indicators are "Event" + "Attribute" + "Calculation Method" or directly "Event" + "Calculation Method":
| Event | Attribute | Calculation method |
|---|---|---|
| Any event | Total number of times, number of triggered users, number of times per capita | |
| Event | Total number of times, number of triggered users, number of times per capita | |
| Event | Event attributes (numeric) | Sum, mean, maximum, minimum, average, deduplicate number, 99 percentiles, 95 percentiles, 90 percentiles, 80 percentiles, 75 percentiles, 70 percentiles, 60 percentiles, 40 percentiles, 30 percentiles, 25 percentiles, 20 percentiles, 10 percentiles, 5 percentiles |
| Event | Event properties (list type) | List deduplicate number, list element deduplicate number |
| Event | Event properties (Boolean) | Deduplicate number, true number, false number, empty number, not empty number |
| Event | Event properties (non-numeric, Boolean) | Deduplicate number |
For example: the number of users triggered by any event, the number of times per capita purchases, the average VIP level of users to purchase, the WIFI number to purchase is true, count the provinces of users who buy goods and remove the duplicates.
# 3.1.1 Add Formula
If some four operations between analysis indicators need to be carried out, they can be realized by " adding formulas " . If you analyze the ARPU value (the per capita payment amount of active users) , you can use "paid events. Payment amount. Sum "/" User login. Number of users triggered "
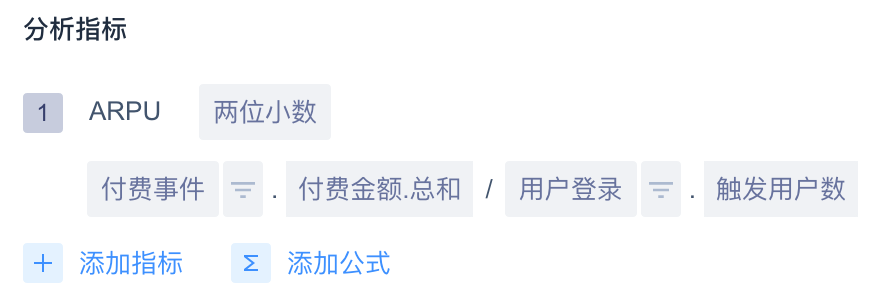
In addition to "Add Formula", you can also select "Switch to Custom Formula" on the indicator, and the selected analysis indicator and filter criteria will be brought into the formula.

# 3.1.2 Adding Multiple Indicators
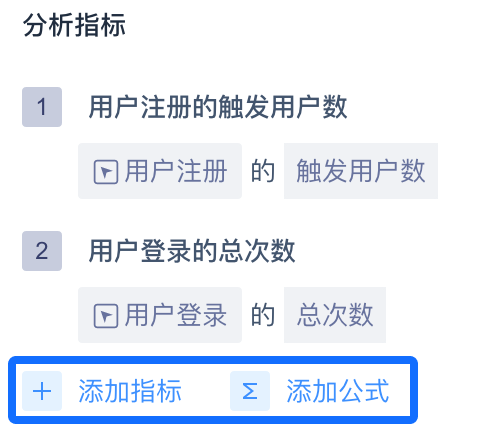
Multiple analysis indicators can be analyzed simultaneously by "adding indicators" to achieve some comparison and display requirements, as shown in the following figure:
# 3.1.3 Advanced Analysis Indicators
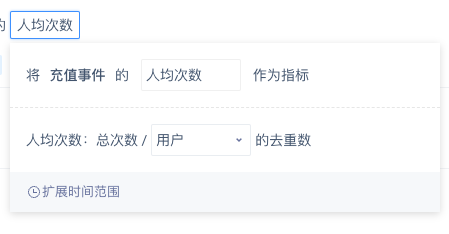
- When the selected calculation method is ‘triggered users’, the number of times per capita, the value per capita, and when the project has a custom analysis body configured, you can switch the analysis body, which will affect the calculation logic of the indicator.
| Calculation method | Computational logic |
|---|---|
| Number of triggered users | Number of deduplicates for selected analysis subjects |
| Number of times per capita | Total number of deduplicates/number of selected analysis subjects |
| Per capita | Sum of numeric attributes/deduplicate number of selected analysis subjects |
DANGER
If the custom analysis principal source is an event attribute and the event attribute is not included under the event, the analysis principal will not be selected.
- Extended time range
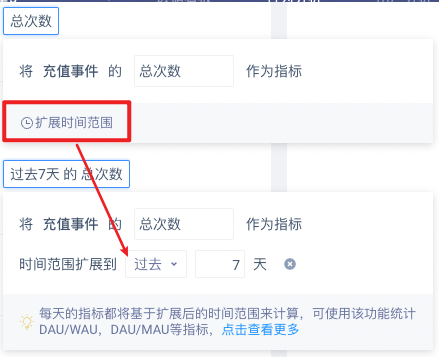
Click to expand the time range to expand the data range calculated by the indicator. At this time, the analysis granularity will be locked as "by day" and cannot be adjusted.
For example, "the total number of recharge events in the past 7 days of 2021-12-13" actually corresponds to "the total number of recharge events of 2021-12-06~ 2021-12-12", it is displayed as 2021-12-13 in charts and tables, but the actual data range will be longer than this date.
# 3.2 Selection of Group Items
Grouping items can be based on user features, event attributes, user grouping, or user tags:
| Event description | Grouping angle |
|---|---|
| Arbitrary event | Ungrouped, event properties common to all events, user features, user grouping, user tags |
| Event | Ungrouped, event attributes, user features, user grouping, user tags |
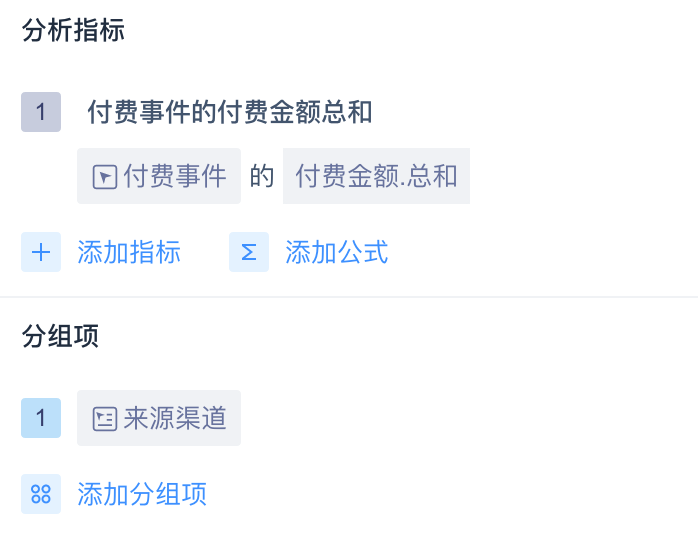
For example, select the analysis indicator as "the sum of the paid amount from paid events", select the group as 'sourse channel', and then analyze the total paid amount by each channel.
# 3.2.1 Set the Specified Grouping Condition
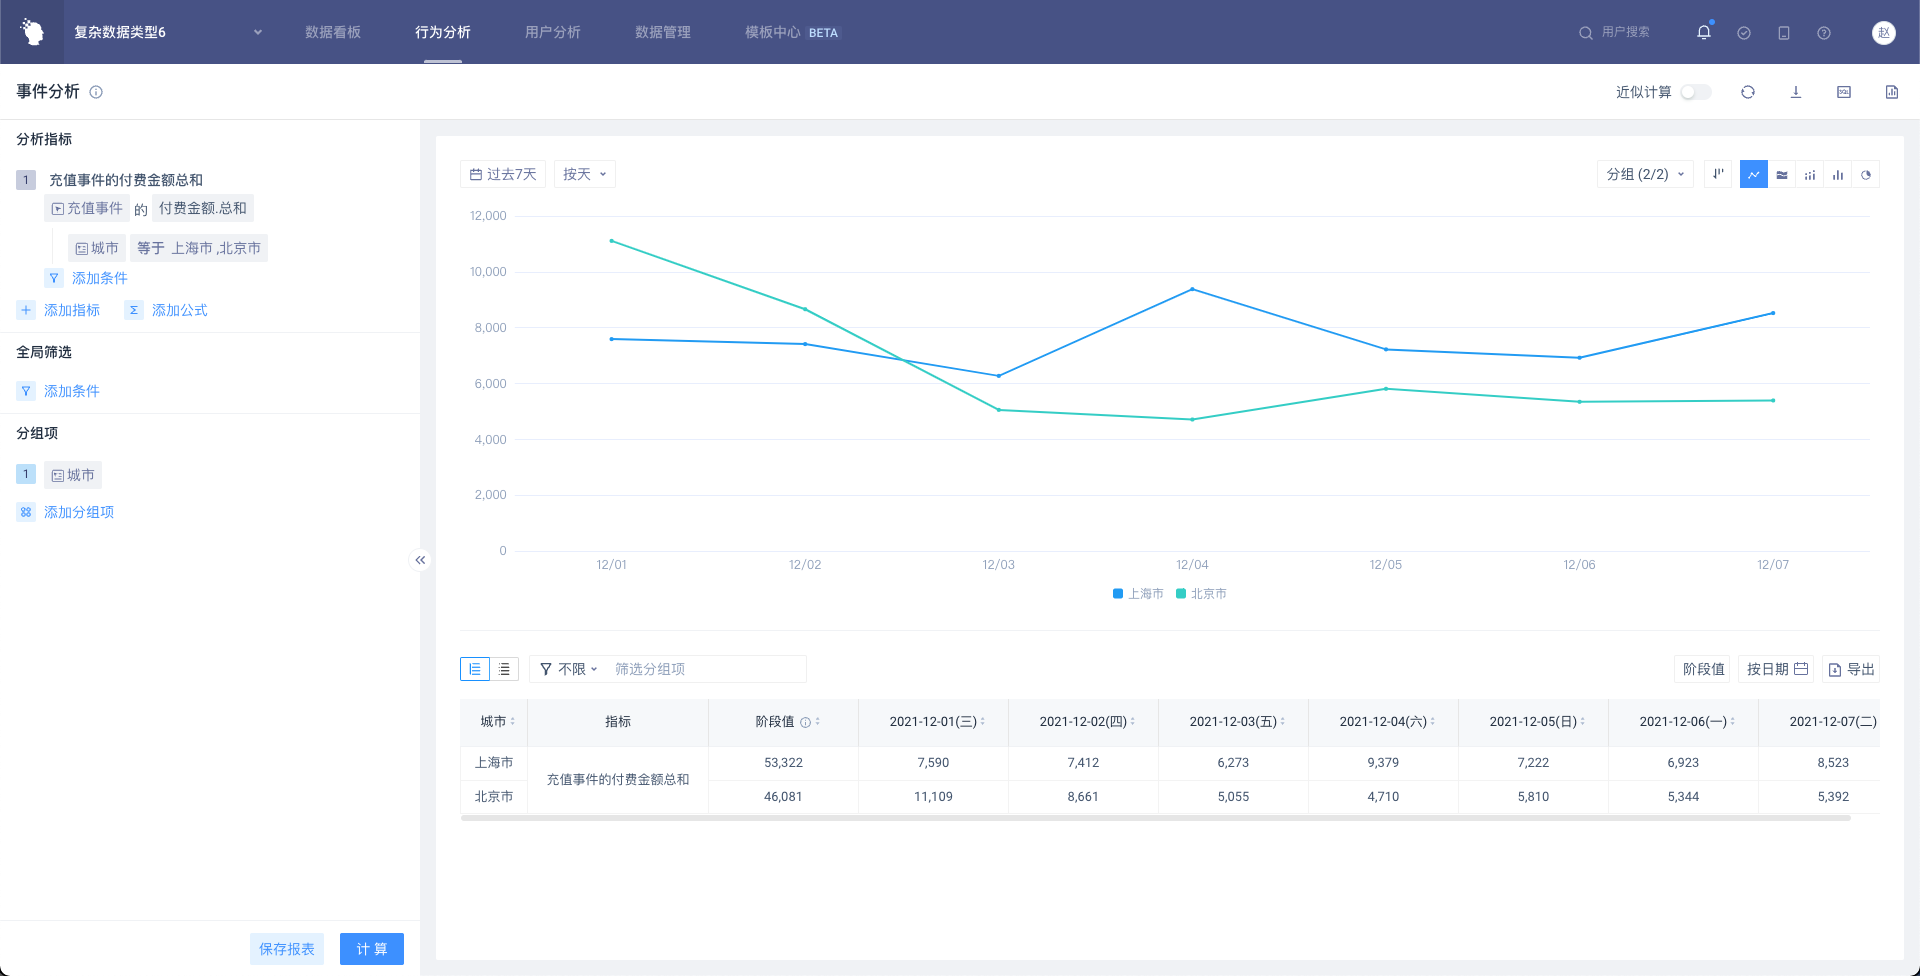
"Specified grouping" can be set by combining filter condition settings. For example, in the above case, if "city" is selected in the filter condition equals to "Shanghai and Beijing", then "the sum of the respective payment amounts for top-up events in Shanghai and Beijing" can be analyzed, as shown in the following figure:
# 3.2.2 Setting Up Multiple Grouping
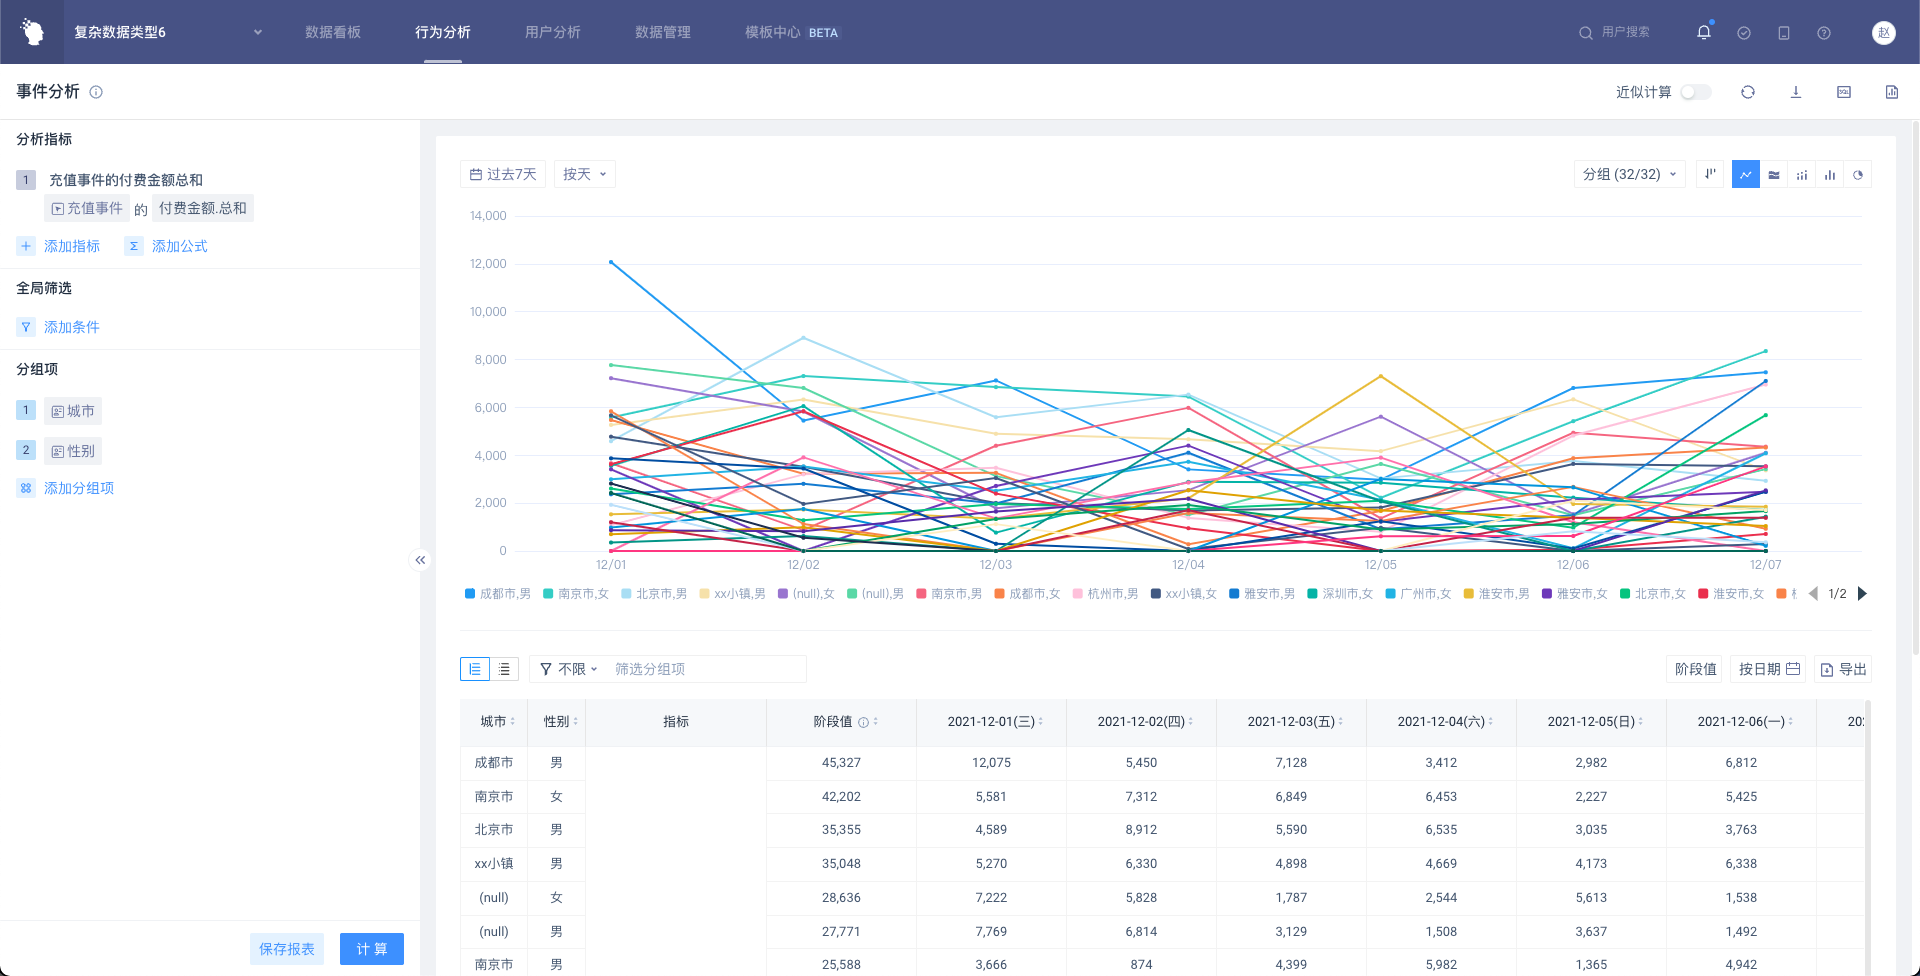
By choosing multiple grouping criteria, users can be grouped into more detailed dimensions. For example, in the above cases, if the grouping items are "City", "Gender", you can analyze the "sum of the paid incidents" of "Chengdu, men", "Chengdu, women", "Beijing, men", "Beijing, women" and other groups.
# 3.2.3 Set "Event Split"
The setting of "grouping item" will group all events in the analysis object, and "event splitting" solves the need to group and count only one event in the analysis objects.
In event analysis, when adding two or more analysis objects or selecting 'Add Formula', you can choose to set Event Splitting on the right side of the grouping item:
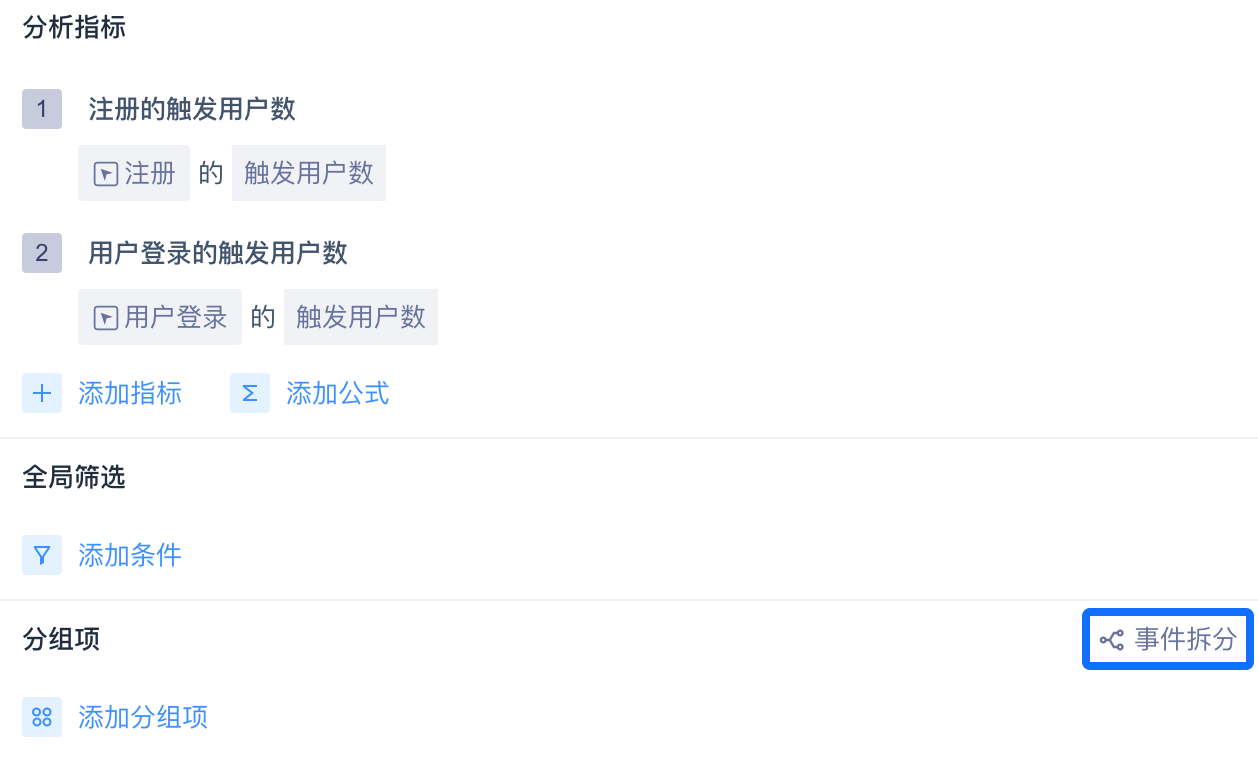
Click "Event Splitting" to select an event (except 'any event') in the analysis indicator . It can be split and calculated according to event attributes.
As shown in the figure below, the participation activities are divided and calculated according to the activity types. Analysis indicator 1 is to calculate the activity participation rates of different activity types.
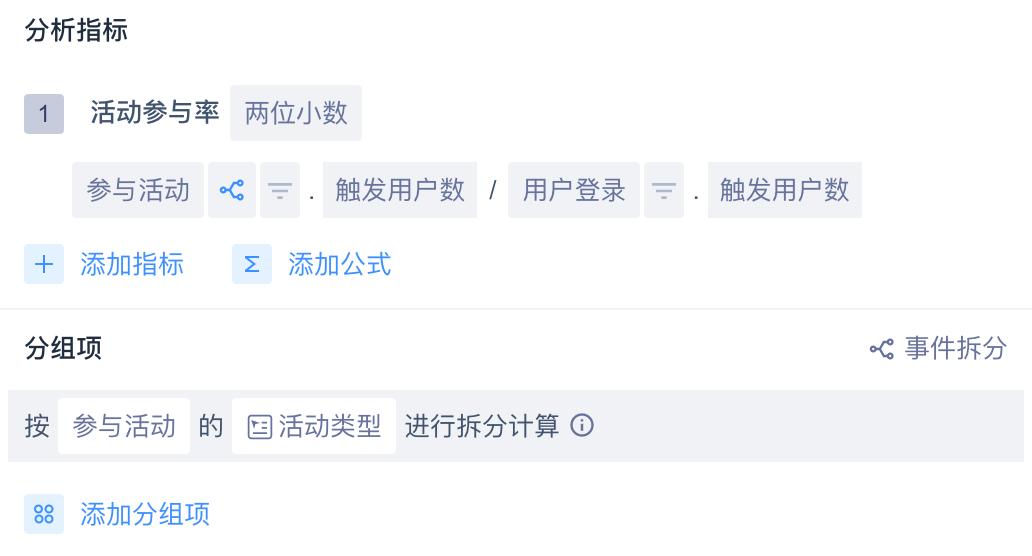
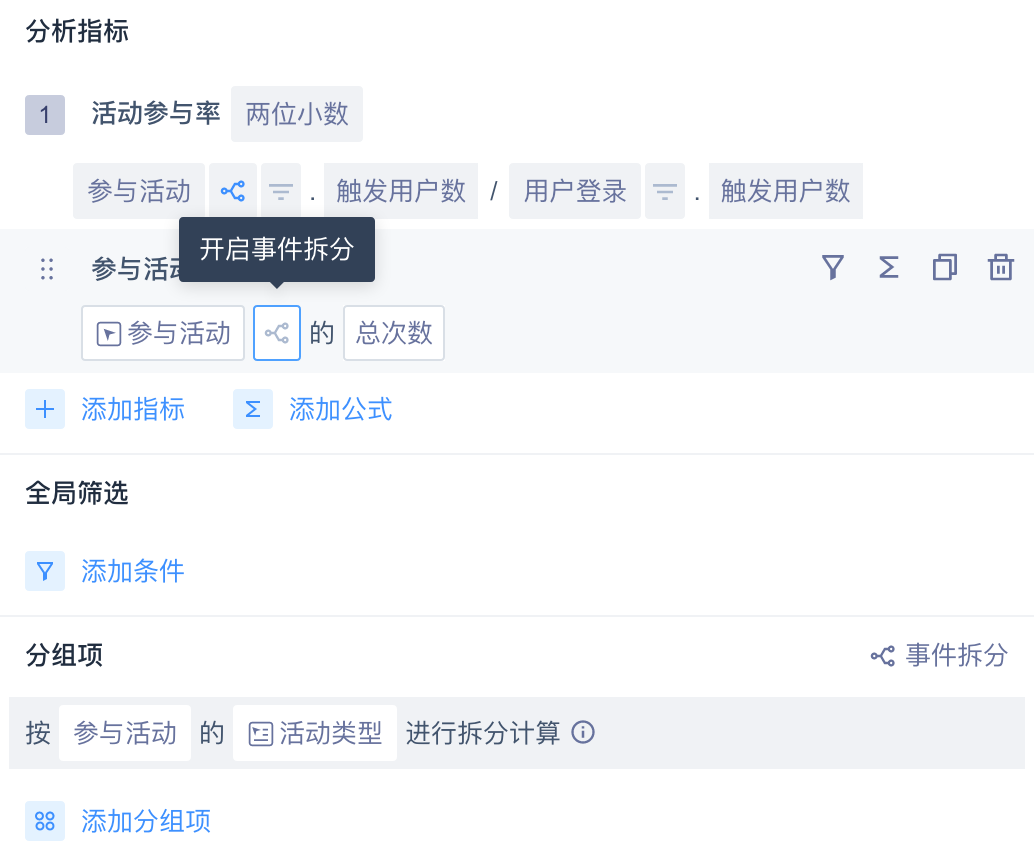
After selecting event splitting, you can click the splitting icon in the analysis index to set the state of event participation in splitting.
In the following figure, the indicators in the formula participated in the split, while the non-formula indicators did not participated in the split, i.e. the total number of participated activities and the participation rate of different types of activities were calculated.
# 3.2.4 Setting the Grouping
For numeric, temporal, and list attributes, you can set the mode when grouping items.
# 3.2.4.1 Numeric Attribute
| Grouping method | Computational logic |
|---|---|
| Default interval (default) | Automatic interval division according to the maximum and minimum values of actual data |
| Discrete numbers | Grouping by actual values |
| Custom interval | Customize the range of each interval, the interval is closed left and open right |
# 3.2.4.2 Time Attribute
| Grouping method | Computational logic |
|---|---|
| By day (default) | Data from the same day will be aggregated |
| By minute | The data of the same minute will be aggregated |
| By hour | Data from the same hour will be aggregated |
| By week | The data for the same week will be aggregated. The week start date defaults to Monday, which will be affected by the week start date setting in the analysis period |
| By month | Data from the same month will be aggregated |
# 3.2.4.3 List Attribute
| Grouping method | Computational logic |
|---|---|
| By element (default) | Split each list into multiple elements, and an event will be split into groups under multiple elements |
| By List Overall | Look at the list as a whole, like a string |
| Set by element | The overall difference from a list is that lists with the same elements but different orders will also be aggregated into a group |
If the grouping mode selected is "By Element"
- For single grouping: Each eligible list is evaluated under each list element.
- For multi-grouping (list + other types): Each eligible list is expanded under each list element
Note: You cannot select two list attributes at the same time in the grouping item, unless one is the dimension table of the other.
# 3.3 Selection of Filters
Events or users that match certain features can be selected for analysis by means of indicator filtering, V3.2.1 and above support a two-level logical nesting of filter criteria:

Click "Add Parallel Conditions" to add a layer of filtering nesting under the current conditions:
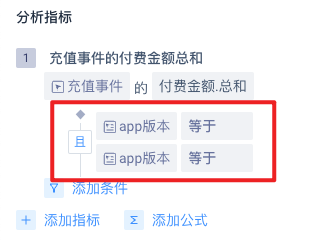
Filter condition structure:
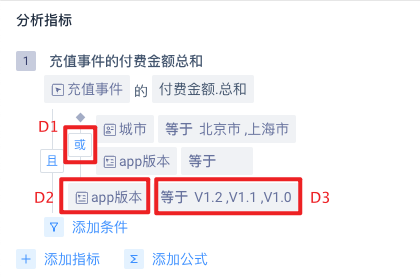
D1 [Logic between filtering Conditions]
D2 [Filtering Items]
D3 [Filtering Logic]
# 3.3.1 Rules for Filtering Projects
| Analytical indicators | Filter items |
|---|---|
| Event | Event properties under events, all user features, all user clusters, all user tags |
| Any event | Event properties common to all events, all user features, all user clusters, all user tags |
When selecting "User Grouping" to filter items, you can select "Belonging to Grouping" or "Not Belonging to Grouping".
# 3.3.2 The Relationship Between Filtering Items and Filtering Logic
| Filter item data types | Example | Supported filtering logic keywords |
|---|---|---|
| Value | Consumption amount | Equal to, not equal to, less than, less than or equal to, greater than, greater than or equal to, with value, without value, interval |
| Text | Province | Equal to, not equal to, include, not include, have value, have no value, regular match |
| List | ID list | Existing element, non-existing element, element location, value, no value |
| Time | Registration time, last active date (yyyy-MM-dd HH: mm: ss. (SSS or yyyy-MM-dd HH: mm: ss) | Located in interval, less than or equal to, greater than or equal to, relative to current date, relative to event occurrence time, with value, without value |
| Boolean | Wifi use | True, false, valuable, worthless |
| Object | Player resource snapshot | Value, no value |
| Object group | Expedition lineup | Existing object satisfies, no object satisfies, all objects satisfy, has value, has no value |
# 3.3.2.1 Numerical Attribute Filtering
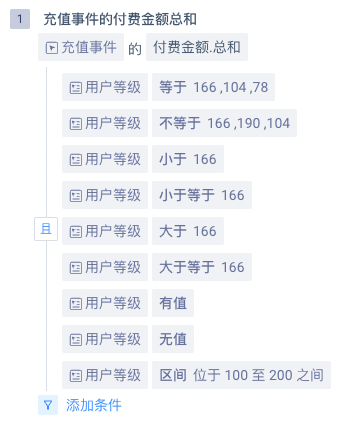
- Equal to: multiple settings can be selected, equal to any of them being considered eligible for filtering.
- Not equal to: multiple settings can be selected, and the attribute has a value and is not equal to either of them being considered eligible for filtering.
- Less than: less than the set value is considered eligible for filtering.
- Less than or equal: Less than or equal to the set value is considered eligible for filtering.
- Greater than: greater than the set value is considered eligible for filtering.
- Greater than or equal to: greater than or equal to the set value is considered eligible for filtering.
- Valued: the attribute is considered eligible for filtering.
- No value: if the attribute is null , it is considered eligible for filtering.
- Interval: the set value is a left-closed and right-Closed value interval in which the attribute values are considered eligible for filtering.
# 3.3.2.2 Numeric Attribute Filtering
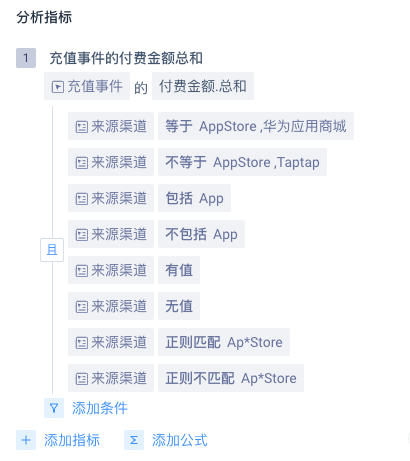
- Equal to: Multiple settings can be selected, equal to any of them being considered eligible for filtering.
- Not equal to: multiple settings can be selected, and the attribute has a value and is not equal to either of them being considered eligible for filtering.
- Includes: within the entire string of attribute values, any occurrence of a set value is considered eligible for filtering.
- Excluded: a set value is considered eligible if it does not appear throughout the string of attribute values.
- Valued: if the attribute has a value, it is considered eligible for filtering.
- Not valued: the attribute is null, it is considered eligible for filtering.
- Valued: the attribute is considered eligible for filtering.
- Regular matching: if the attribute value is a positive value, the expression is considered eligible for filtering.
- Regular mismatch: if the attribute value is not a positive value, the expression is considered eligible for filtering.
# 3.3.2.3 List Attribute Filtering
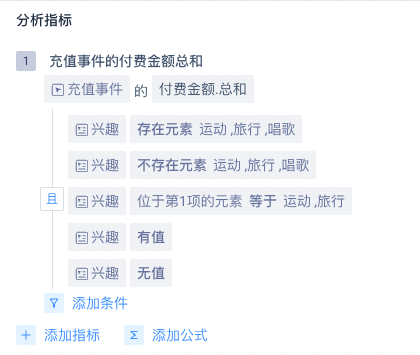
- Existence element: multiple settings can be selected, and any one element in the list equal to any one of the settings is considered eligible for filtering.
- Nonexistence element: multiple settings can be selected, and none of the elements in the list equals any of the settings is considered eligible for filtering.
- Element in item X: pick the element in item X (as a text type attribute) and use the filters that apply to this element using the text type attribute.
- Valued: the attribute has a value, it is considered eligible for filtering.
- Not valued: the attribute is null, it is considered eligible for filtering.
# 3.3.2.4 Time Attribute Filtering
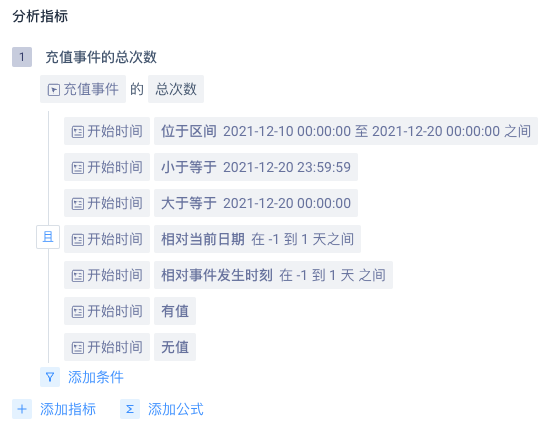
- Located in interval: start and end times can be selected to generate time intervals, and attribute values within time intervals are considered eligible for filtering.
- Less than or equal to: a point of time can be selected and an attribute value no later than the selected point of time will be considered eligible for filtering.
- Greater than or equal to: a point of time can be selected and an attribute value no earlier than the selected point of time will be considered eligible for filtering.
- Relative to the current date: the number of natural days between the numerical value and the query date is used as the evaluation standard.
- Past: the digital input box can enter an integer, the past 0 day means today, the past 1 day means yesterday.
- Interval: integers can be entered in the digital input box, positive numbers represent the following and negative numbers represent the preceding.
- Relative event occurrence time: the main dropdown menu has four options: interval, day, week, month.
- Interval: accessible numbers are integers with positive and negative signs, positive signs represent the following and negative signs represent the preceding and 0 represents equal. Units can select "days (relative) ", "hours", "minutes" and "days (relative) " are converted into 24 hours instead of natural days. Suppose the event occurs at 5:06 on August 2 of a certain year, the day before was from 5:06 on August 1 to 5:06 on August 2, and the day after was from 5:06 on August 2 to 5:06 on August 3, and the day before and after was from 5:06 on August 1 to 5:06 on August 3.
- Day: attirbute value and event time are within the same day.
- Current week: The attribute value and event occurrence time are within the same week.
- Current month: The attribute value and event occurrence time are within the same month.
- Valued: the attribute has a value, it is considered eligible for filtering.
- Not valued: the attribute is null, it is considered eligible for filtering.
DANGER
- Temporal event attributes are offset by the time zone currently selected by the model and then compared according to the filtering logic.
- There will be no offset for timed user attributes or user labels.
- Relative event occurrence time, which is also the event occurrence time after the relative time zone offset (#event_time)
# 3.3.2.5 Boolean Attribute Filtering
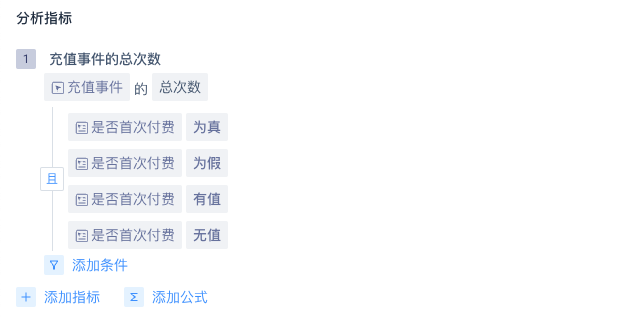
- True: If this attribute is True, it is considered eligible for filtering.
- False: If this attribute is False, it is considered eligible for filtering.
- Valued: the attribute has a value, it is considered eligible for filtering.
- Not valued: the attribute does not have a value, it is considered eligible for filtering.
# 3.3.2.6 Object Type Property Filtering
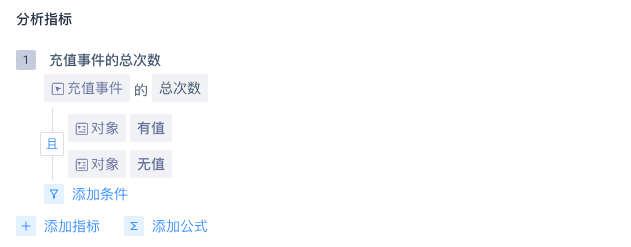
- Valued: If the attribute has a value, it is considered eligible for filtering.
- Not valued: If the attribute does not have a value, it is considered eligible for filtering.
# 3.3.2.7 Object Group Attribute Filtering
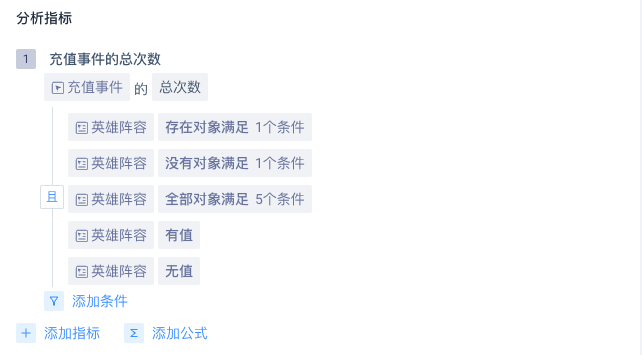
- Existence object: any object in the object group that meets the set condition is considered eligible for filtering.
- No object: no object in the object group meets the set condition and is considered eligible for filtering.
- All objects: all objects in the object group that meet the set condition are considered eligible for filtering.
- Valued: if the attribute has a value, it is considered eligible for filtering.
- Not valued: the attribute is null, it is considered eligible for filtering.
Existing objects meet/no objects meet/all objects meet the need to be set additional filtering conditions, you can add conditions for each sub-attribute in the object group, and the conditions available for each sub-attribute are related to its attribute type; between filtering conditions, you can select "and"/"or" two relationships.
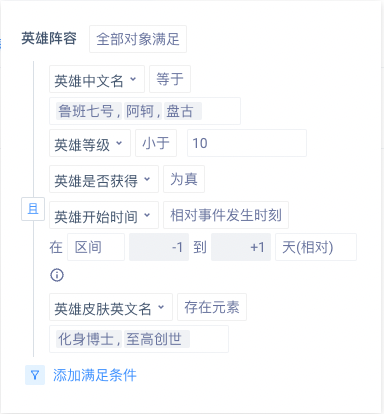
# 3.3.3 Set Logic Between Filter Conditions When Multiple Filter Conditions Exist
D1 [Inter-filter logic] appears when the filter condition is greater than or equal to two items. The default is "and". You can click to switch to "or" to adapt to different application scenarios . You can set up up to two layers of filter conditions.
# 3.4 Report Setup, Display, Download and Save
When the "analysis angle setting area" is completely selected, click "start calculation" to display the chart results in the "chart display area".
# 3.4.1 Display the Filter Area Settings
# 3.4.1.1 Analysis Period and Analysis Granularity
It means selecting the time interval and subdivision time granularity to be analyzed:
The default option for analysis period is "past 30 days" of dynamic time, and the default granularity of analysis time is "daily".
Analysis period: today, yesterday, nearly 7 days, nearly 14 days, nearly 30 days, this week, last week, this month and last month can be selected.
Time granularity can be selected by minutes, hours, days, weeks, months, and totals:
Data can be filtered down to hours when searching by minutes or hours is selected.
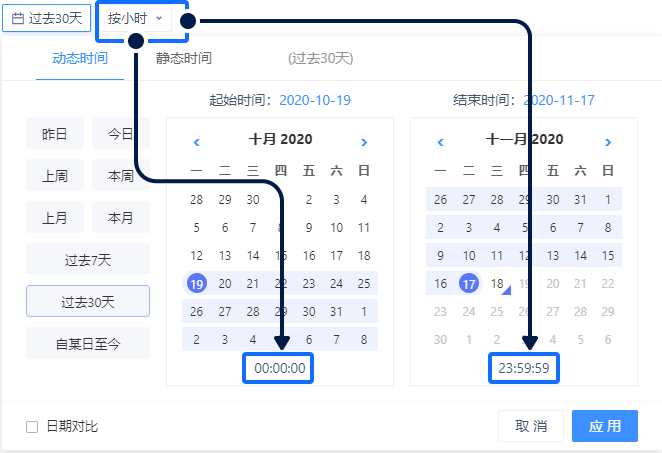
A. Select by minute: calculate data up to 1440 points from the last natural day of the time checkbox. If the checkbox reaches a full day but contains today, it may be less than 1440 points.
B. Select by hour: A maximum of 720 points are calculated for a time check box that is 30 days from the last day. If the checxbox is 30 days but contains today, it may be less than 720 points.
C. Select By Day: only data within two years (731 points) of the last day of the time checkbox is calculated at most.
D. Select by week: The natural week (Monday to Sunday) included in the time period will be filtered out first, with the following note:'First day of the Week'and a maximum of 720 points displayed.
E. Select Month: The natural month included in the time period will be filtered out first. with the following note:'This Month'and a maximum of 720 points displayed.
F. Select Total: Select the combined time to calculate the total value of all values in the period.
# 3.4.1.2 Display Analysis Indicators and Display Grouping
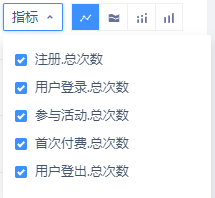
It means selecting the analysis content that needs to be presented in the chart immediately:
Show analysis objects: All analysis objects are displayed by default, up to 10 items. You can modify the objects to be analyzed in the checkbox.
Show groupings: You can modify the groupings to be analyzed in the checkbox. When there is no sorting, the sorting logic of the option is that the total value of the legend in the chart is sorted from large to small according to the sum of the analyzed objects; when there is sorting, the sorting logic of the option is consistent with the currently set collation rule.
# 3.4.1.3 Sorting of Chart Groupings
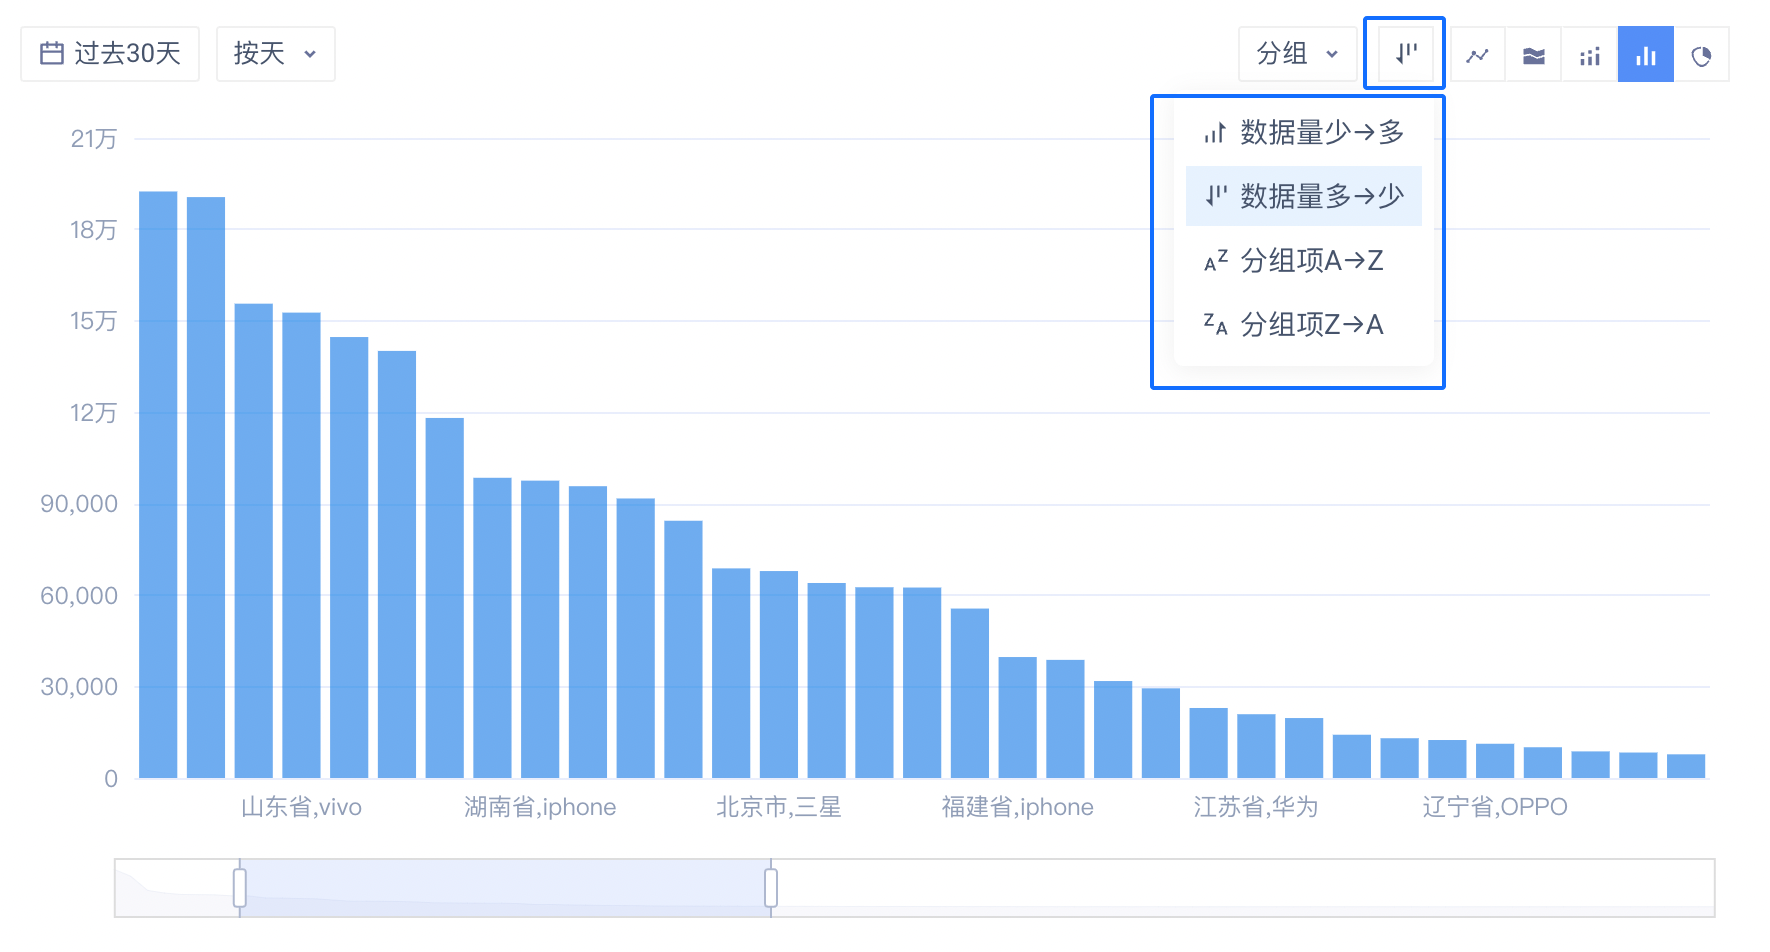
When the grouping of a single indicator is > = 2, the sort button is displayed, and the following four sorting methods are provided for the grouping:
A. Less data → more: in ascending order of index values.
B. More data → less: sorted in descending order by index value, sorted by default for the system.
C. Group item A → Z: display in ascending order of group name.
D. Group Items Z → A: in descending lexicographical order of group names.
When switching sorting, the display order of the grouped list is updated synchronously, always consistent with the current sorting settings.
If the display group is not checked by custom, the top N item under the current sorting is checked by default every time the sorting is switched (N is the currently set number of display items); if there is a custom check group, the previous check option remains unchanged after the sorting is switched.
The sorting function only takes effect for event analysis (charts other than pie charts) and attribute analysis. The objects sorted in the attribute analysis are groups with abscissa axes, and the display order of the options in the group list is not affected.
# 3.4.1.4 Chart Style Selection
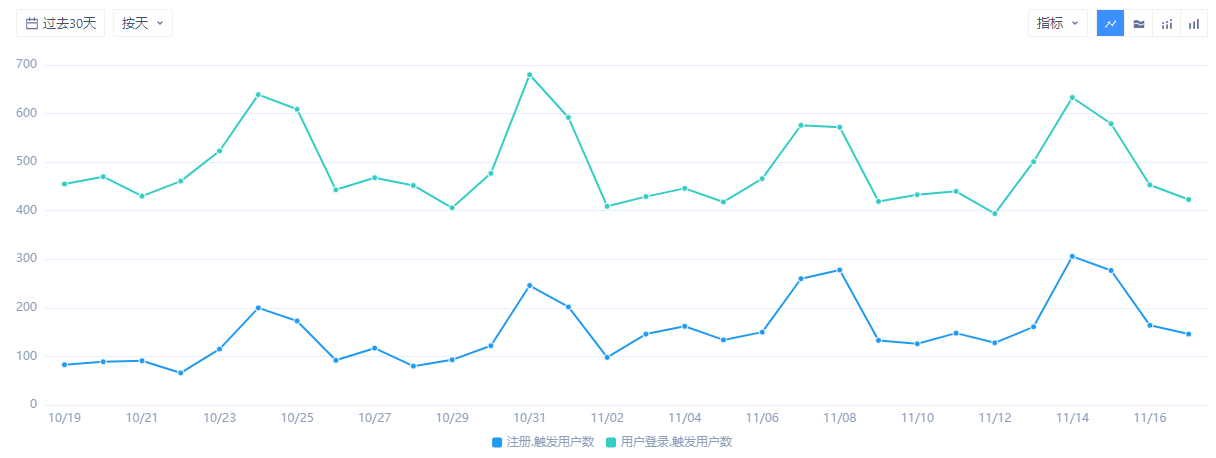
Default shows trend break-lines, with many styles available such as break-lines, bar charts, etc. Line graphs represent trends and use the time dimension as the abscissa. The histogram represents the distribution, with the item as the abscissa and the total value in the time interval as the ordinate.
# 3.4.2 Display and Download of the Report
# 3.4.2.1 Chart Area Display
The chart title shows the display name information of the analyzed object.
The legend part displays in turn according to the total number of legends formed by analyzing objects and grouping.
The display data is jointly determined and presented according to the analysis period, analysis granularity, analysis objects, grouping, and chart style.
Display of line trend chart:
Display of histogram:
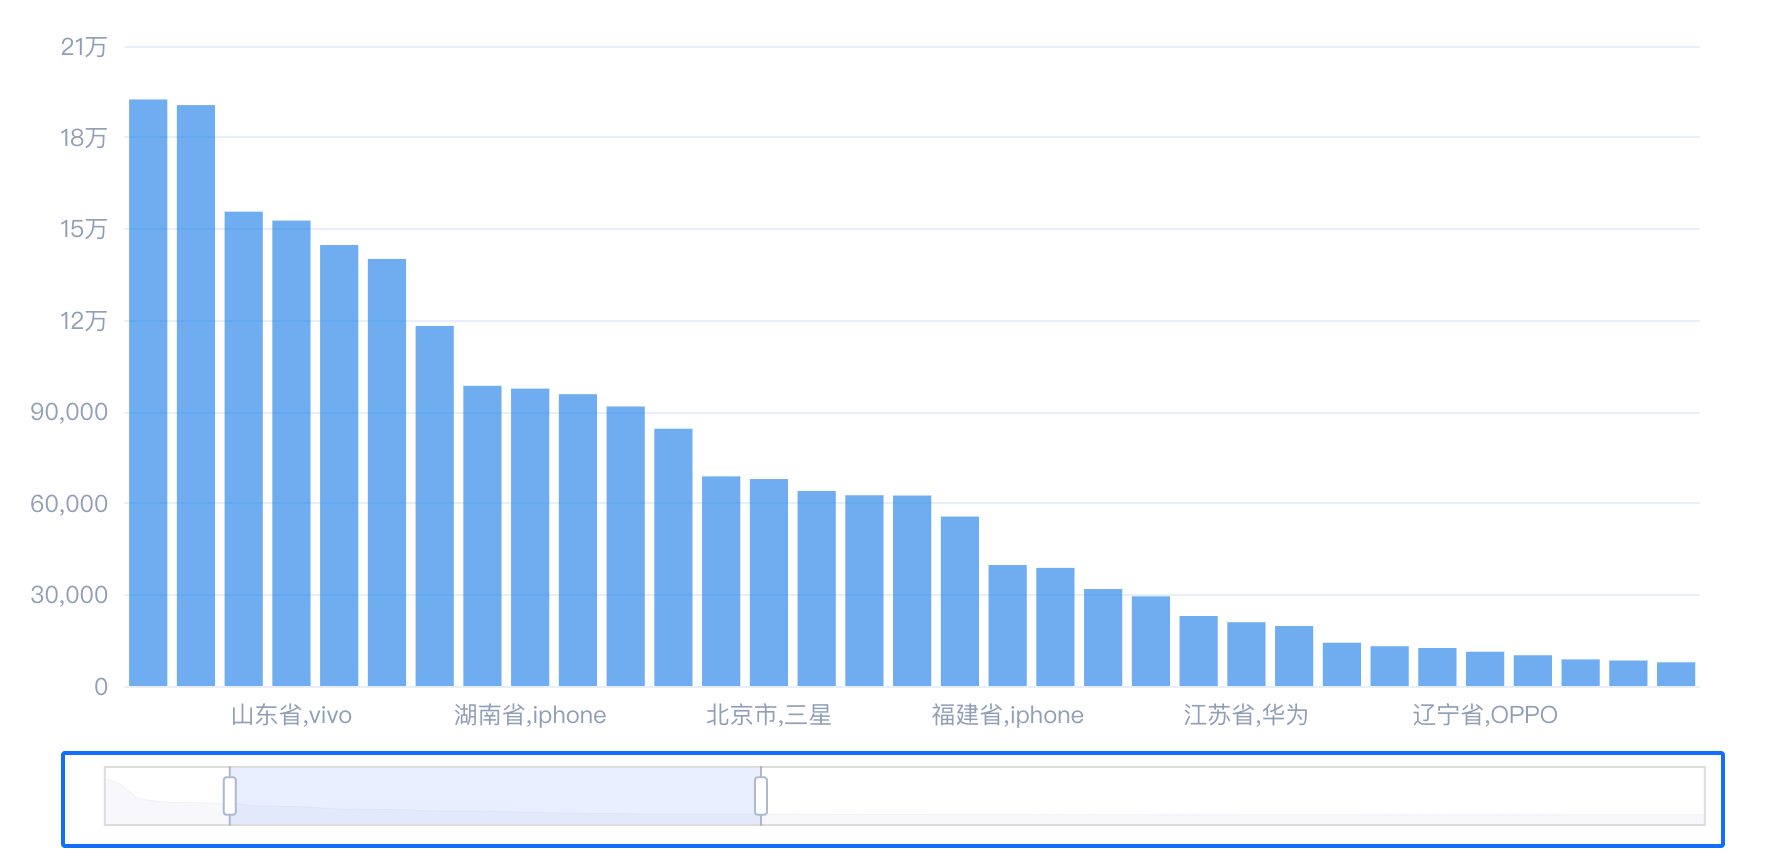
When the number of groups is too large, the zoom slider is displayed at the bottom of the chart to adjust the viewing range.
# 3.4.2.2 Search for Grouping Items

You can filter grouping items, such as searching for "Beijing" when grouping by province.
When viewing by multiple groups (up to 3), you can also search by 'unlimited'.
# 3.4.2.3 Table Area Display and Download Data
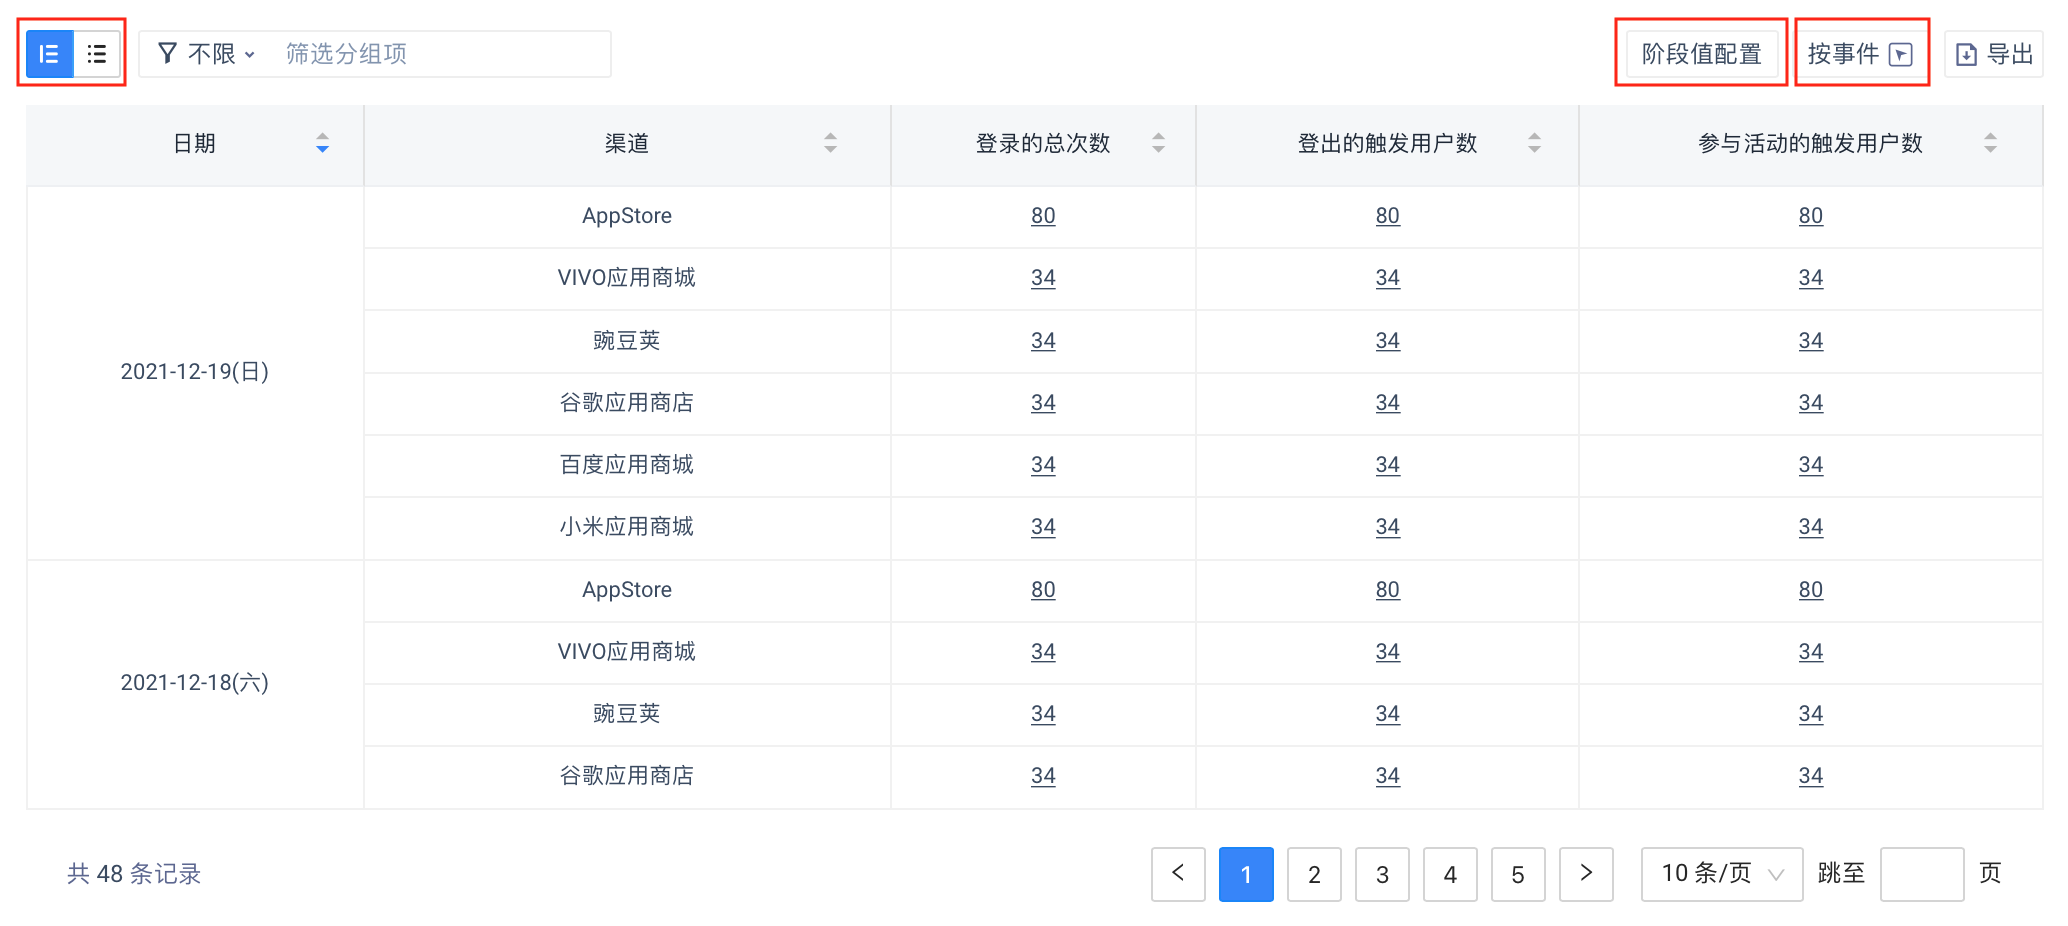
A. The display data in the table area does not change with the change of the display filter.
B. The resolution method of time granularity is consistent with the analysis granularity.
C. When the sub-index has more granularity, it can slide to the right to show more content.
D . When rows and columns need to be exchanged, you can switch between "by time", "by event" and "by group" views when there are grouped items.
E. The system will automatically find the "stage aggregate value" for each index to display the sum or average of the results of the index during the analysis period. You can enter the "stage value configuration" to adjust the default logic or set whether to display the stage value.
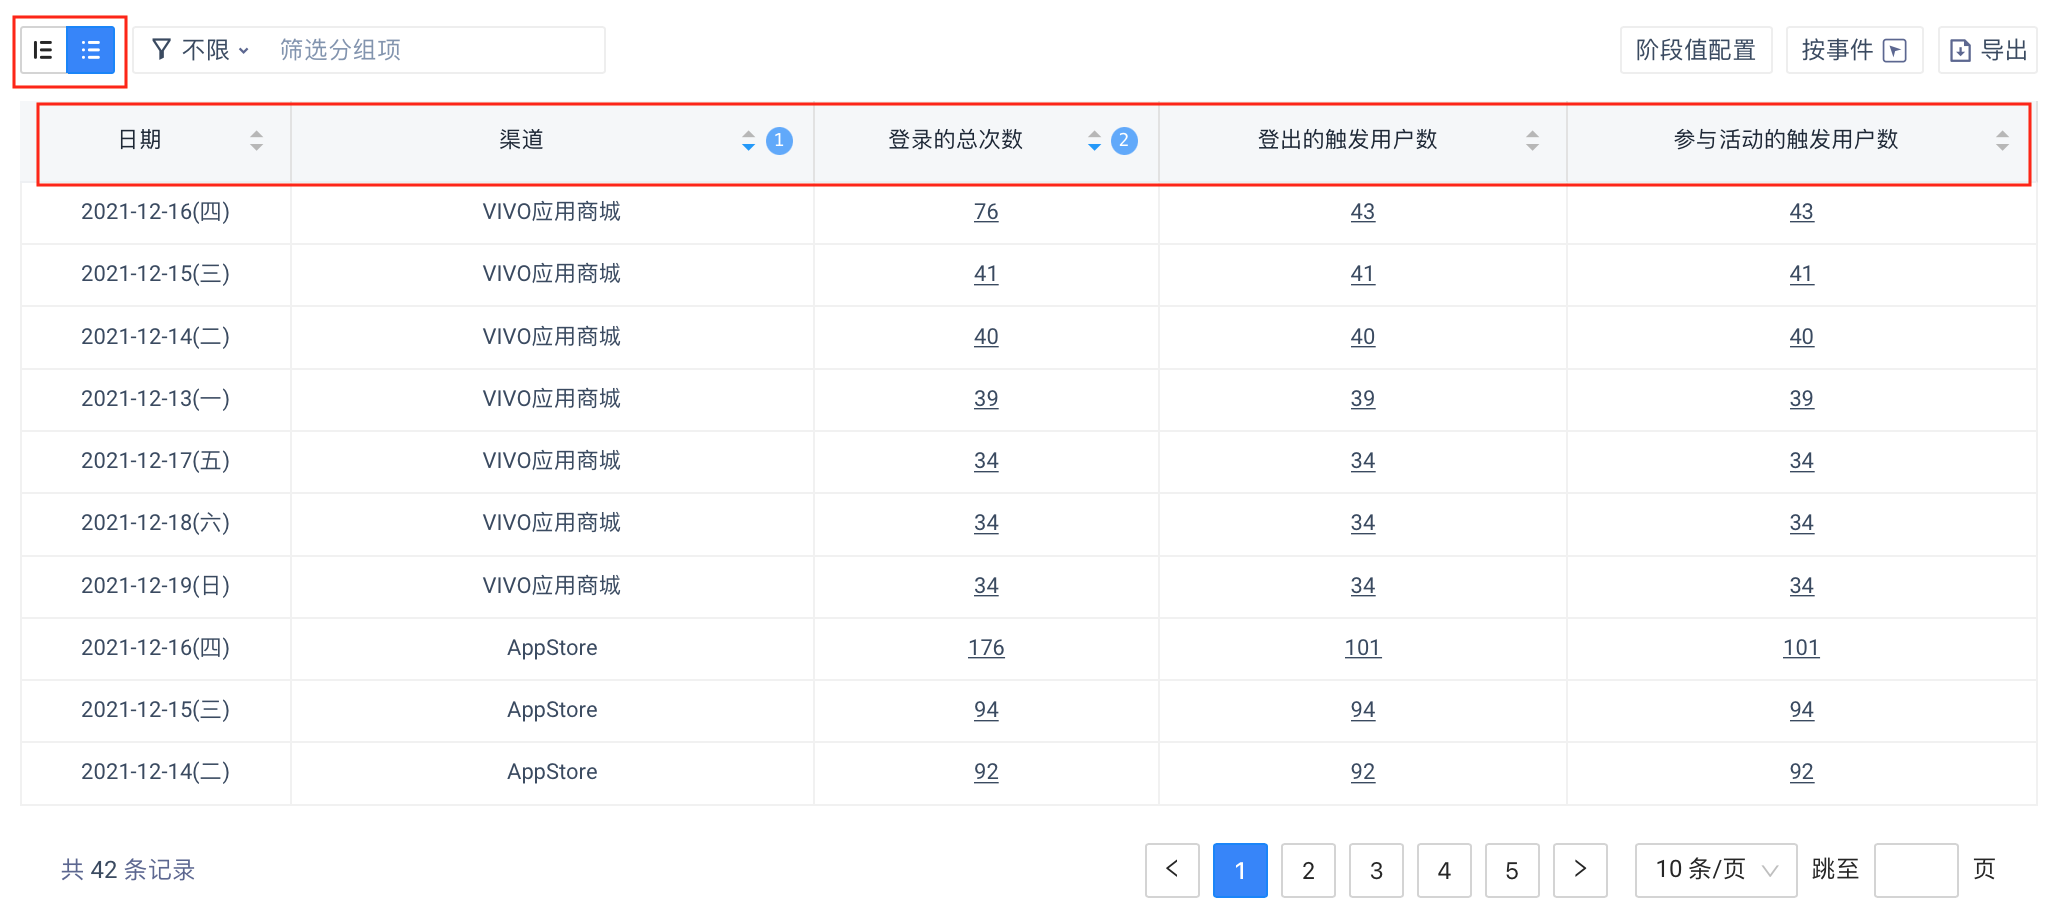
F. For ease of reading, the results are displayed by default in the "merge" header. To cancel the merge, you can select the form "side-by-side" display.
D. In the combined state, the specified columns can be sorted; In the flat state, multiple columns can be sorted, and adjusting the ranking of the front columns clears the ranking of the rear columns.
# 3.4.3 Time Comparison Function
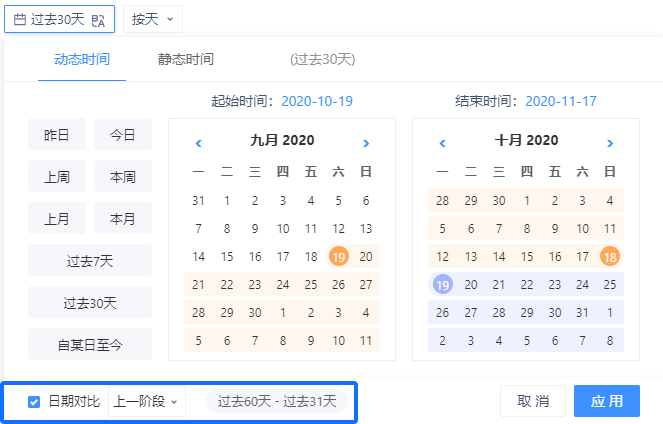
# 3.4.3.1 Selection of Date Comparison Options
When the Date Comparison option is selected, an option for comparing periods appears. You can select the date you want to compare.
(1) After selection, the original date is directly locked and will not be affected.
(2) The default selection method is "previous stage" and the corresponding date is directly given according to dynamic or static time.
Note that when the original date chooses 'This Week', 'Last Week', 'This Month', 'Last Month', the comparison date becomes 'Last Week', 'Last Week', 'Last Month', 'Last Month'.
# 3.4.3.2 Impact of Date Comparison on Event Analysis
(1) The Impact of Date Comparison on the Chart
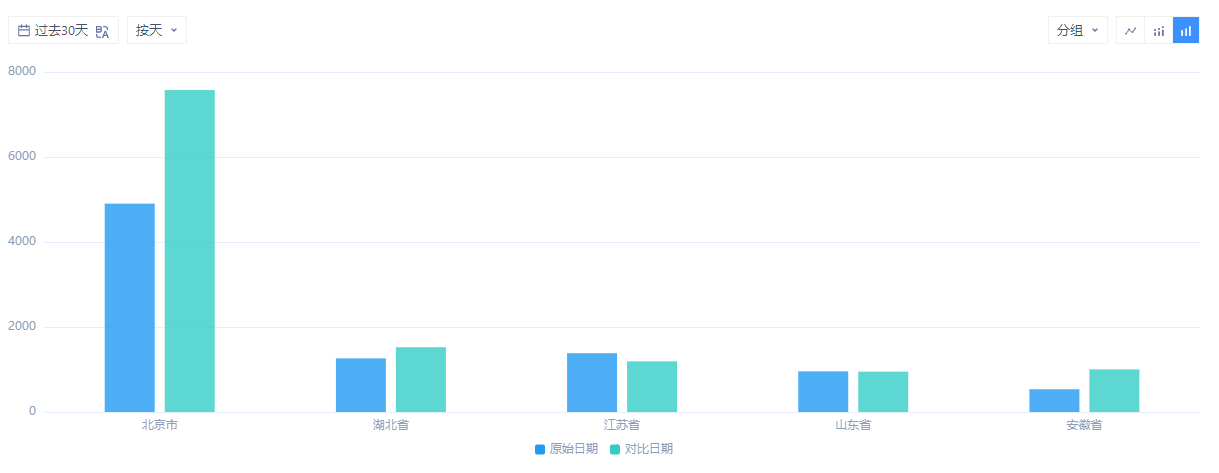
When there is a date comparison, only trend chart or distribution chart or cumulative chart can be selected. If you switch from another chart type, the trend chart is switched by default.
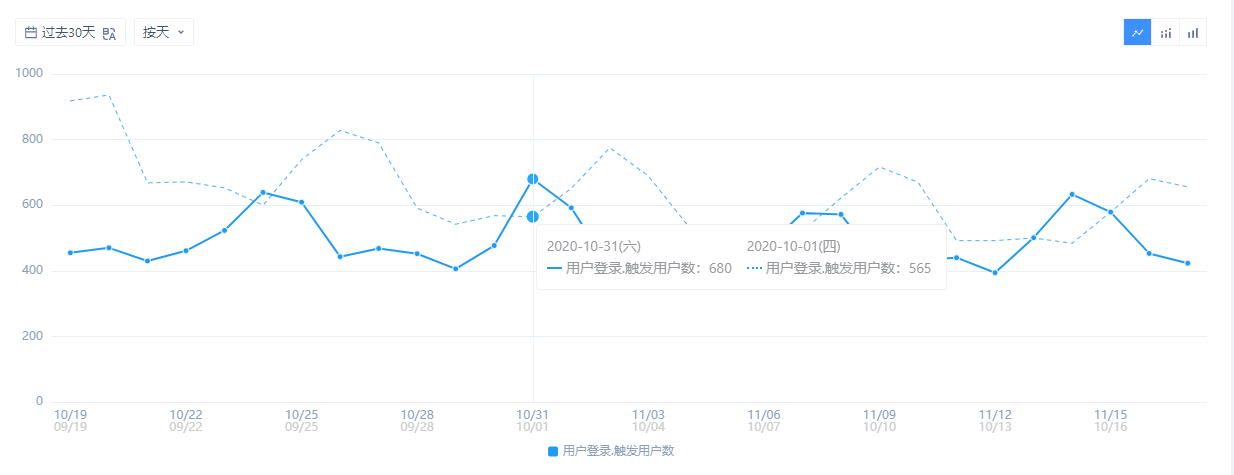
(2) Trend Chart
A. The comparison date item is represented by a dotted line, sharing a legend with the original date, and the legend name remains unchanged.
B. The timeline shows two sets of times in two lines, with the original date on top.
C Move the mouse into the area and you can view the data under two sets of time.
(3) Distribution Map
# 3.4.3.3 Date Comparison for Table Display
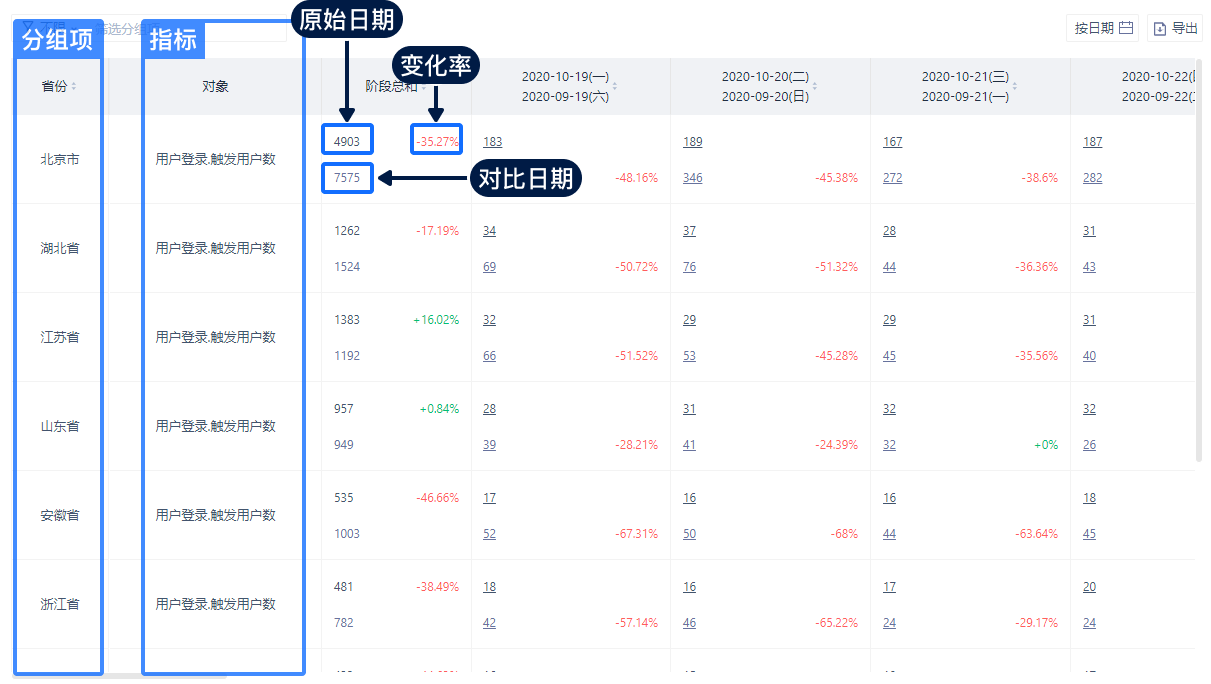
Taking multi-analysis objects and multi-group conditions as the example, this illustrates the way to show when date contrast is added to the display state.
# 3.4.3.4 Impact of Date Comparison in Dashboard
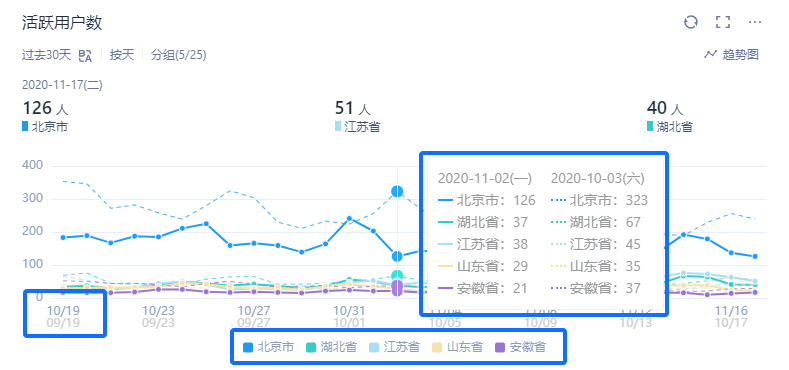
The grouped data under the original date will be represented by a solid line, and the grouped data under the comparison date will be represented by a dashed line. The timeline will have two axes: the original date and the comparison date.
# 3.4.4 Query and Download of Event Details
# 3.4.4.1 When Analyzing the Total Number of Events, Add Details Options to the Table
Select the total number of times the event is analyzed, and the user can enter the event details by clicking the link in the table。
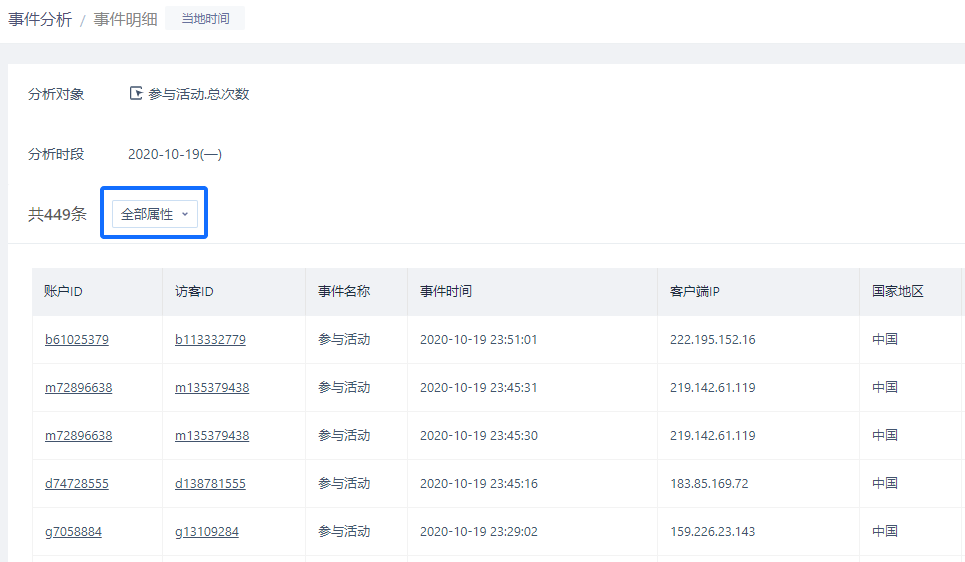
Record the condition of the analysis index, the time period of the analysis (note the time comparison function), and the time point of the analysis.
# 3.4.4.2 Number of Records
And record the number of loaded bars (up to 1000 are displayed and up to 500,000 can be downloaded via the data download function).
# 3.4.4.3 Table Filtering Criteria
Event attributes included in the event can be filtered to select the attributes required for display or download.
# 3.4.5 Reports Saving
See Report Management for more information.
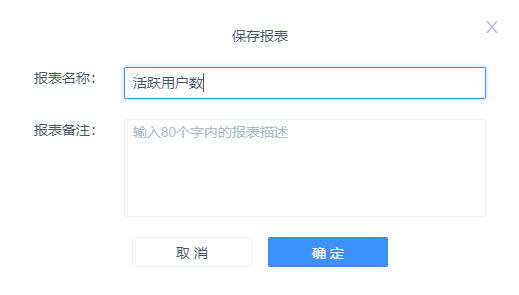
After [Confirmation Analysis] of the contents of the data, the report can be saved to facilitate the configuration and viewing of the data on dashboard afterwards.
When saving, you need to enter [Report Name], [Report Introduction], and save the report quickly into an existing [data dashboard] to facilitate daily viewing.
After saving, you can edit and modify the report in the report management of event analysis.
# 4.Best Applications
# 4.1 Understand the Basic Indicators of Each Behavior
Event analysis can cover the calculation of most aggregate indicators, including the number of participants, the number of times, the number of times per capita of a certain behavior, and the aggregate value of the attribute of the behavior value type. The aggregation of these event analysis indicators provides a basic understanding of participation in the behavior. For example, from the overall participation of an activity, we can calculate the number of participants, the number of participants and the participation rate through event analysis, and we can get the trend and distribution of these indicators. Through the above analysis, we can have a general understanding of the basic situation of the activity, on which we can drill down further or learn more in-depth indicators in other analysis models.
