# SQL IDE
# I. Introduction of SQL Query
For advanced analysis that is difficult to implement using analysis models, you can use SQL queries to do it. TA system uses Presto query engine and can use standard SQL to query all data in the system quickly.
In addition, we provide the function of dynamic parameters to help users change part of the parameters in the statement to adapt to the new query conditions by adjusting the parameter values without modifying the SQL statement, so this enables multiple uses in one write.
The result of SQL query can be saved as a report to support data viewing in Dashboard and real-time modification of dynamic parameters of SQL report with exploratory module in Dashboard to enable the ability of adjusting conditions in other similar models.
# II. Location and Applicable Role of SQL Query
Can be accessed from "SQL Query" under the "Behavior Analysis" module
| Company Supervisor | Administrator | Analyst | Ordinary members | |
|---|---|---|---|---|
| SQL query | ● | ● | △ | △ |
Permission description:
● Role must have
▲ The role has the permission by default, but can revoke
△ The role is not available by default, but can be authorized
○ Role must not have
It should be noted that the analyst role that comes with the system does not have the permission to 'use SQL query'. If you need to use it, you can add SQL access permission to the newly created analyst or above roles and provide it to the user.
# III. Overview of SQL Query Page
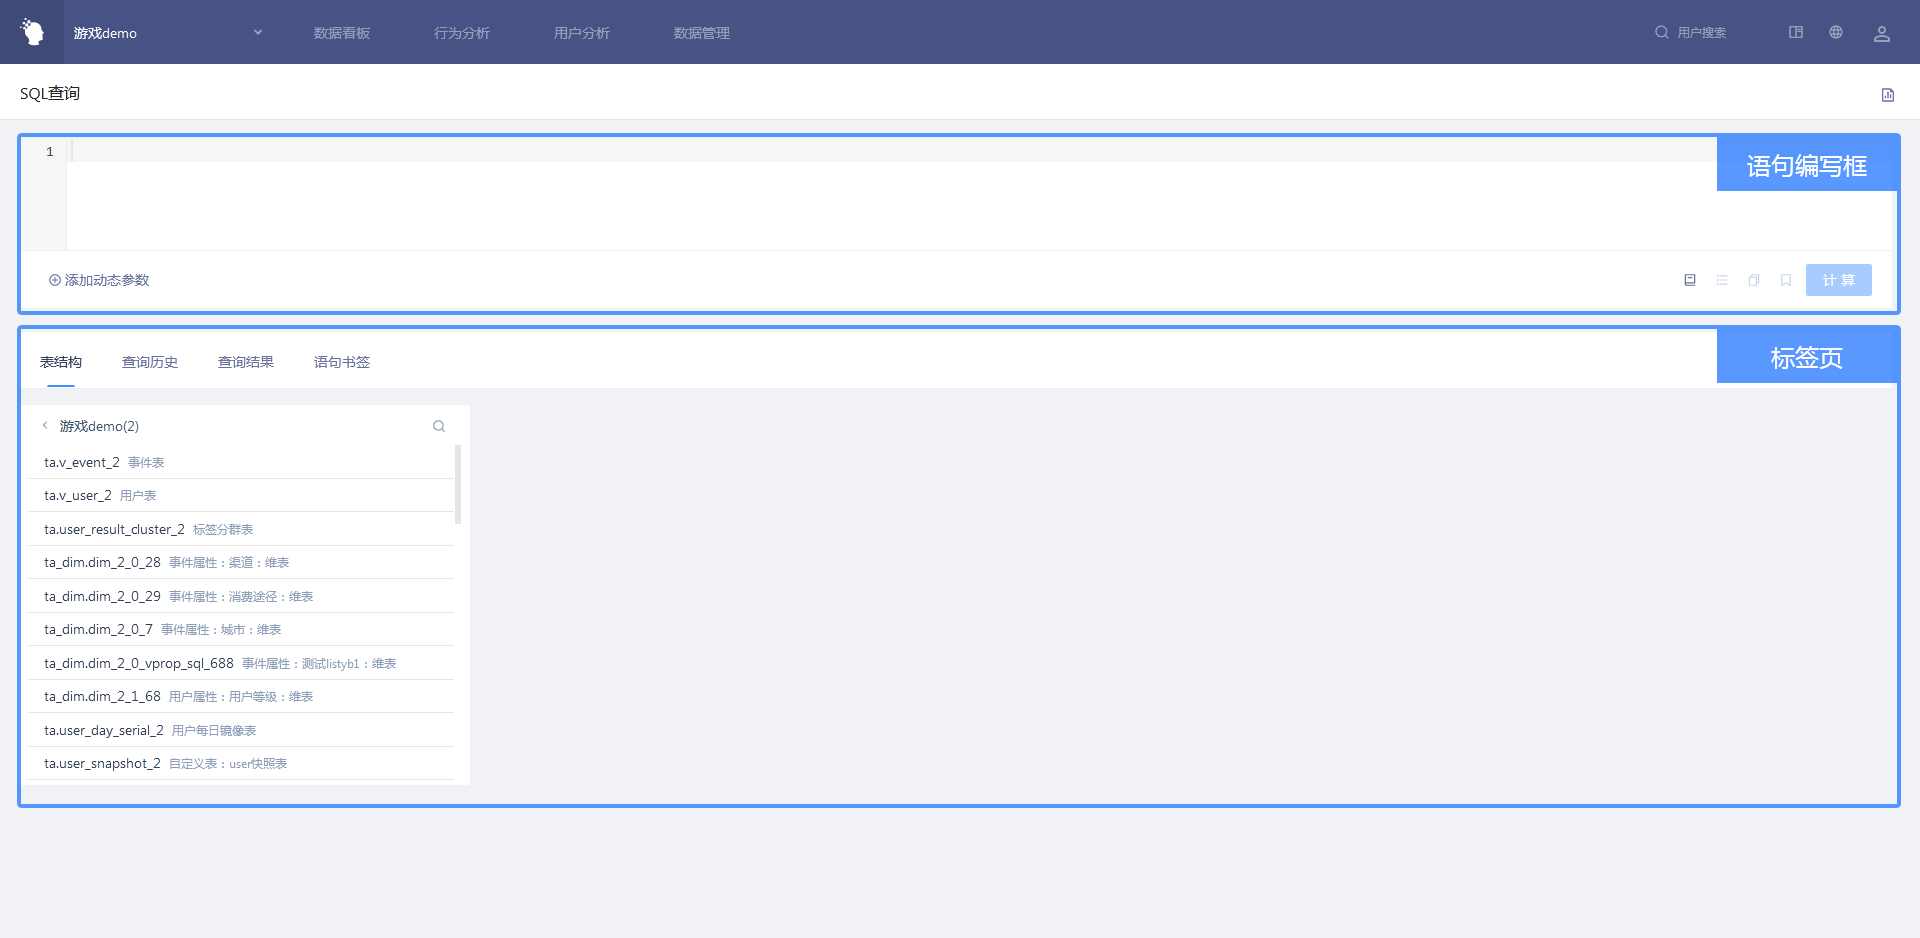
The page of SQL query mainly consists of the statement writing box in the top half and the tag page in the bottom half. The tag page is divided into four TAB pages, which are 'Table Structure', 'Query History', 'Query Results' and 'Statement Bookmark' tag pages.
# 3.1 Statement Writing Box

The core of the statement writing box is the statement input box. When writing SQL query statements in the input box, you need to pay attention to the following points:
- Please use double quotation marks
""to enclose the field name, which can also be the default, but if the query field name has special symbols (such as$,#), you must use double quotation marks. - String must be enclosed in single quotes
''. - You can use the
SELECTstatement and theWITHclause. - When querying the transaction table, try to use the partition keys
"$part_date"and"$part_event"to filter the data time and query events to improve the efficiency of the query. - Attributes of list types in the form of string stored at the bottom, use
\ tto split elements, if you need to convert them to list type, it is recommended to use the copy attribute name function (the copy content of the list attribute contains the expression converted to the list), or use the functionsplit ("attribute name", chr (0009))to disassemble.
When the cursor is in the input box, you can use the following shortcuts:
Ctrl + Enter: Execute statementsCtrl + Shift + F: Format statementsCtrl + Z: UndoCtrl + Y: Recovery
The toolbar of the statement writing box is located below the input box. You can click the 'Add Dynamic Parameters' button on the left side of the toolbar to insert a dynamic parameter at the end of the statement. The ICON on the right side of the toolbar from left to right is:
- Help: View shortcuts for SQL query and related help document.
- Formatting: Format query statements.
- Copy statement: Copy the query statement in the input box to clipboard.
- Add bookmarks: Save the query statement as a bookmark to facilitate subsequent query or modification.
- Calculation: Execute the query statement in the input box.
# 3.2 Tab Page
# 3.2.1 Table Structure
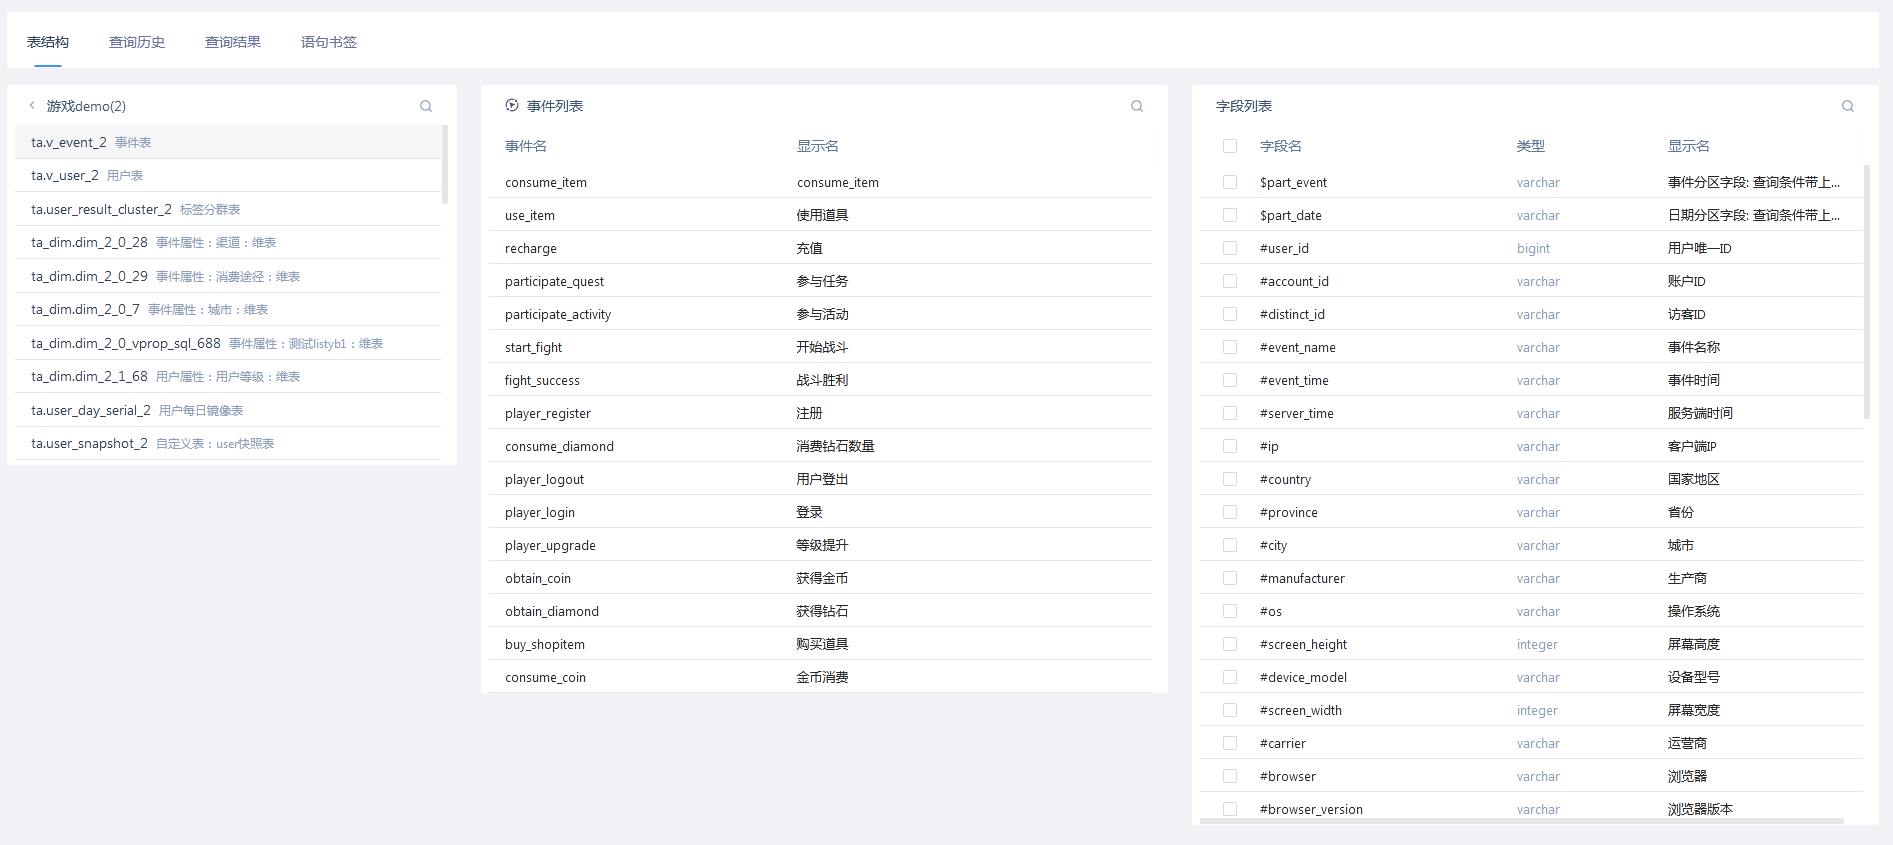
The 'Table Structure' tab mainly displays the structure of the data table.
# 3.2.1.1 Overview of Data Sheets
On the left-most side of the 'Tab Structure' tab is the data sheet overview, which allows you to view a table of all items with access. Click on the relevant table in the overview and the field information for that table will be displayed on the right side of the tab page.
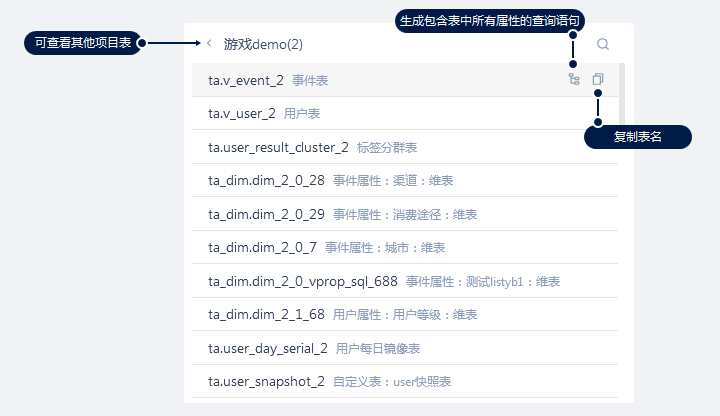
In Datasheet Overview, the types of datasheets that you can view and query are:
- Transaction table
- User table
- Dimension table
- Group tag table
- Temporary tables (see section 4.4)
- Custom tables (generated using secondary power builder)
- User daily mirror table (need to contact TA staff to open)
- External data sources associated with Presto (with the help of Presto Connectors, you can contact TA staff to understand the association method)
Click the 'Back' button in the upper left corner of the overview to view and query the data sheets of other projects that also have the 'Query with SQL' permission.
Clicking the ‘’Table Resolution ‘ ’button at the end of the table generates a query statement that contains all the fields of the table and inserts a new line at the end of the input box. With this statement, you can quickly get detailed data of the data table and help understand the table structure.
Click the ‘’Copy Table Name‘’ button to copy the table name of the table to clipboard.
# 3.2.1.2 Field List
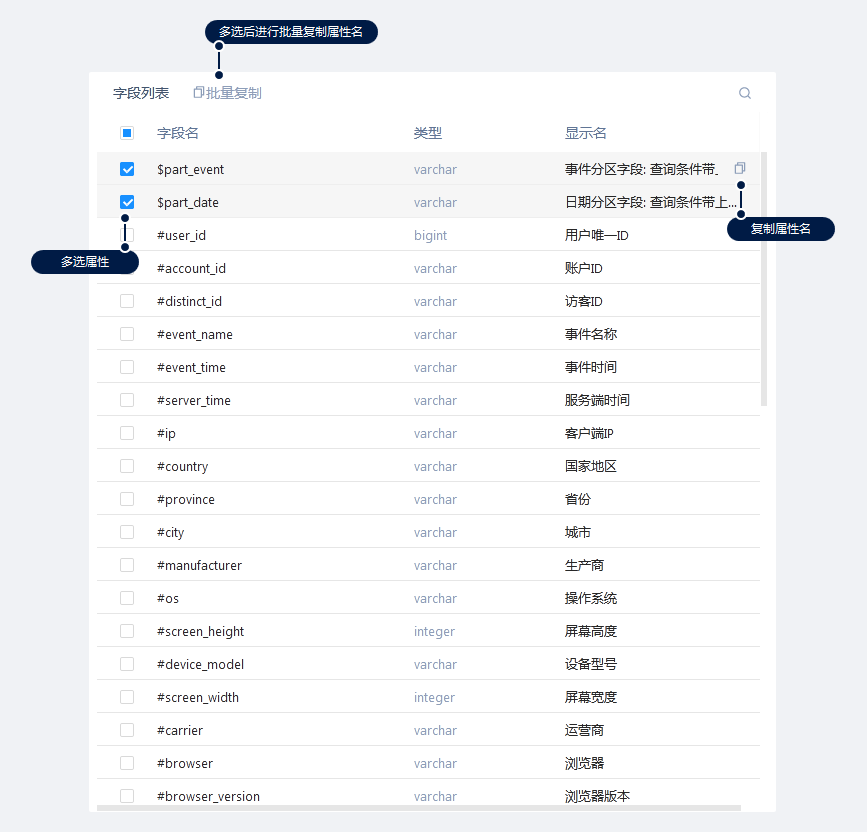
The field list presents information about all the fields of the selected table, including the attribute name, attribute type, and attribute Chinese name.
- Click the 'Copy' button after the field to copy the field name of the field, which will be enclosed in double quotes
"". - Click the check box in front of the field to select multiple fields and copy multiple fields in batches. Each field is enclosed in double quotes
"", and the fields are separated by commas,. - Attributes of the list type that will contain an expression that converts the field (stored as a string) to a list when copied.
# 3.2.1.3 Event List
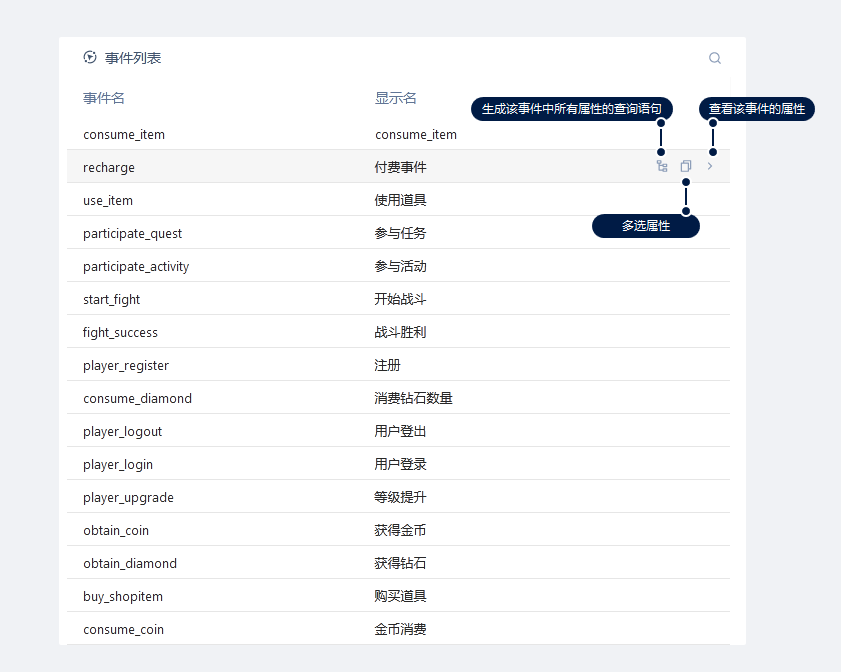
The event list will only be displayed when the transaction table is selected. It shows the actual events (not including virtual events) of all the displayed states in the selected item. It is recommended to use this list to obtain the corresponding attribute information of the event when viewing the event data.
- Click the 'Event Resolution' button, a query statement containing all the fields of the event will be generated, which will be inserted at the end of the input box. Through this statement, the detailed data of the event can be quickly displayed.
- Click the 'Copy Event Name' button to copy the event name to clipboard.
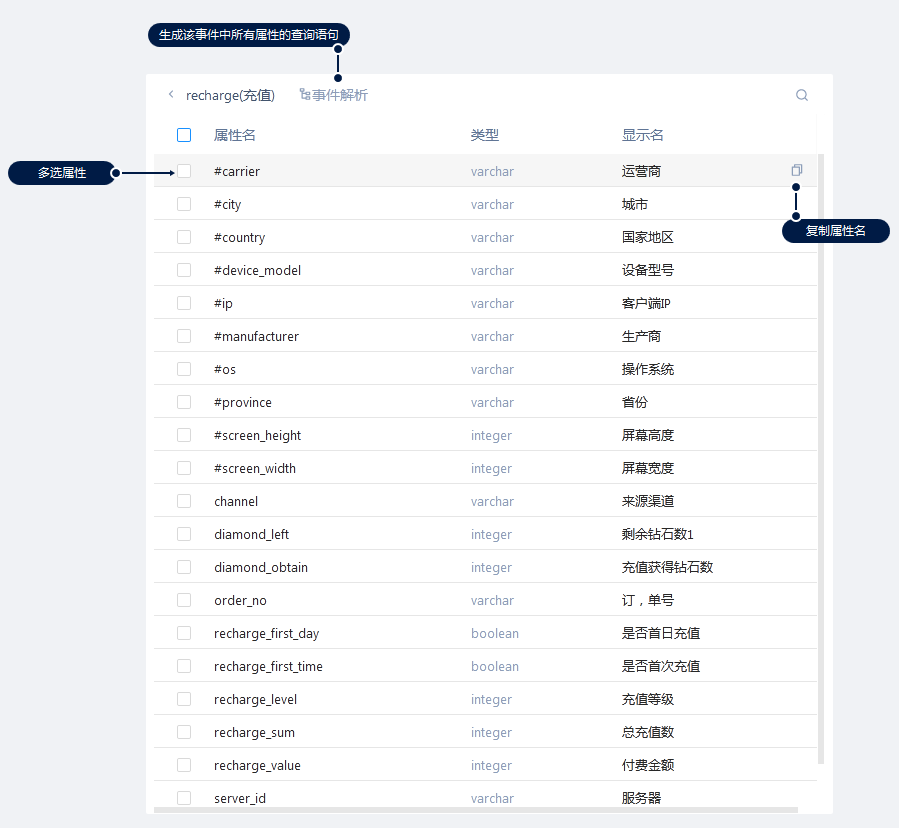
Click on the row of the event on the table or the arrow at the end of the row to view all attributes of the event.
- Click 'Event Resolution' at the top to get a query statement that contains all the fields of the event.
- Click the ‘’Copy‘ button after the field to copy the field name, which will be enclosed in double quotes
"". - Click the check box in front of the field to select multiple fields and copy multiple fields in batches. Each field is enclosed in double quotes
"", and the fields are separated by commas,. - Attributes of the list type that will contain an expression that converts the field (stored as a string) to a list when copied.
# 3.2.1.4 Group Tag List
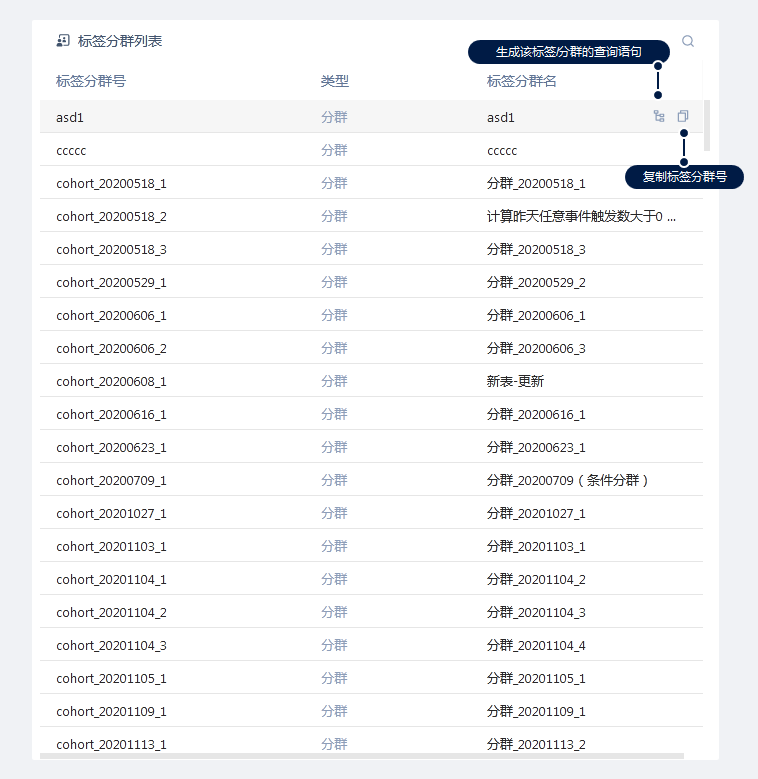
The group tag list will only be displayed when the group tag table is selected. It shows all tags and groups in the selected item. It is recommended to obtain the required group tag information through the group tag list.
- Click the 'Group Tag Analysis' button, a tag or group query statement will be generated, which can be inserted in a line break at the end of the input box. On this basis, it is possible to modify and complete the association query.
- Click the 'Copy Group Tag Number' button to copy its group tag number.
# 3.2.2 Query History
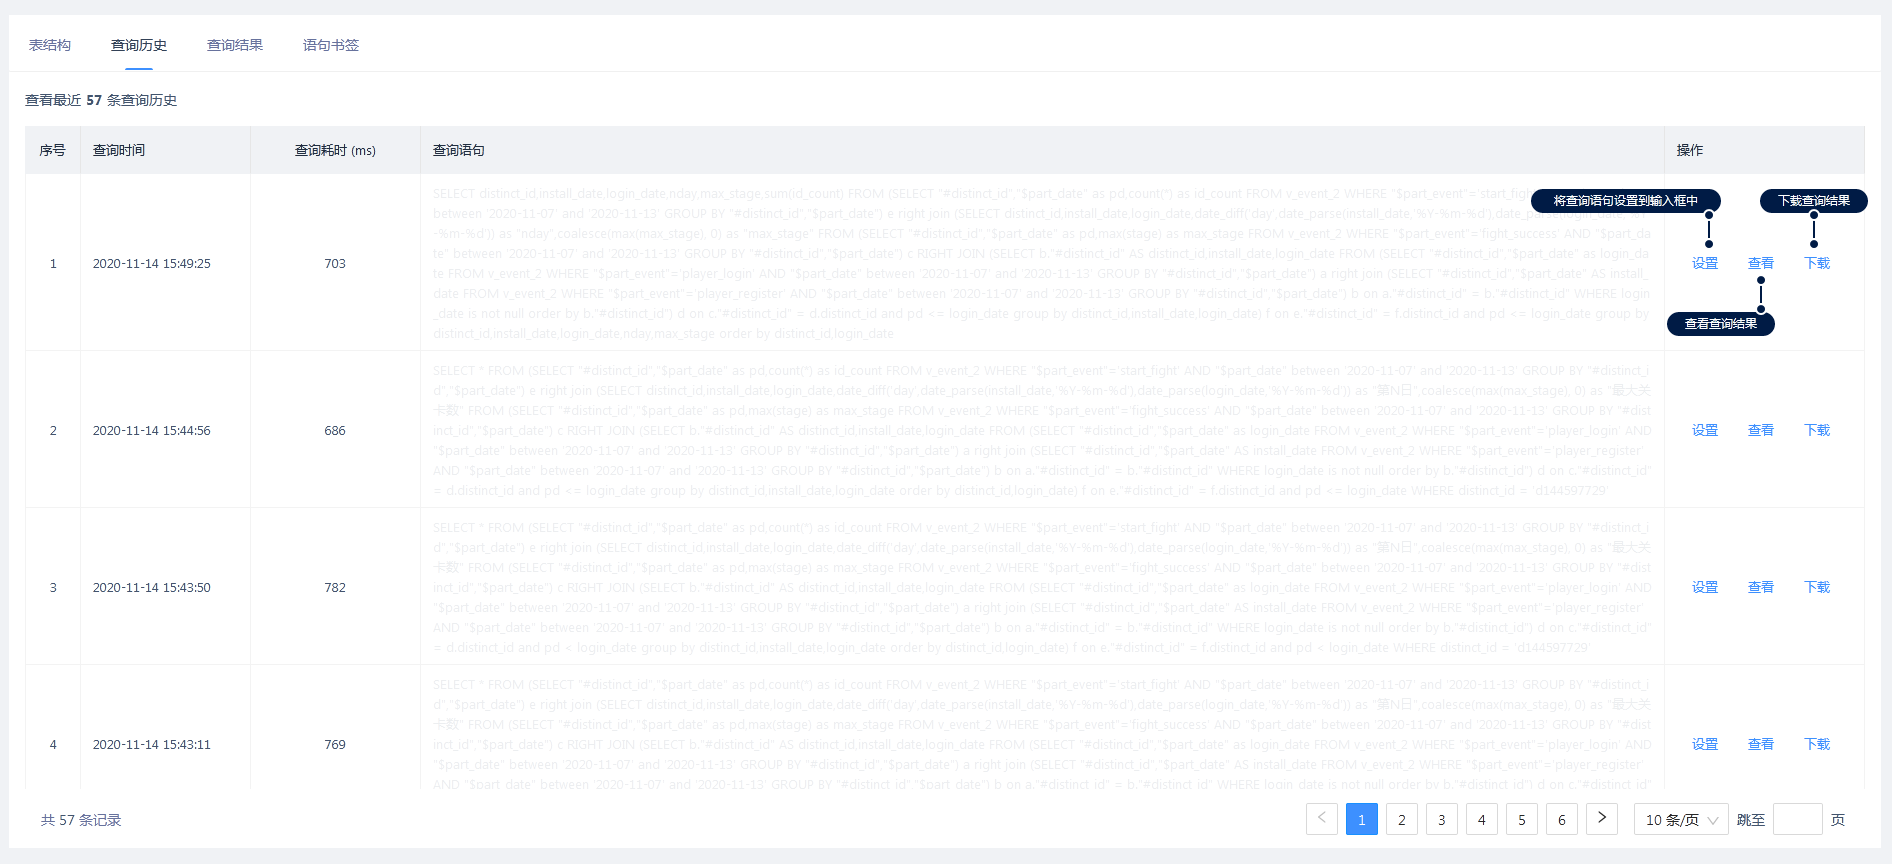
The query history tab mainly presents the query statements you have made, which presents information such as the completion time of the statement, calculation time consumption, query statements, etc.
- Click 'Settings' and the query statement will replace the content in the statement input box
- Click 'Query' to jump to the query result and view the result data of the query
- Click 'Download' to download the
.csvformat file of this query result
Under the 'Query History' tab, you can only view your own SQL query history for all projects, and cannot view the history of others. At the same time, only about 100 query histories per user for nearly 30 days will be recorded, and those that exceed the range will be cleared periodically.
# 3.2.3 Query Results
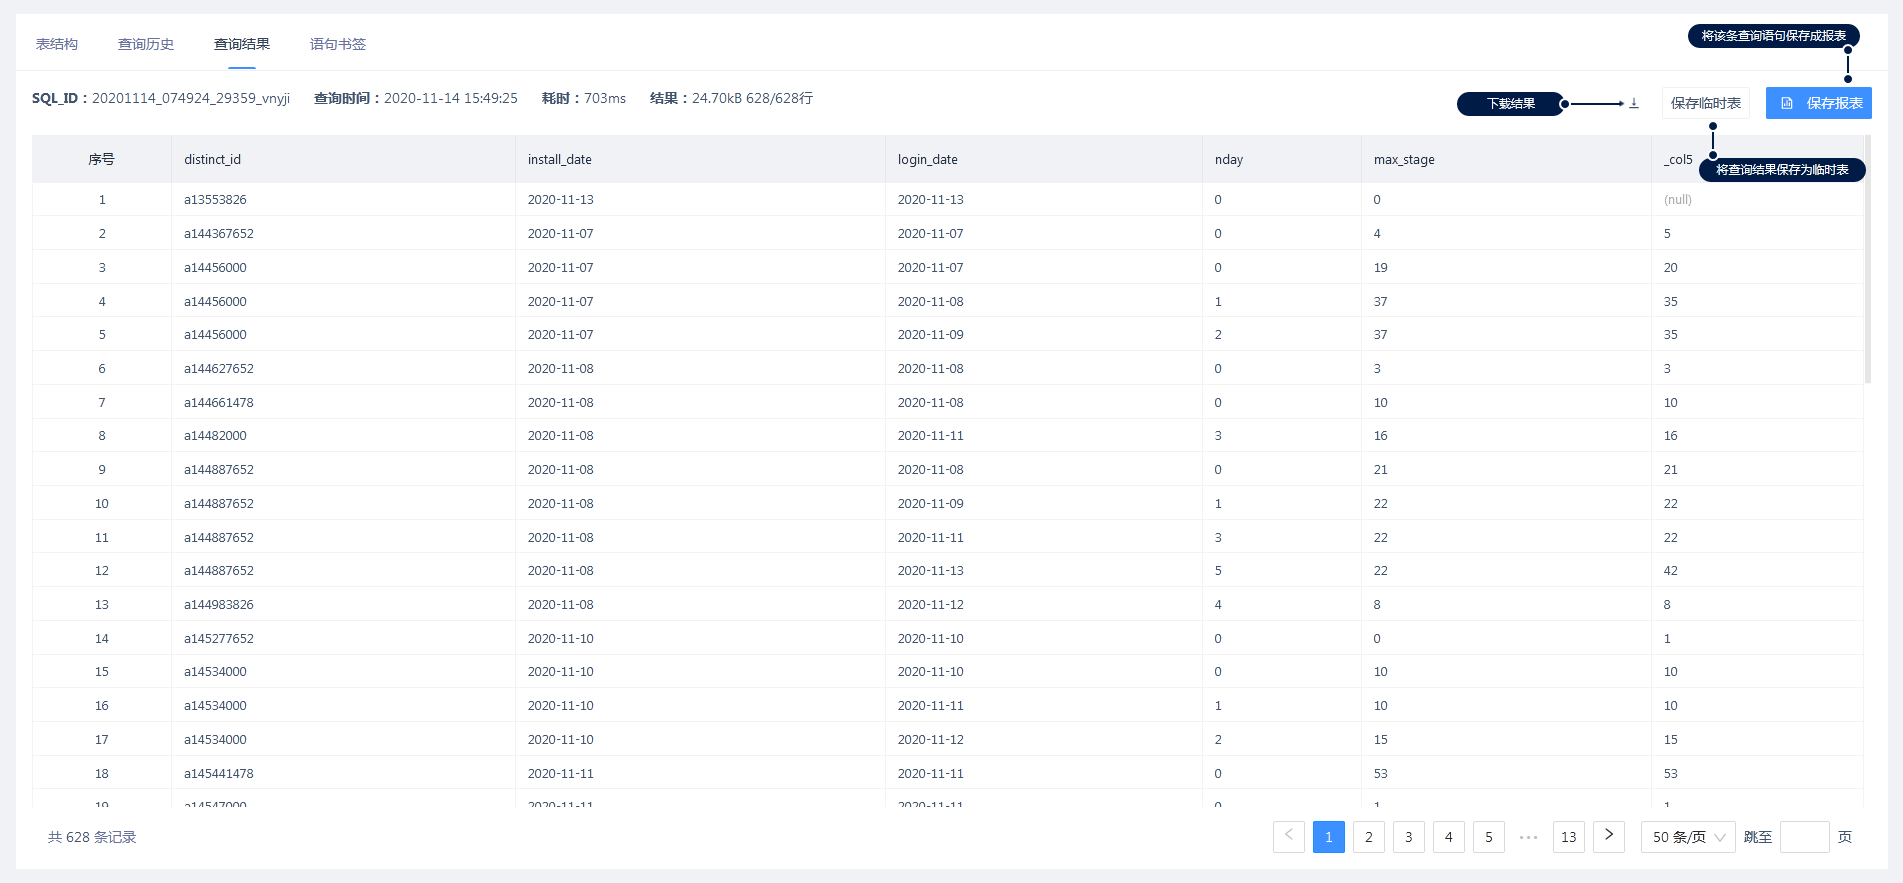
The query results tab will display the results of the previous query, or select the viewed historical query results on the query history page. On this page, you can download the result data or save the result as a temporary table for subsequent use; in addition, we have enabled the ability to save SQL as a report, and SQL queries saved as a report can be placed in dashboard.
- Click 'Download Data' to download the
.csvformat file of this query result. - Click 'Save Temporary Table' to store the results of this query as a temporary table. The temporary table belongs to the current item, that is, the item displayed in the upper left corner of the page (please note that the temporary table does not support Chinese column names).
- Click 'Save Report' to save the query statement as a report. The report belongs to the current project, i.e. the item shown in the upper left corner of the page. Refer to Section 4.3 for details.
WARNING
It should be noted that the query result page only displays the first 1000 records at most, and more than 1,000 records can be downloaded locally and queried. The download function can support up to 1 million downloads of data.
# 3.2.4 Statement Bookmarks

The 'Statement Bookmarks' tab displays all stored statement bookmarks. The contents of the stored bookmarks cannot be modified. If you need to update the bookmarks, it is recommended to create new bookmarks and delete historical bookmarks:
- Click 'Settings' and the content in the bookmark will replace the content in the statement input box.
- Click 'Rename' to change the name of the bookmark.
- Click 'Delete' and the bookmark will be permanently deleted.
# IV. Usage of SQL Query
# 4.1 Query Data
Write SQL statements in the statement input box, click the 'Calculate' button on the right side of the toolbar, or shortcut Ctrl + Enter(the cursor needs to be in the input box) to query the data.
The query at this time is an actual query and will not read the cache. The query is the current real-time data.

After clicking on the query, a query progress bar will appear. If you want to cancel this query, you can click 'Cancel Calculation'. The cancelled calculation can be re-executed in the 'Query History'.
# 4.2 Dynamic Parameters
Dynamic parameters provide the ability to adjust part of the content of the statement. Users can set the part that needs to be modified for each query as dynamic parameters. When inquiring, only adjust parameters, dynamic adjustment can be achieved without modifying statements.
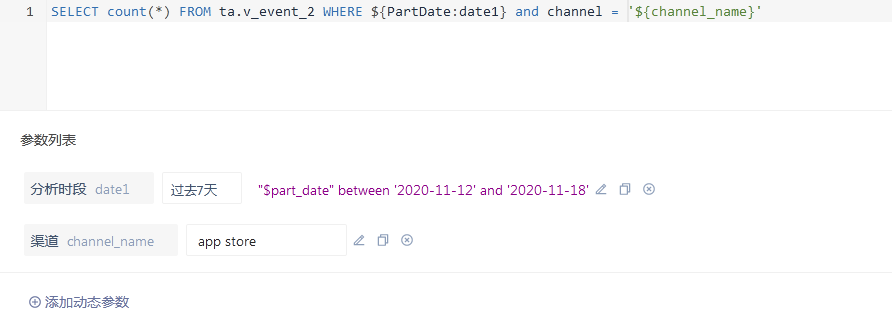
In the above figure, the query time and the channel for querying data are set to dynamic parameters. During each calculation, only the values of the parameters need to be modified in the parameter list, and the contents of the corresponding part of the parameters will be modified in the same way during execution. It is equivalent to the query condition receiving control of these parameters.
The expression rule for dynamic parameters is ${parameter type: parameter name}. You can enter the expression directly in the statement input box or click 'Add dynamic parameters' in the toolbar to add it..
The parameter with the same name in the statement is regarded as a parameter. During use, multiple parameter variables can be created, as shown in the figure:

If the parameter 'query time' in the above figure is used many times in the statement, the modification of the parameter will affect all the places used. When multiple tables are checked together, the same parameter can be used many times to unify the filtering conditions of each table.
Dynamic parameters can be saved in the report. The report will record the information of dynamic parameters, including parameter comments and aliases. In the exploration module of dashboard, viewers will see these parameters and can make dynamic adjustments.
If a dynamic parameter is used in the statement, the parameter value at the time of the query will be recorded as the default value of the parameter when saving the report, and the dynamic parameter will take the default value when viewing from the dashboard. If the type of dynamic parameter is event time, and dynamic time is selected during the query, the time at each view on the dashboard will also change dynamically.
# 4.3 Save Report
Saving the report needs to be done on the 'query results' page, which is equivalent to requiring the saved report to be an executable statement.
Compared with other models to save reports, SQL queries can be set up more when saving, as shown in the following figure:
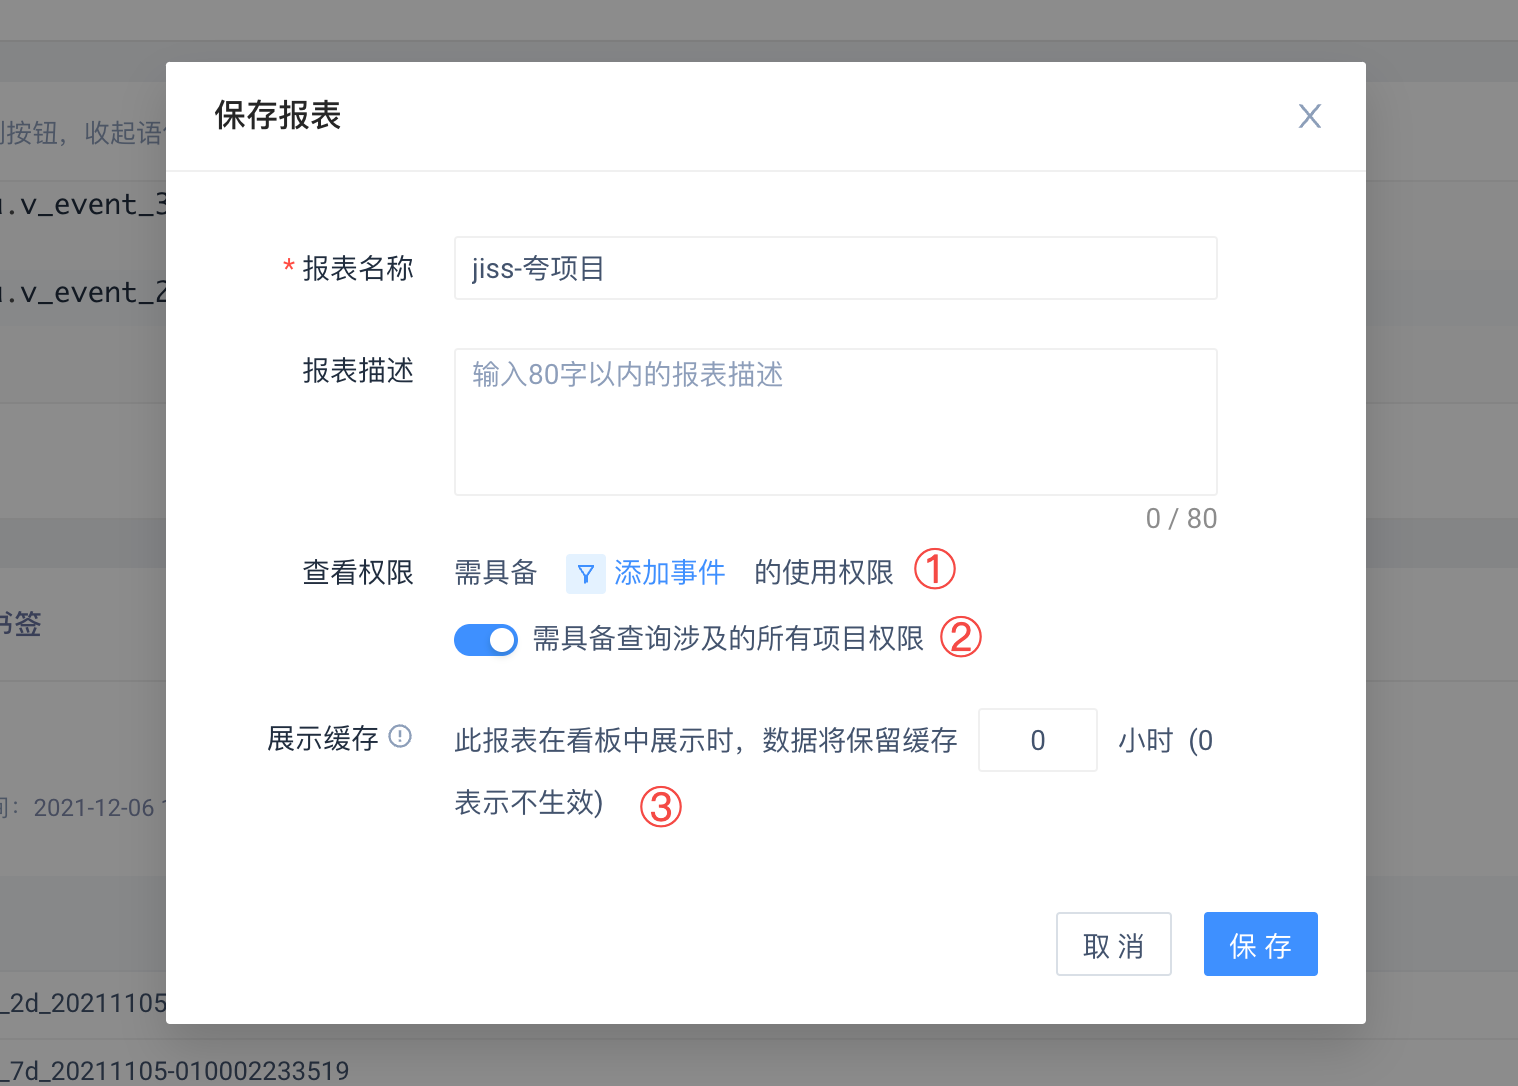
The main difference is that viewing rights and setting of dashboard cache have been added.
View Permissions
View permissions can control which users have permissions to view the report in dashboard. Users must meet all viewing permissions to view the report in dashboard:
- Event permissions: SQL reports are controlled by the default data permissions of members in the project. If a member does not have viewing permissions for Event A, the member cannot view SQL reports created based on Event A. When saving the SQL report, it is supported to set additional permission control, i.e. requiring the shared party to have access to the selected event (i.e. member's event permission), such as setting additional permission to request the 'paid' event when inquiring the amount paid by the user.
- Cross-project permissions: Only if other items (relative to the current item) appear in the query statement, the default is open, i.e. members of the project view the report and must be members of all the items involved in the report to view it.
Dashboard** Cache**
- Dashboard cache is the length of time that the displayed cache will be maintained when the SQL report is stored in dashboard. You can reduce the query frequency of slow SQL and non-real-time reports by setting dashboard cache, saving cluster computing resources.
- If the dashboard cache is set (greater than 0 is the setting), but the query duration is less than 300 seconds, the report can still be manually refreshed, and the cache time limit for new data will be recalculated after refresh.
- Dashboard regular refresh is effective for all SQL reports. Regardless of the query duration of the report and whether the report is cached or not, it will be refreshed synchronously when dashboard is refreshed regularly; For SQL reports with non-real-time data, you can set the report buffer to 24 hours and open the dashboard to refresh regularly to update the data only once a day.
- If the query when saving the report exceeds 300 seconds, the dashboard cache must be set up, and manual refresh cannot be carried out (dashboard regular refresh is still in effect), and the exploration module of the report cannot be entered. It is recommended to optimize the query statement and narrow the query range to speed up the query to avoid receiving restrictions.
Similar to reports of other models, the created SQL query report can be viewed in the 'saved report' interface, and the SQL query report can be put into dashboard and shared with other users.
# 4.4 Temporary Table
WARNING
Temporary tables created before 3.0 cannot be used in reports because they are only effective for individuals. We strongly recommend converting to a new version of the project temporary table, and click the 'Convert' button after the personal temporary table to complete the conversion.
In the query result page, the result data storage can be created as a temporary table. The stored temporary table will be associated with the current item, ie. the item identified in the upper left corner of the page. The created temporary table can be used by other users who have SQL query permissions.
If a temporary table needs to be deleted, the temporary table can be selected in the 'Data Table Overview' and deleted by clicking the 'Delete Temporary Table' button.
# V. Presto SQL Special Usage and Advanced Functions
This chapter will introduce the special usage of Presto SQL, as well as the usage of some more advanced functions. If you want to know more about Presto SQL, you can visit Presto's official website doc (opens new window)
# 5.1 Try Function, and Try_cast Function
try(expression)
The tryfunction returns the exception value to NULL for the exception expressed in it, and if the tryfunction is not used, the statement will be directly misreported causing the query to fail if an exception occurs.
You can also use the coalescefunction to replace NULL values with specific values, such as the following, converting field ato an integer, and converting to 0 if conversion fails.
coalesce(try(cast("a" as integer)), 0)
The above type conversion can be implemented using the try_cast function. The role of try_castis consistent with the castfunction. It is to type the value. The difference is that try_castwill return NULL when the type conversion error occurs to avoid query failure.
coalesce(try_cast("a" as integer), 0)
# 5.2 Time/Date Function
Use current_date, current_time, current_timestamp, localtimeand localtimestampwithout parentheses, Presto does not support parentheses, please note when using.
# 5.2.1 Conversion of String and Time
You can directly add the keyword timestampto the time expression in string format, such as timestamp '2020-01-01 00:00:00', to directly obtain the corresponding time.
date_parseAnd date_formatThe usage is to pass in the fields that need to be converted and the corresponding format, as follows are string $part_dateTurn time and time #event_timeTurn string:
date_parse("$part_date", '%Y-%m-%d')
date_format("#event_time", '%Y-%m-%d %T')
The format of the above functions is MySQL format. If you need to use Java format, you can use the function format_datetimeand parse_datetime.
# 5.2.2 Time Calculation Function
Function date_addto offset time, unitis unit, valueis the amount of the offset, if the valueis negative, it is offset forward.
date_add(unit, value, timestamp)
Function date_diffto calculate the difference between two times. The algorithm is timestamp2-timestamp1, which returns an integer in unit.
date_diff(unit, timestamp1, timestamp2)
For the range of unitsof the two functions, please refer to the following table:
| Unit | Description |
|---|---|
| millisecond | Milliseconds |
| second | Seconds |
| minute | Minutes |
| hour | Hours |
| day | Day |
| week | Week |
| month | Month |
| quarter | Quarter |
| year | Year |
# 5.3 Window Function
Presto supports window functions. There are many useful functions in window functions, such as first_value and last_value are very suitable for calculating the value of the first or last time something was done in a period of time.
For example, calculate the items purchased by each user when the first purchase behavior occurs:
SELECT user_id,first_purchase_product FROM
(SELECT user_id,first_value(product_name) over(partition by user_id order by time) AS first_purchase_product FROM log.purchase)
GROUP BY user_id,first_purchase_product
first_valueAnd last_valueneed to be used with the overclause. The overclause partition byis similar to group by, that is, grouping according to the given fields, and order bywill determine the sorted fields.
# 5.4 JSON Parse
In some special scenarios, we recommend using strings to record complex data structures and upload them to the background. In the future, JSON parsing function can be used to transform or extract data that can be used in SQL.
# 5.4.1 String to JSON
json_parseYou can convert a string that conforms to the JSON format into JSON type data in SQL. The two functions are equivalent:
json_parse(JSON '{"abc":[1, 2, 3]}')
# 5.4.2 JSON to Other Types
The data converted to JSON can be converted to other SQL types of data through CAST, such as converting the string just converted to JSON to MAP again:
CAST(json_parse('{"abc":[1, 2, 3]}') AS MAP(varchar,array(integer)))
If you want to convert a string back to JSON, you can use json_format:
json_format(json_parse('{"abc":[1, 2, 3]}'))
# 5.4.3 Direct Extraction of JSON Data
In many cases, you only need to extract part of the data in JSON. At this time, you can use the json_extract_scalarto extract it. It is extracted through the JSONPath expression and returns string:
json_extract_scalar(json, json_path)
And json_extract_scalarcan directly extract the JSON string without manually converting it to the JSON type, such as the following, extracting the first element of abc:
json_extract_scalar('{"abc":[1, 2, 3]}','$.abc[0]')
# VI. Best Applications
# 6.1 Supplement Other Models
Due to the limitations of the model, some analysis scenarios cannot fully meet the requirements in implementation, such as presentation requirements or sorting requirements. At this time, SQL queries can be used for complete customization.
For example, recently paid ranking, since the model does not support custom sorting, you can use SQL queries to achieve sorting:
SELECT
  "#account_id"
, sum("recharge_value") "Total_Payment"
FROM
  ta.v_event_2
WHERE ("$part_event" = 'recharge' AND ${PartDate:date1} )
GROUP BY "#account_id"
ORDER BY sum("recharge_value") ASC
# 6.2 Cross-project Data Aggregation
Because other models are strictly controlled by the project, data search or data aggregation across projects can only be realized through SQL queries.
A common scenario is that data from different applications, businesses, and regions are stored in different projects. When you want to summarize these data for viewing, using SQL queries can be very convenient to achieve such requirements.
The following is a case of joint query of project ID 1 and project ID 2 data. In the summary project, the following statements are stored as reports and put into dashboard for analysis to realize cross-project data summary:
SELECT a."$part_date","Product_A_DAU","Product_B_DAU" FROM
(SELECT "$part_date",count(*) AS "Product_A_DAU" FROM ta.v_event_1 WHERE ${PartDate:date1} GROUP BY "$part_date") a
JOIN
(SELECT "$part_date",count(*) AS "Product_B_DAU" FROM ta.v_event_2 WHERE ${PartDate:date1} GROUP BY "$part_date") b
ON a."$part_date" = b."$part_date" ORDER BY a."$part_date" ASC
In the case, the dynamic parameter ${PartDate: date1}is used in two places, which is equivalent to controlling the query time of the two tables at the same time to keep the calculation cycle uniform. This is a common method for cross-project queries.
# 6.3 Utilization of Complex Data Structures
In some cases, some complex data structures, such as Map, JSON, etc., need to be used in subsequent analysis. At this time, we will recommend recording these complex data structures by string, and then using SQL queries.
The following example is for the complex structure attribute hero_ Json's parsing, extracting hero_id and hero_ Level for subsequent analysis:
SELECT
  json_extract_scalar(hero_json, '$.hero_id') hero_id
, json_extract_scalar(hero_json, '$.hero_level') hero_level
FROM
  ta.v_event_2
WHERE ("$part_event" = 'fight_success' AND ${PartDate:date} )
