# Flow Analysis
# I. The Significance of Flow Analysis
Flow analysis is an exploratory model for analyzing behavior sequence, behavior preference, key nodes and transformation efficiency.
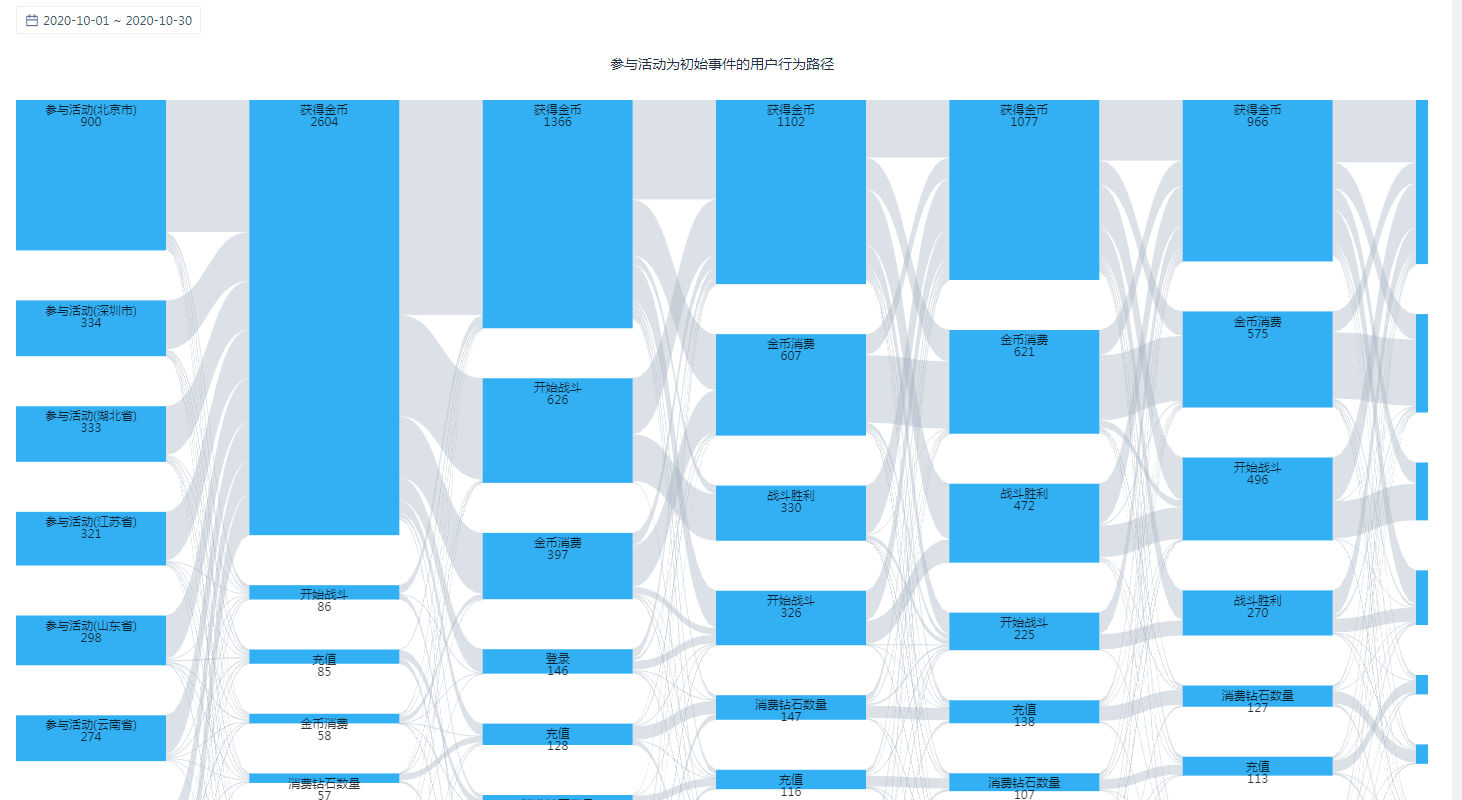
Flow analysis records the access sequence of users in each session and then integrates it into a sankey diagram of the user's behavior Flow to intuitively view the behavior inflow and outflow before and after each critical node.
User behavior extension route can be intuitively mastered to optimize node content and improve overall conversion efficiency. Flow analysis model can be used to quickly understand the primary and secondary factors affecting the conversion, so as to purposefully improve the product.
# II. Location and Applicable Role of Flow Analysis
It can be accessed from the 'Flow Analysis' page under the 'Behavior Analysis' module
| Company Supervisor | Administrator | Analyst | Ordinary members | |
|---|---|---|---|---|
| Flow analysis model | ● | ● | ▲ | △ |
Permission description:
● Role must have
▲ The role has the permission by default, but can revoke
△ The role is not available by default, but can be authorized
○ Role must not have
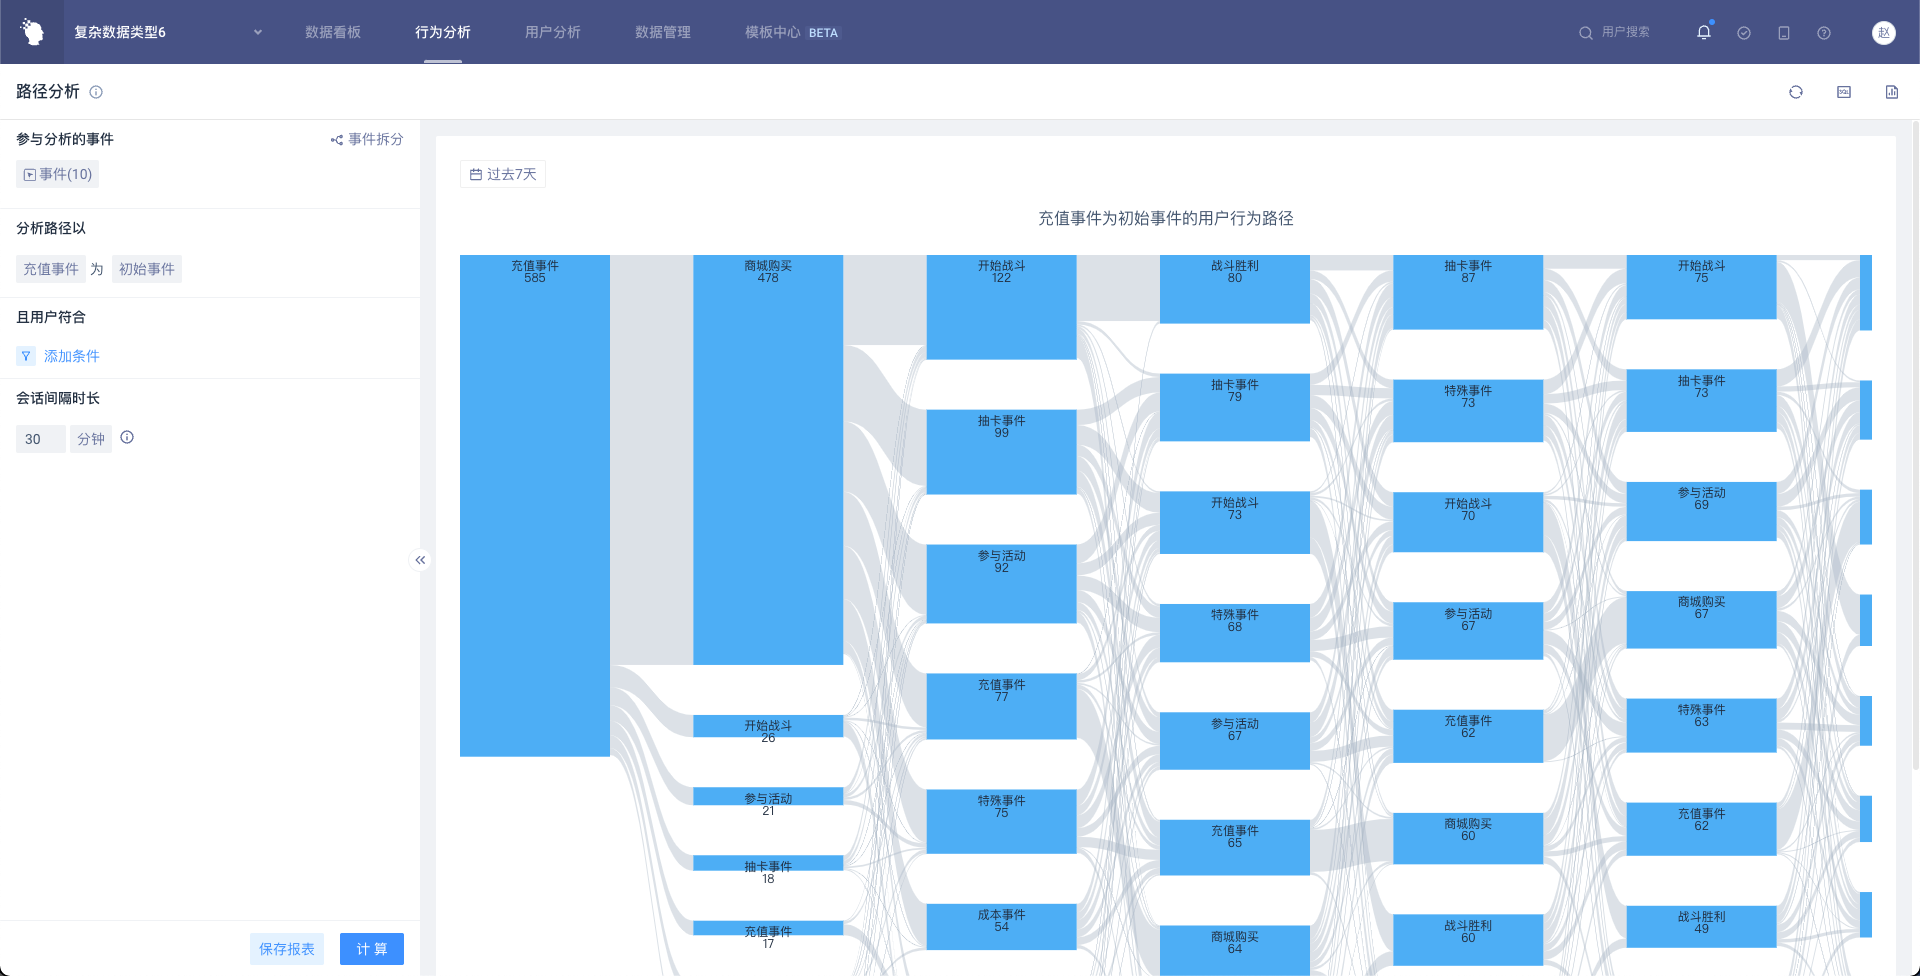
# III. Overview of Flow Analysis Page
It consists of four parts: analysis direction setting area, display filter area, display chart area and node detail information.
# IV. Usage of Flow Analysis
# 4.1 Several Commonly Used Analysis Scenarios
# 4.2 Definition of Nouns and Logical Conditions
**Analysis event group: **the range of events participating in Flow analysis, default 10 items, up to 30 items can be selected. Unselected events are invalid events and do not participate in the calculation and display of Flow analysis.
**Analysis object: **Select 1 item in the analysis event group as the analysis basis, and you can specify it as the starting or ending event for analysis. The first item is selected to start by default.
**Session Interval: **The triggering interval between two consecutive valid events (belonging to the analysis event group) within the set time is considered to be the same session.
Flow**: **A Flow that extends backward or forward (determined by the beginning or end of the analysis) based on the object of analysis. Flows will ensure **mutual independence **and **complete exhaustion **.
- The next Flow should be a subset of the previous Flow and have the same number. There is a loss concept and a start concept, i.e. there is no next or first step.
- When the analysis object is the starting event A, when A occurs repeatedly in the Flow, only the first A is used as the **starting point **, and a session will not be calculated into multiple Flows repeatedly.
- When the analysis object is the end event A, when A appears repeatedly in the Flow, only the last A is used as the **ending point **, and a session will not be calculated into multiple Flows repeatedly.
- Judge from the order in the conversation as the first step, the second step, the third step, or the first to the last, the second to the last, the third to the last, etc.
**Number of displays: **When a node on the Flow is in the following situation, 'More' module will be incorporated into the chart
**Note: **When the number of nodes ranks above 7th in the peer group, the nodes will merge into 'More' module.
# 4.3 Conditions of Analysis Direction Setting Area
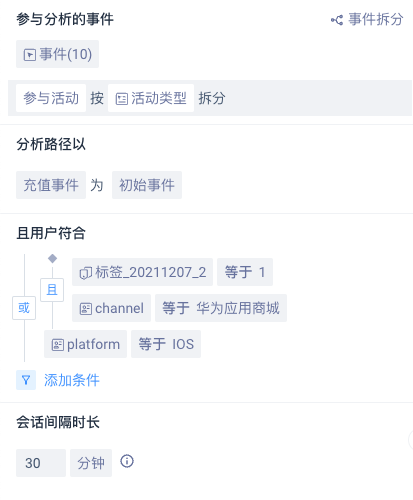
# 4.3.1 Incidents Involved in Analysis
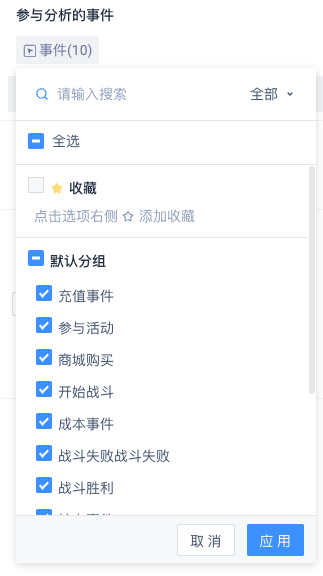
- Apply event group settings, you can batch select all events under a group, and click 'Apply' to take effect.
- The first 10 items are selected by default, and up to 30 items can be selected to support search function.
# 4.3.2 Set Group Splitting Conditions for Events
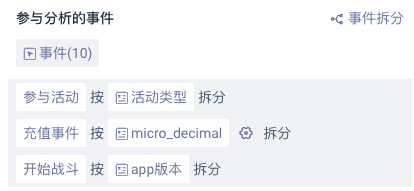
You can add event splitting options to the selected 'Events Participating in Analysis' group. At this time:
- You can split any event in the group according to an event attribute of the event.
- Each event can only be split by one attribute, that is, the selected event can no longer be selected.
- Each event in the group can be split.
- Numerical , temporal , or tabular attributes can set intervals that share configurations with interval groups of other models.
# 4.3.3 Select Analysis Events
Select analysis and set filter criteria

- Analysis can be done in a way that chooses staring or ending events.
- Filtering criteria for event attributes that can add events, up to 10 items.
- The analyzable direction of the filter criteria is related to the data type.
| Filter item data types | Example | Support attribute logic |
|---|---|---|
| Value | Consumption amount | Equal to, not equal to, less than, less than or equal to, greater than, greater than or equal to, with value, without value, interval |
| Text | Province | Equal to, not equal to, include, not include, have value, have no value, regular match |
| List | ID list | Existing element, non-existing element, element location, value, no value |
| Time | Registration time, last active date (yyyy-MM-dd HH: mm: ss. (SSS or yyyy-MM-dd HH: mm: ss) | In interval, less than or equal to, greater than or equal to, relative to current date, with value, without value |
| Boolean | Wifi use | True, false, valuable, worthless |
| Object | Player resource snapshot | Value, no value |
| Object group | Expedition lineup | Existing object satisfies, no object satisfies, all objects satisfy, has value, has no value |
# 4.3.4 'And the user conforms' Filter
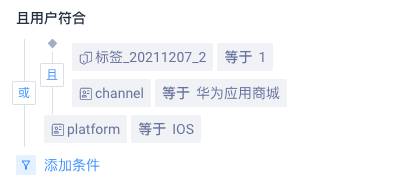
User attributes, user groups, or user tags can be filtered to support different attribute logic based on data type.
| Filter item data types | Example | Support attribute logic |
|---|---|---|
| Value | Consumption amount | Equal to, not equal to, less than, less than or equal to, greater than, greater than or equal to, with value, without value, interval |
| Text | Province | Equal to, not equal to, include, not include, have value, have no value, regular match |
| List | ID list | Existing element, non-existing element, element location, value, no value |
| Time | Registration time, last active date (yyyy-MM-dd HH: mm: ss. (SSS or yyyy-MM-dd HH: mm: ss) | In interval, less than or equal to, greater than or equal to, relative to current date, with value, without value |
| Boolean | Wifi use | True, false, valuable, worthless |
| Object | Player resource snapshot | Value, no value |
| Object group | Expedition lineup | Existing object satisfies, no object satisfies, all objects satisfy, has value, has no value |
If the user is grouped, you can select 'Belonging to Groups' or 'Not Belonging to Groups'.
# 4.3.5 Session Interval Settings

**Session interval means: **when selected, the maximum interval between adjacent events.
Modify this value to adjust whether adjacent events are in the same session or not.
The default setting is '30 minutes', and the units can be selected as 'seconds' (1~ 60), 'minutes' (1~ 60), 'hours' (1~ 24).
# 4.4 Display Filter Area Settings
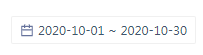
**Analysis period: **The past 7 days are selected by default (up to 31 days can be selected)
If the number of days in the selected time period is greater than 31 days, select the starting date~ (starting date + 30 days) for analysis.
# 4.5 Display the Settings of the Chart Area
# 4.5.1 Loss and Start of Node
- When analyzing the starting event, if there is no lower node in a step, the node will lose.
- When analyzing the ending event, if there is no lower node in a step, the node will start.
# 4.5.2 'More' Components
When the node is 'more', it is equivalent to the set of general nodes, selected connections are a collection of connections for all nodes, value and flow rate are also the set of all nodes.
4.5.3 Horizontal Scroll Bar and Left- right Drag
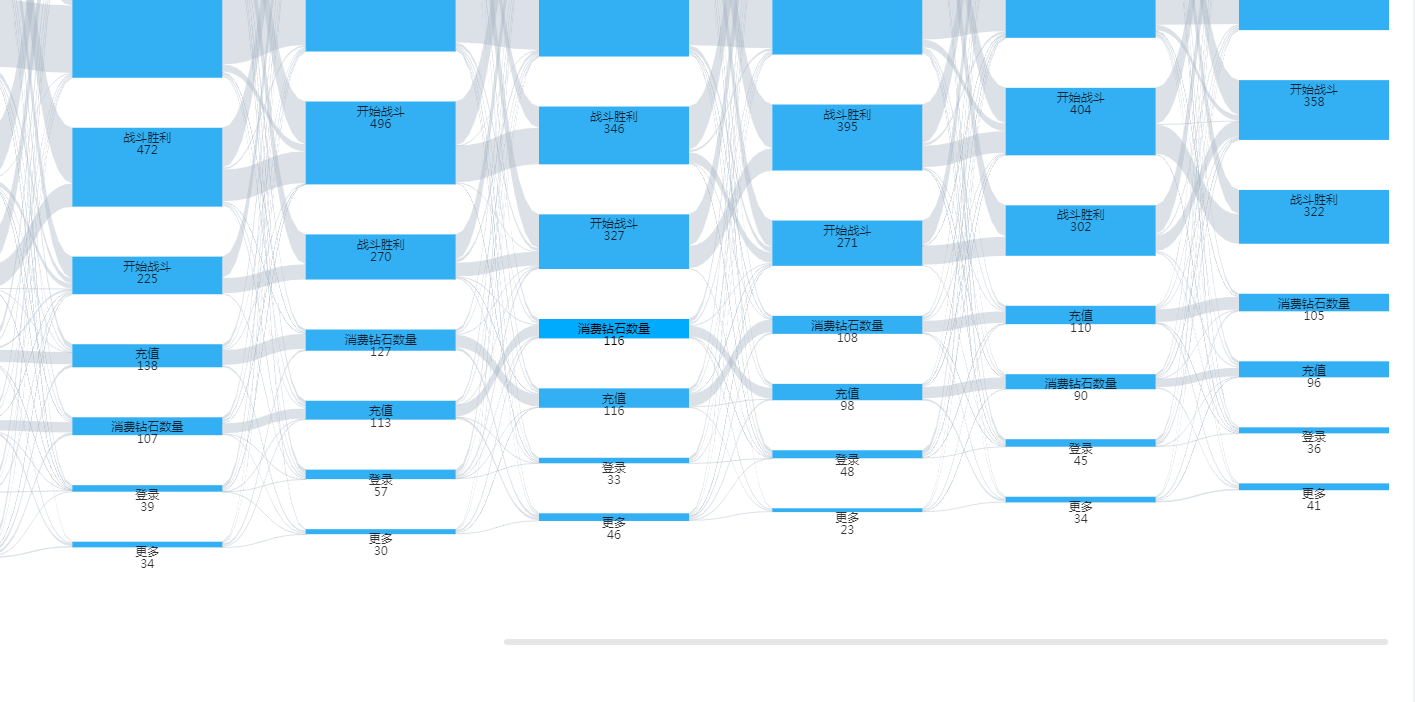
Up to 10 levels can be displayed, and the starting event or the ending event is displayed by default (depending on the choice).
More information can be displayed on the screen by dragging the horizontal scroll bar. ( Click the middle mouse button to enter the window drag-and-drop mode, which makes it easier to traverse the chart).
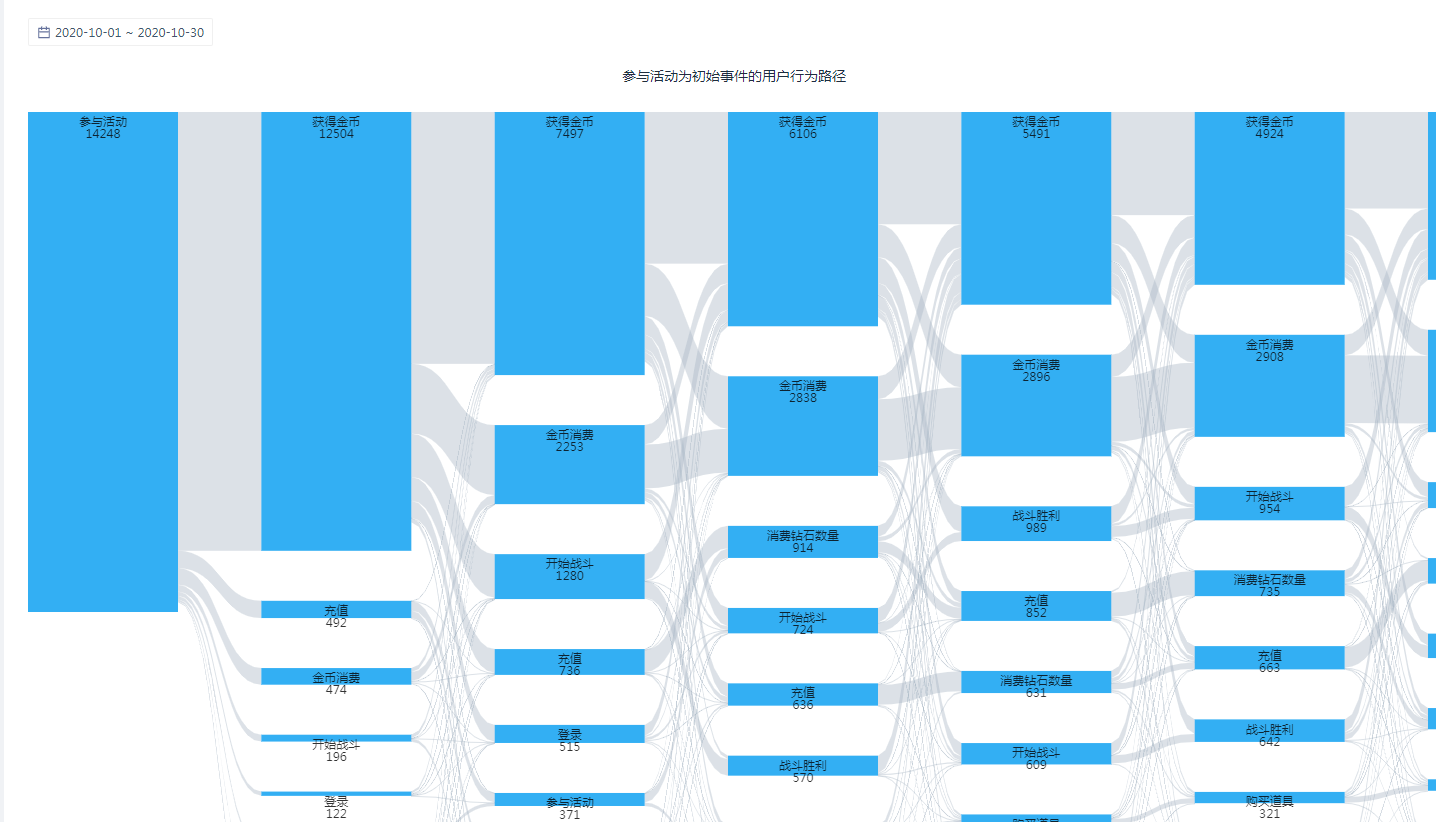
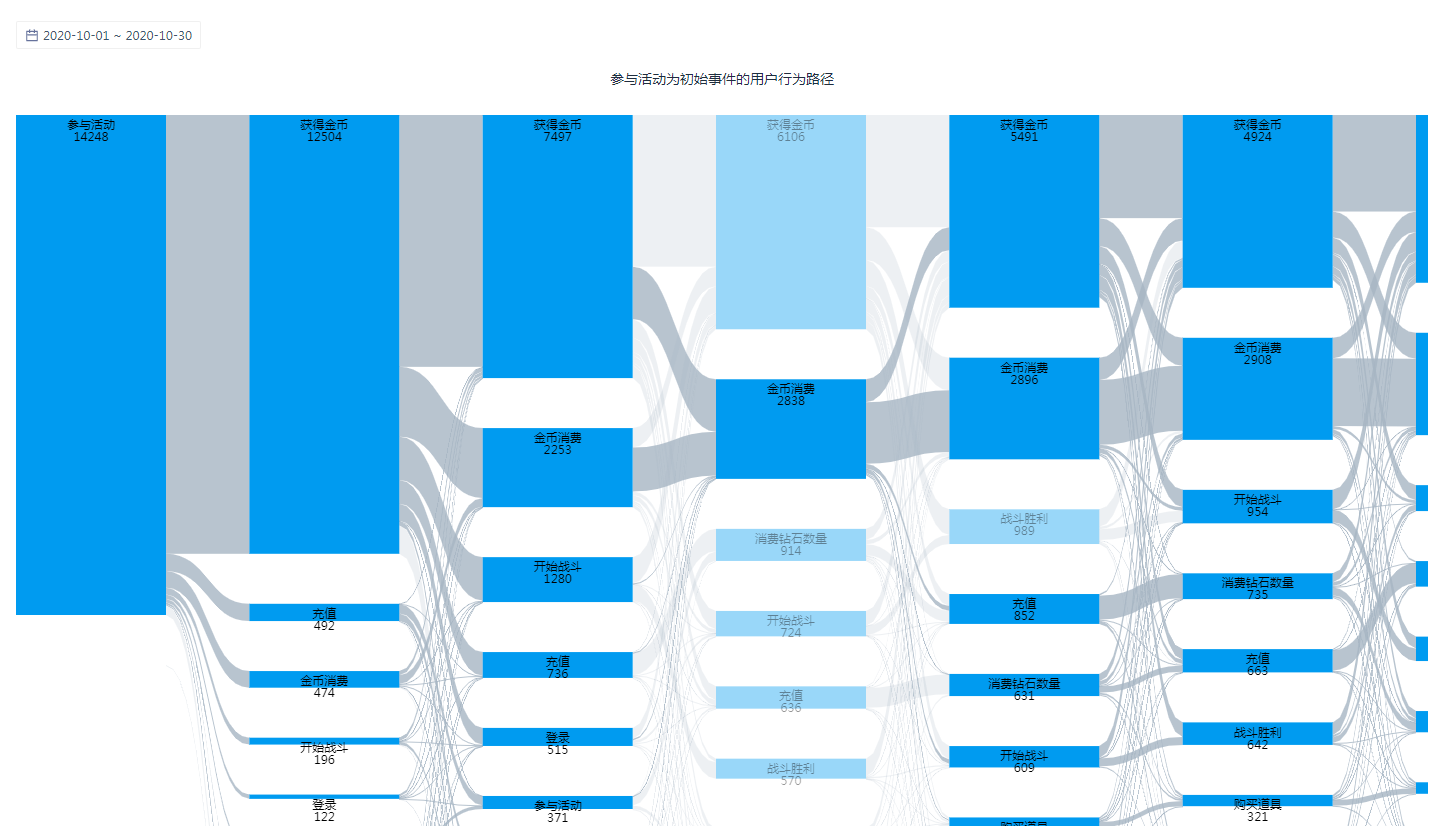
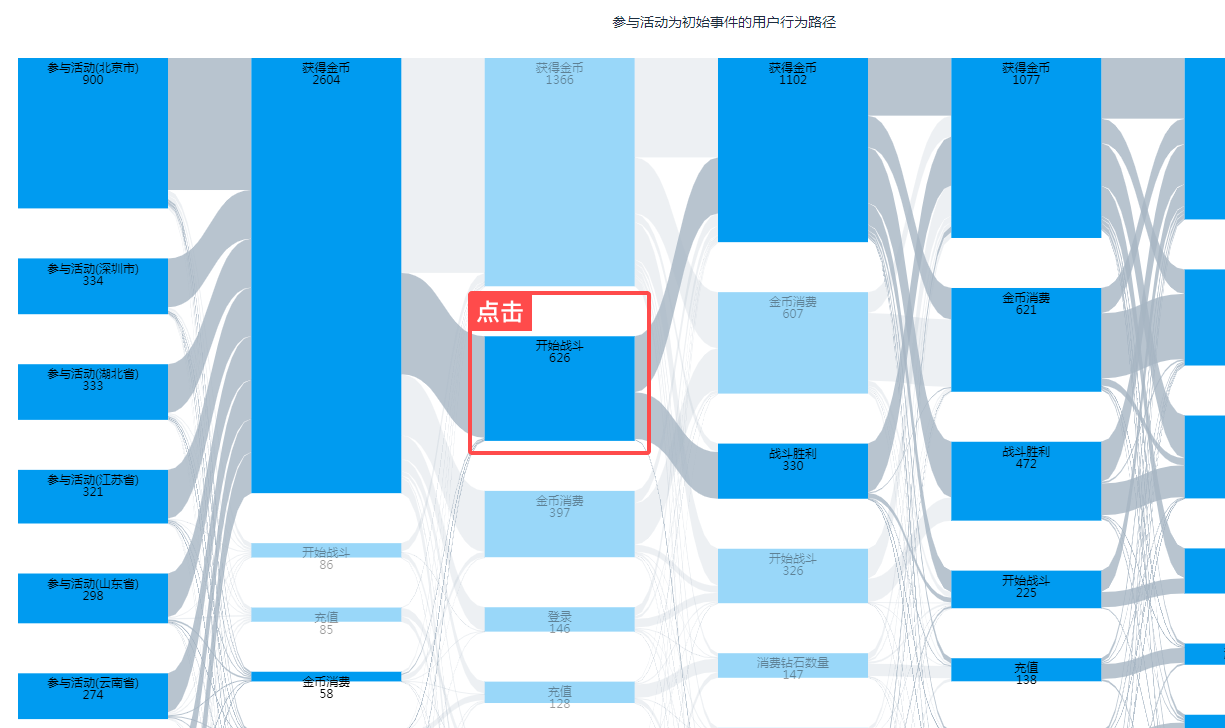
# 4.5.4 Node Flow
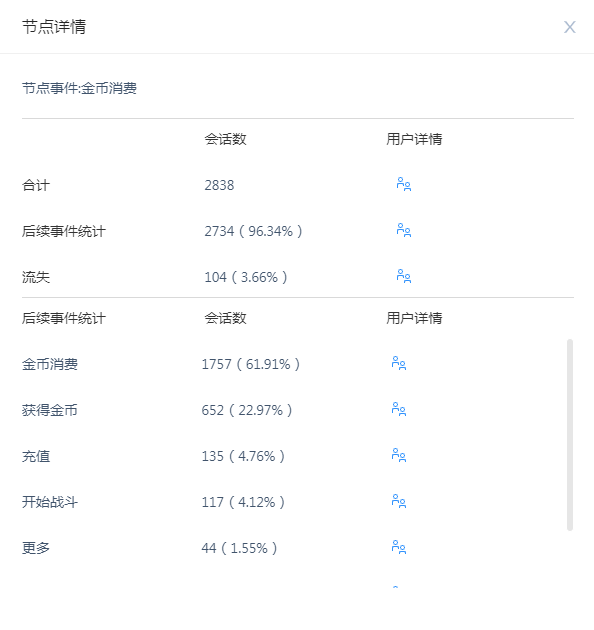
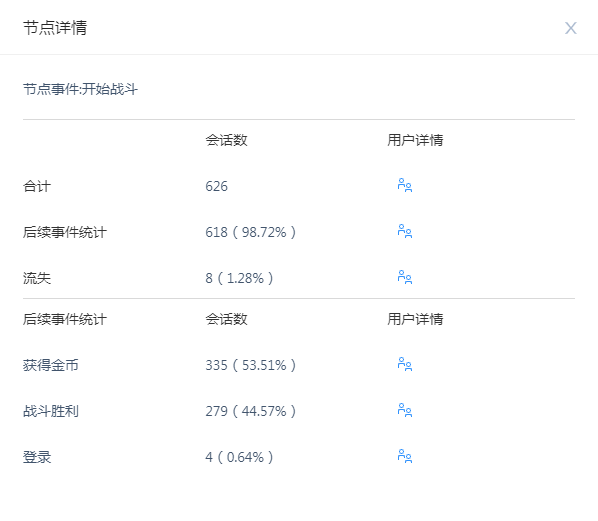
When clicking on a node, you can highlight the relevant Flow or display the node information details of the node.
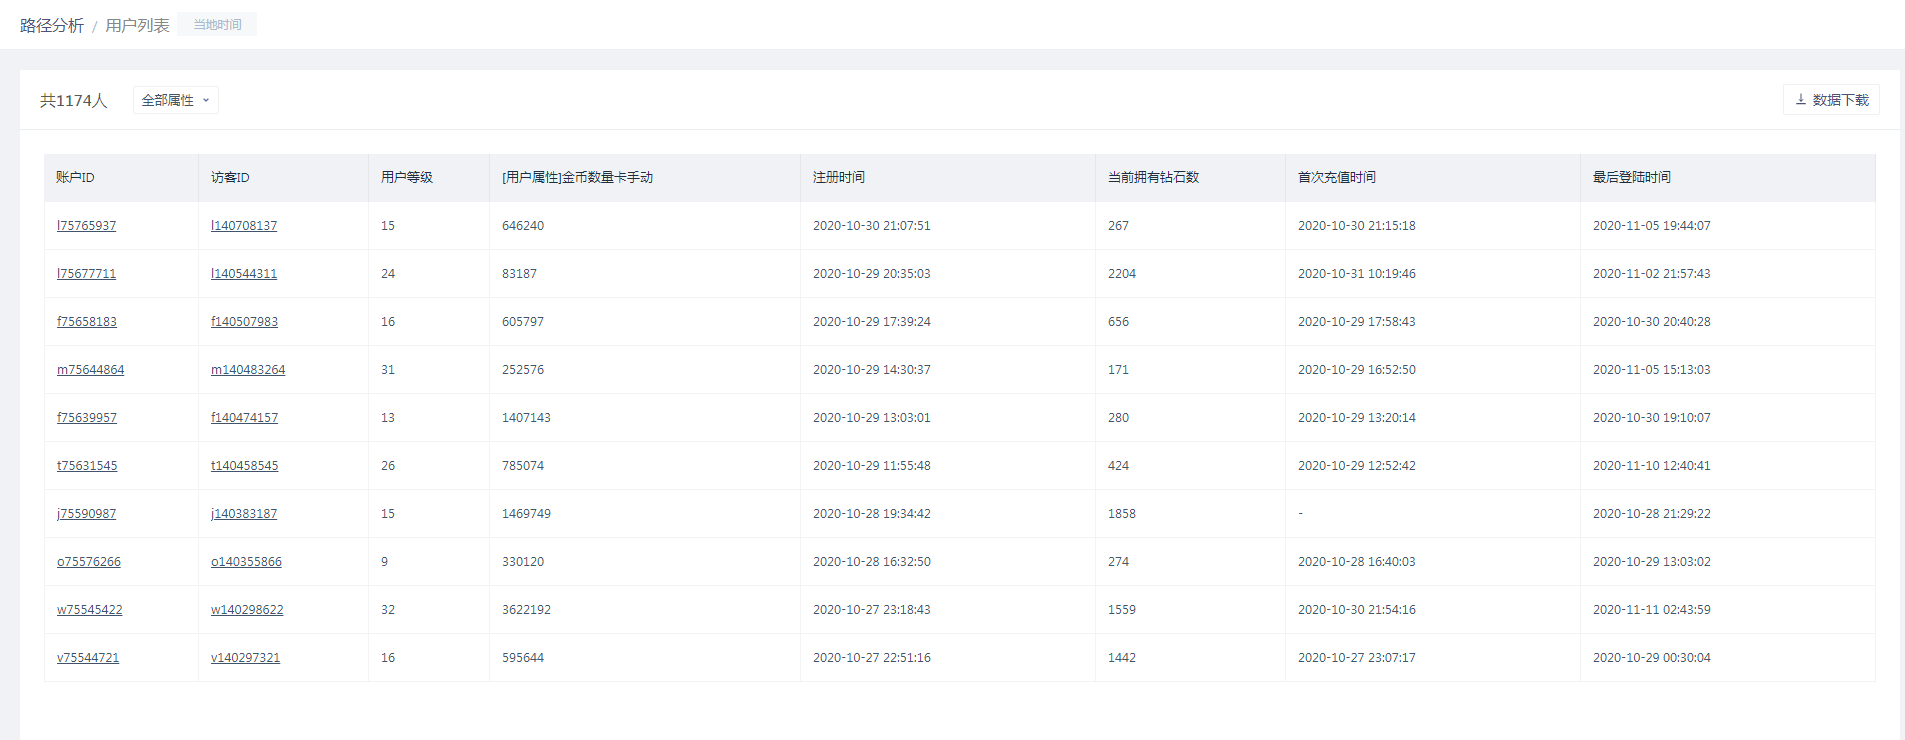
When viewing node details, click on the number of users information, and a list of eligible users will be displayed and allows you to query related user behavior sequences.
# 4.6 Analysis Range, Data Selection Principles
In addition to filter conditions, there is still an analysis range to control the overall calculation and display size, forming a controllable analysis.
(1) Time Selection Range
The past 7 days are selected by default (up to 31 days can be selected).
(2) Calculate the Range of Event Groups
By default, the first 10 events on the current settings page are displayed. You can check and select all events. You can select up to 30 events.
The analysis object must be in the calculation event group.
(3) Display the Range of Session Steps
The steps for presentation and analysis are set at 10 steps, i.e. in a session, events beyond the range are discarded and processed without data, counting from the start (end) event.
**(4) **'More'
Nodes that exceed the number of displays will be merged. The merged node 'more' will inherit the data of each node. When clicking 'More' node details, you can still see the overall statistics and flow Flow information.
# 4.7 Data Computational Logic
In a session, the events that start at ** start point (end point) ** are recorded as the first step (i.e. analysis object), each event backward (forward) is recorded as the next step, and each node on the behavior Flow is analogized.
Taking the analysis of an event A as the initial event as an example, the behavior sequence is A, B, C, and loss (there is no new event in the session), then A is the first step, B is the second step, C is the third step, and loss is The fourth step.
Take the analysis of an event L as the end event as an example, the behavior sequence is the beginning (there is no new event before the session), B, C, L, then L is the first step, C is the second step, B is the third step, The beginning is the fourth step.
The starting point (ending point) rule refers to the noun definition. And the loss or the start is the last step in the analysis sequence.
- Examples of steps
| Order | Analysis object | Behavioral sequence | First step | Step 2 | Step 3 | Step 4 | Step 5 |
|---|---|---|---|---|---|---|---|
| 1 | Initial event A | A-B-C-D | A | B | C | D | Loss |
| 2 | Initial event A | A-B-A | A | B | A | Loss | |
| 3 | Initial event A | A-A-C-D | A | A | C | D | Loss |
| 4 | Initial event A | A-C-D | A | C | D | Loss | |
| 5 | End event L | B-L-D-L | L | D | L | B | Start |
| 6 | End event L | A-L | L | A | Start | ||
| 7 | End event L | L-C-D-L | L | D | C | L | Start |
| 8 | End event L | C-D-L | L | D | C | Start |
In Flow analysis, the number of sessions of a node in a certain step is equivalent to the sum of all the nodes reached in the previous step.
Taking the above example as an example, the node value of 'starting with A, the fourth step is D' will be composed of sequence 1 and sequence 3 together.
# V. Best Applications
# 5.1 Access to the Golden Flow
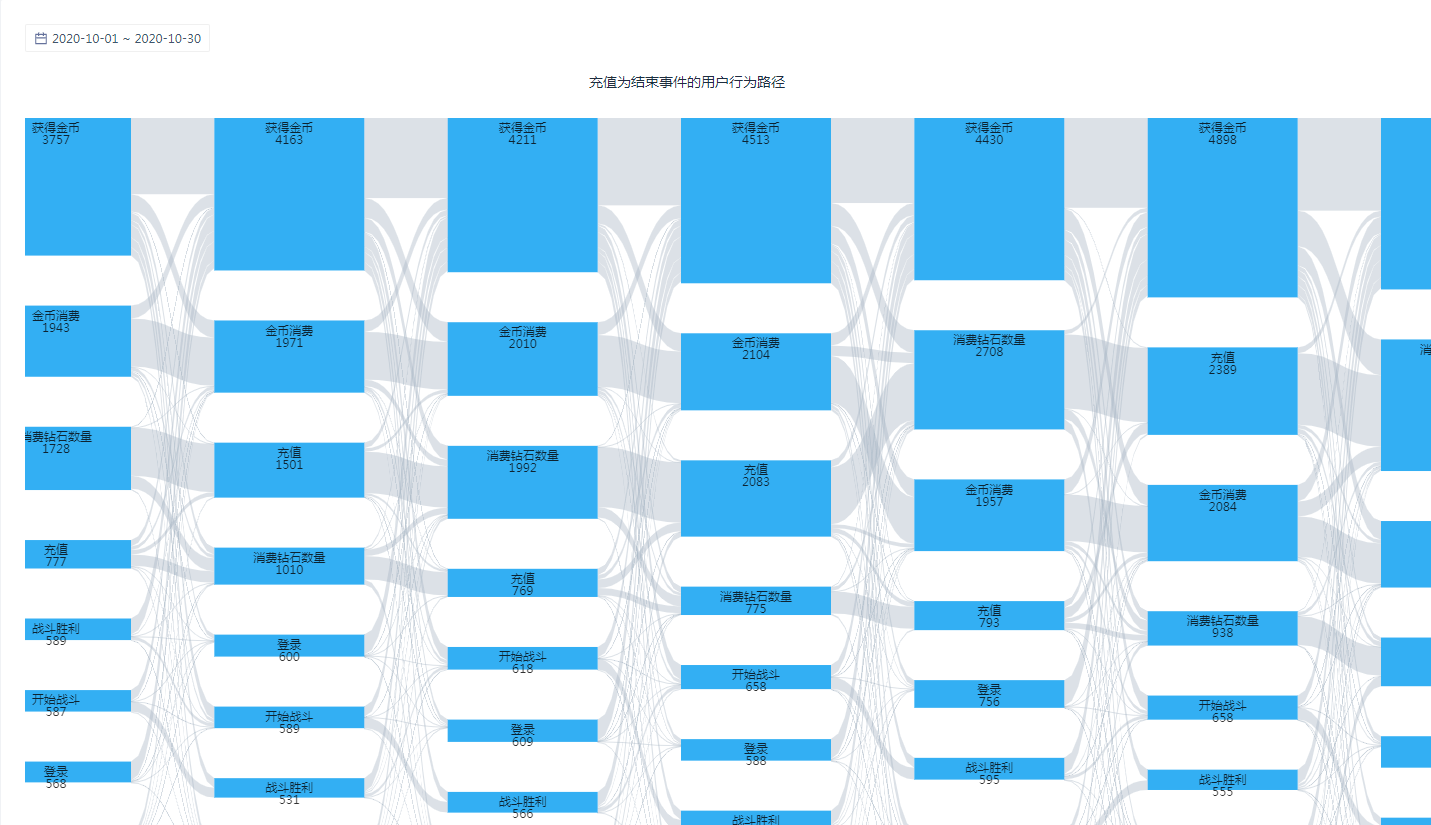
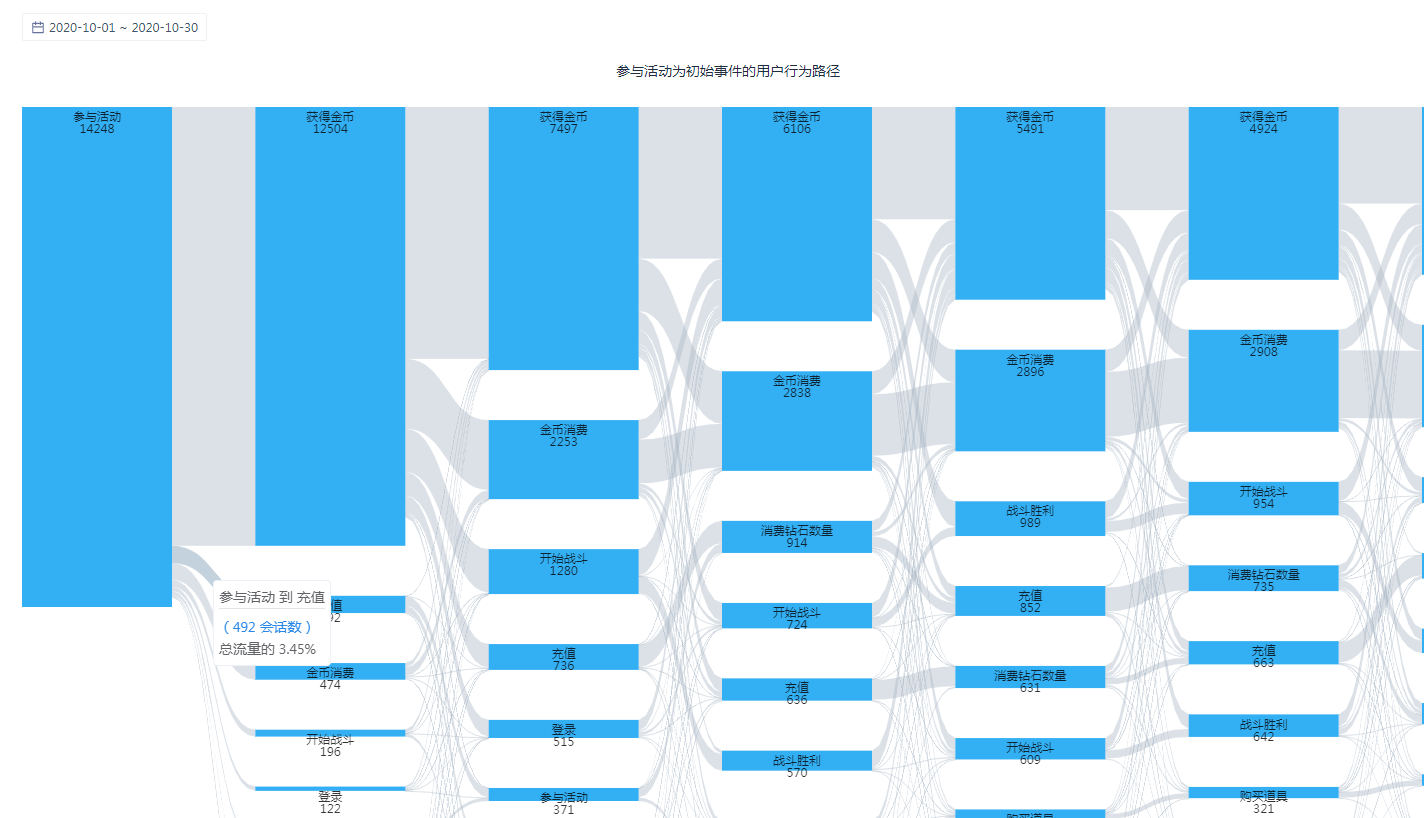
In some products, the golden Flow for users to use the product is very critical and is often directly related to commercial success. Flow analysis is suitable for obtaining users' golden Flows. Generally, 'open application' is used as 'starting event' or 'paid event' is used as "ending event". After that, behaviors such as 'page browsing' and 'purchasing goods' are included in participating events. Pay attention to the forward Flow in the analysis results of Flow analysis, conduct follow-up analysis on transformed users in groups, or exclude unrelated events to explore the golden Flow of products.
# 5.2 Understanding Operational Preferences
Golden Flow exploration is a Flow analysis in a larger scenario. In fact, Flow analysis is also suitable for analyzing user behavior in a smaller scenario and a shorter period of time. For example, users prefer to click ICON at the bottom or ICON under the heading after entering the product page. Or whether the gift package will be used immediately after purchase. Flow analysis can be considered as a more meshed, shorter window funnel in this case, and some funnels in this case are suitable for analysis using a Flow model.