# Distribution Analysis
# I. The Significance of Distribution Analysis
Distribution analysis models can be divided into intervals based on the total number of completions, days, or attribute values aggregated by each user (analysis body), to see the number and proportion of users in different intervals. Here are some common scenarios for analysis:
- Event frequency (number of times): divide the interval by the number of users participating in battles per day to see the number of users with different battles per day.
- User adhesiveness (days): According to the user's login days in the past seven days, distinguish users with different adhesiveness for subsequent analysis.
- Attribute value: according to a period of time, the accumulated payment amount of recharge will split the user into large R, medium R and small R, and see the percentage of users at different levels.
# II. Location and Applicable Role of Distribution Analysis
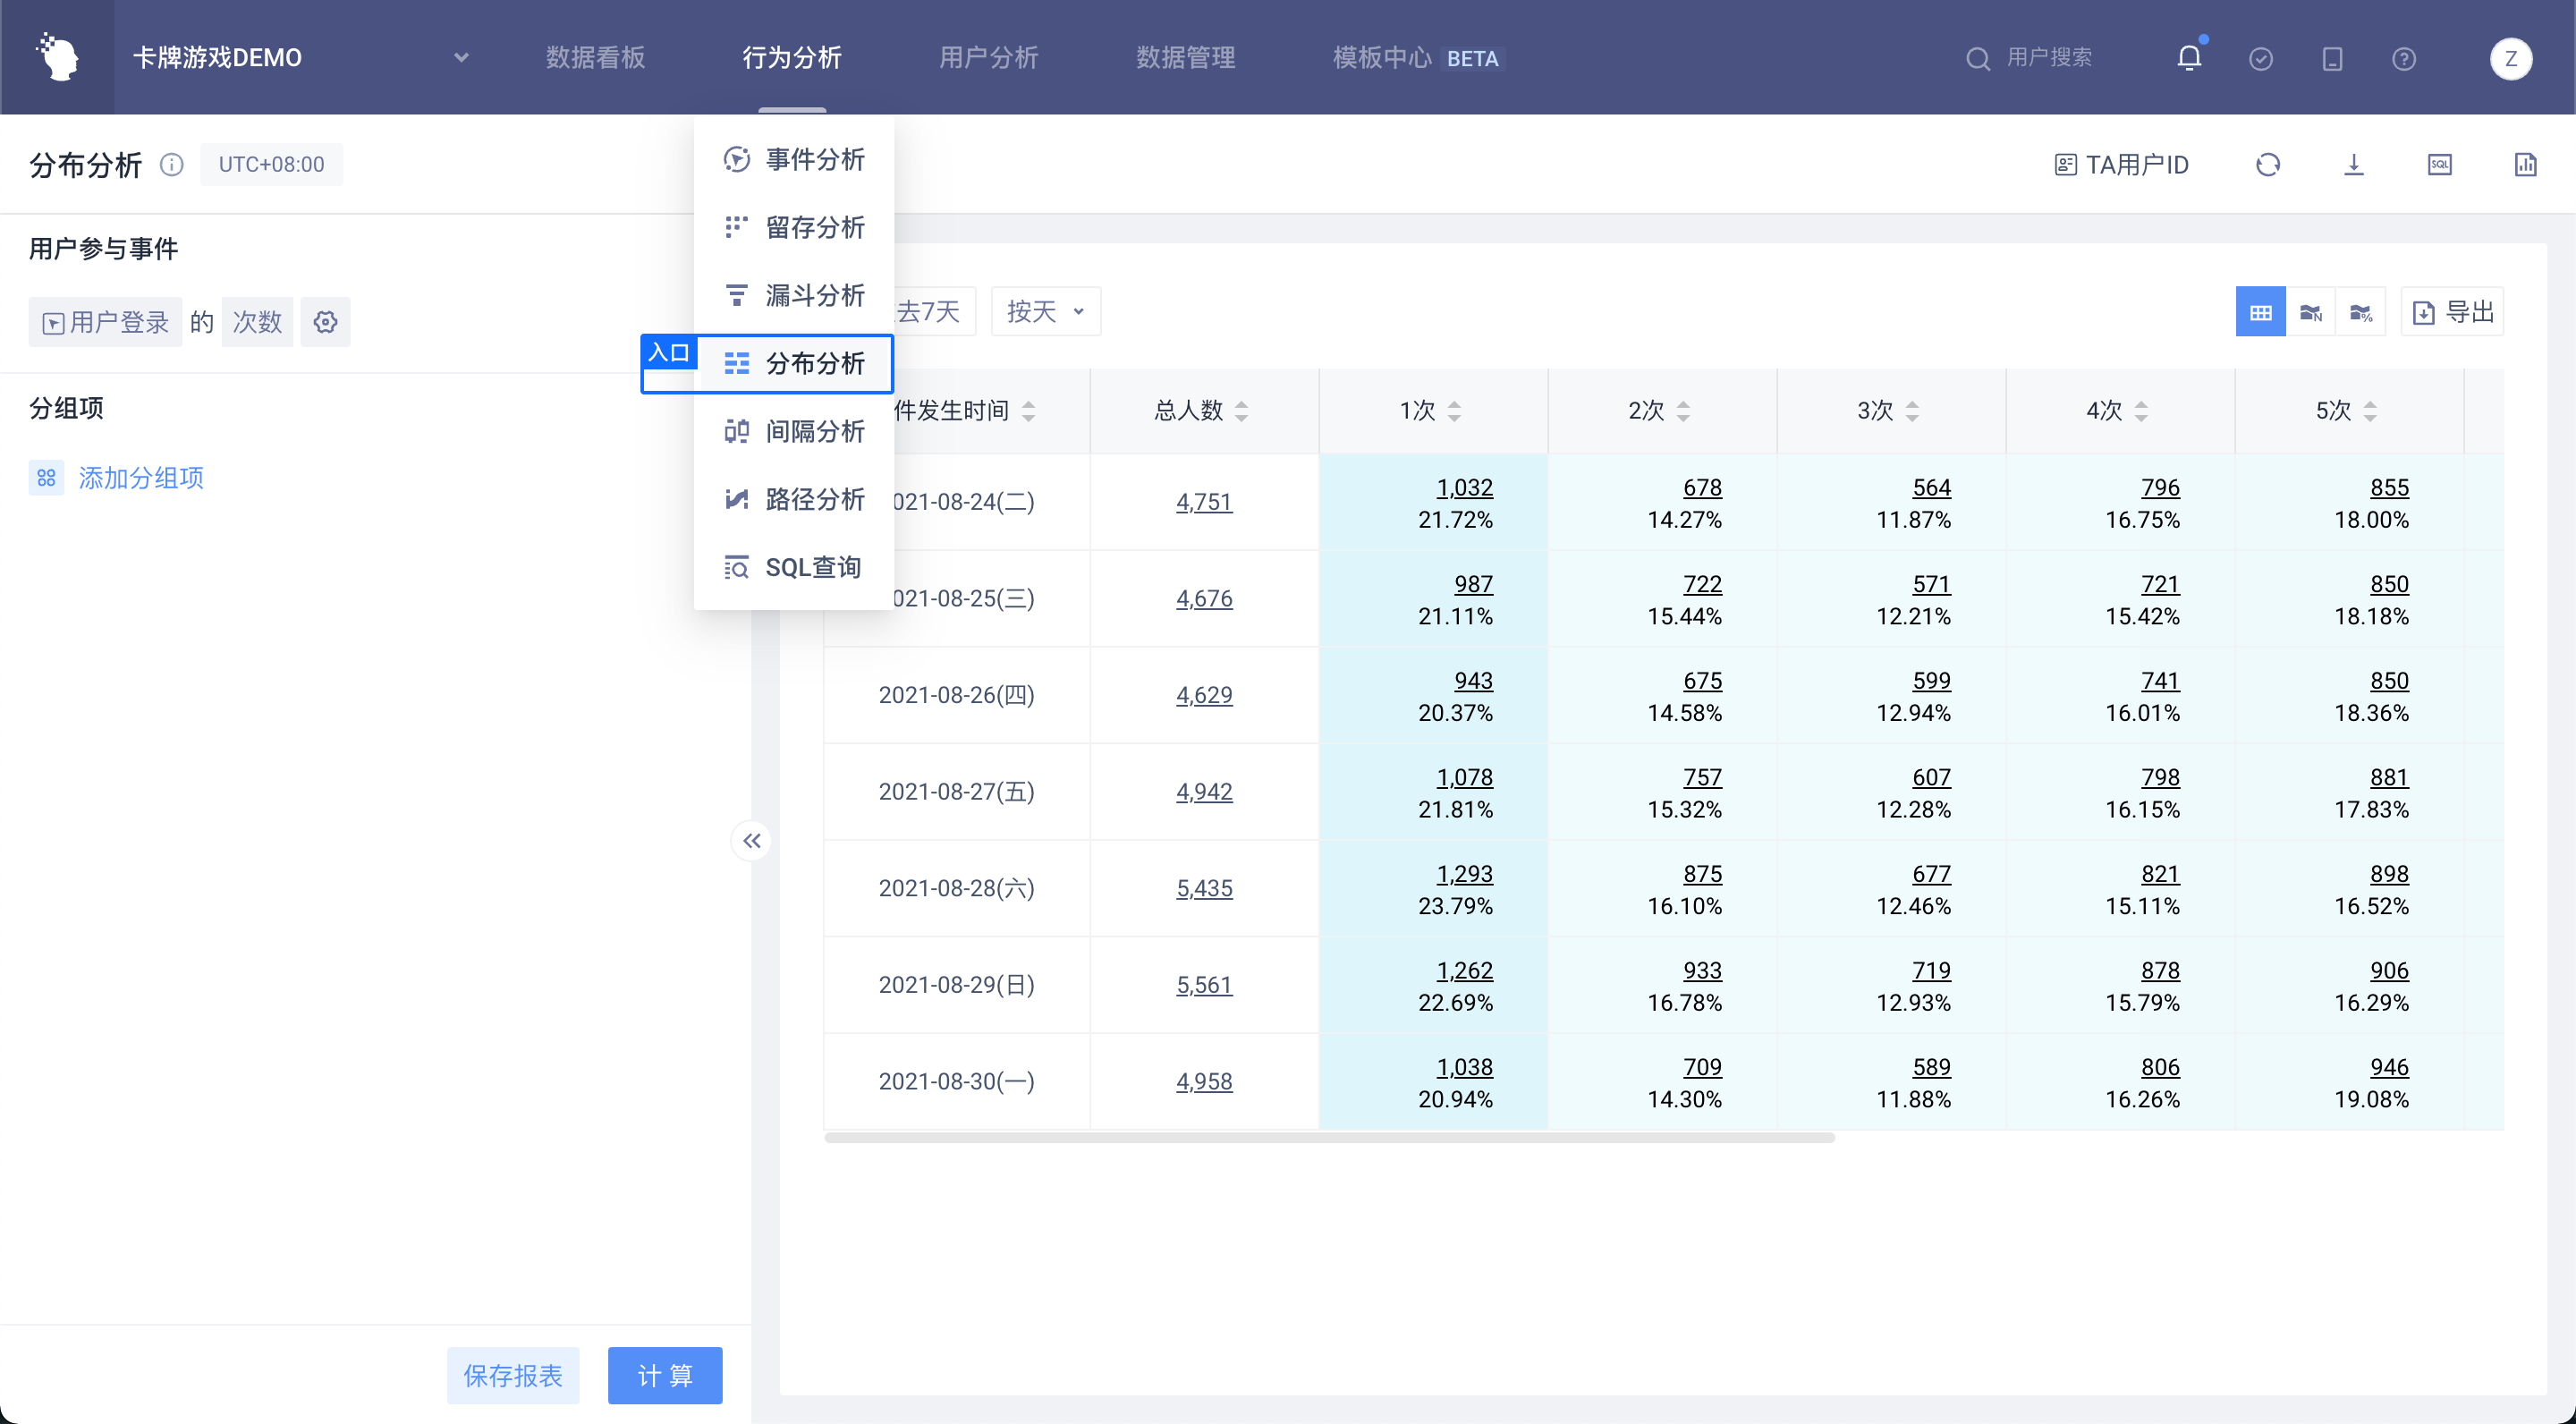
Select 'Distribution Analysis' in 'Behavior Analysis' in the top navigation bar to enter the distribution analysis model:
| Company Supervisor | Administrator | Analyst | Ordinary members | |
|---|---|---|---|---|
| Distributed analysis model | ● | ● | ▲ | △ |
Permission description:
● Role must have
▲ The role has the permission by default, but can revoke
△ The role is not available by default, but can be authorized
○ Role must not have
# III. Overview of Distribution Analysis Page
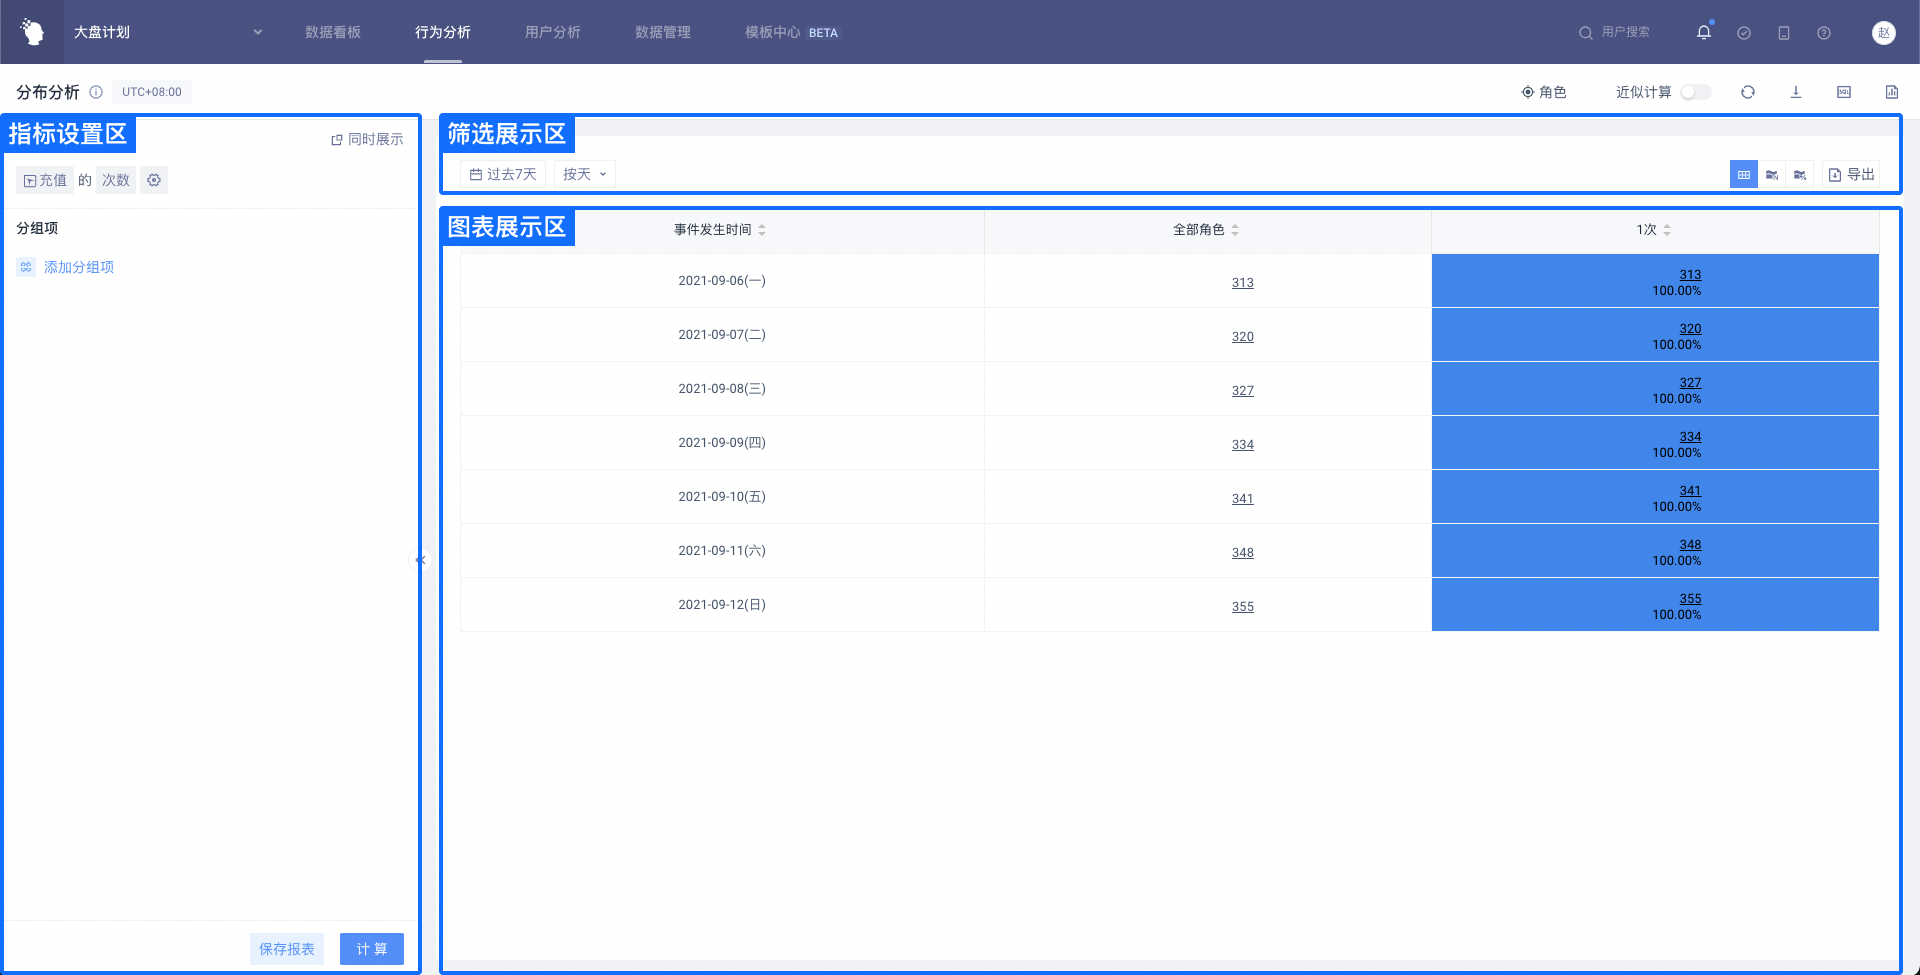
Like other models, distribution analysis is also composed of three parts: 'index setting area', 'filter display area' and 'chart display area'.
# 3.1 Indicator Setting Area
# 3.1.1 Setting of Customer Engagement Events
Similar to event analysis, distributed analysis can select ('Event' + 'Attribute' + 'Calculation Method') or directly ('Event' + 'Calculation Method') when setting customer engagement events, but the supported calculation methods are different from event analysis. See below for details:
| Event | Attributes | Calculation method |
|---|---|---|
| Any event | Number of times, days, hours | |
| Meta event | Number of times, days, hours | |
| Meta event | Event properties (numeric) | Sum, mean, maximum, minimum, deduplicate |
| Meta event | Event properties (Boolean) | True number, false number, empty number, not empty number, deduplicate number |
| Meta event | Event properties (text, time, list) | Deduplicate number |
Switching to indicator formulas is also supported here to view the distribution of values obtained by users based on indicator formulas.
# 3.1.2 Setting of Distribution Interval
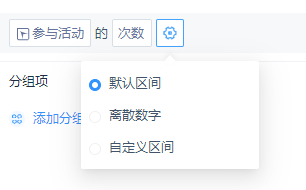
Click on the pinion icon to open the interval setting. By default, 'Default Interval' will be selected. The logic of all options is exactly the same as the interval setting of numerical type attributes in grouping items.
| Calculation method | Unit |
|---|---|
| Number of times | Times |
| Number of days | Day |
| Number of hours | Hour |
| The value of a numeric attribute (except for the number of deduplicates) | Consistent with attribute units |
| Deduplicate number or other angle | "None." |
# 3.1.3 Setting and Interaction of Filter Conditions
- Setting of Filter Criteria
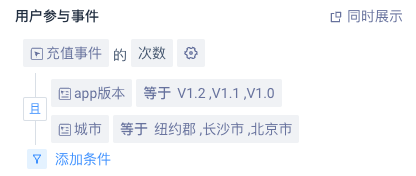
Event attributes or user attributes or user groups under this event can be filtered. The filtering criteria support and/or logic, and the analysis of the same event is consistent.
| Filter item data types | Example | Supported filtering logic keywords |
|---|---|---|
| Value | Consumption amount | Equal to, not equal to, less than, less than or equal to, greater than, greater than or equal to, with value, without value, interval |
| Text | Province | Equal to, not equal to, include, not include, have value, have no value, regular match |
| List | ID list | Existing element, non-existing element, element location, value, no value |
| Time | Registration time, last active date (yyyy-MM-dd HH: mm: ss. (SSS or yyyy-MM-dd HH: mm: ss) | Located in interval, less than or equal to, greater than or equal to, relative to current date, relative to event occurrence time, with value, without value |
| Boolean | Wifi use | True, false, valuable, worthless |
| Object | Player resource snapshot | Value, no value |
| Object group | Expedition lineup | Existing object satisfies, no object satisfies, all objects satisfy, has value, has no value |
If the filter uses user grouping, you can choose 'belong to the group' or 'do not belong to the group'.
- Interaction of Filter Criteria
# 3.1.4 Rename

When 'Rename' is selected, you can rename the analysis content, which is displayed in the table.
# 3.1.5 Selection of Simultaneous Display Options
Users based on a certain distribution interval can continue in-depth analysis by displaying options at the same time.
Click the 'Show at the same time' button, a new option will appear, the name is 'Show customer engagement between sectors at the same time', you can choose ('Event' + 'Attribute' + 'Calculation Method') or directly ('Event' + 'Calculation Method'), the options are consistent with the event analysis model.
| Event | Attributes | Calculation method |
|---|---|---|
| Any event | Total number of times, number of triggered users, number of times per capita | |
| Event | Total number of times, number of triggered users, number of times per capita | |
| Event | Event attributes (numeric) | Sum, mean, maximum, minimum, average, deduplicate number, 99 percentiles, 95 percentiles, 90 percentiles, 80 percentiles, 75 percentiles, 70 percentiles, 60 percentiles, 40 percentiles, 30 percentiles, 25 percentiles, 20 percentiles, 10 percentiles, 5 percentiles |
| Event | Event properties (list type) | List deduplicate number, list element deduplicate number |
| Event | Event properties (Boolean) | Deduplicate number, true number, false number, empty number, not empty number |
| Event | Event properties (non-numeric, Boolean) | Deduplicate number |
It should be noted that the number of users triggered by the simultaneous display option is the deduplicate number **of the currently selected analysis subject **, not the deduplicate number of the unique user ID. Currently, the simultaneous display indicator is not supported to drill down or save as result grouping at the same time.
# 3.1.6 Grouping of Users

(1) Options to View Objects in Groups
Grouping items can select event attributes of events or user features, user grouping, and user tags. ( When the analysis object is an arbitrary event, the event attribute of the event is the event public attribute)
(2) Summary of Numerical, Time and Tabular data
Numerical data can be summarized according to intervals, with three options: default interval, discrete number and custom interval.
Time-based data can be summarized according to time granularity, with five options: day, minute, hour, week and month.
List data can be summarized by element, whole list and element set.
# 3.2 Filter Display Area
# 3.2.1 Initial Analysis Page and Options

There are analysis periods, analysis granularity, group selections, chart styles to choose from, and tables can be exported or data can be downloaded in full. If the Simultaneous Display option is set in the indicator setting area, the 'View only Simultaneous Display Data' option is displayed in the filter display area.
# 3.2.2 Default Settings and Selection Range for Each Option
**Analysis period: **The time range interval for analyzing data will be determined. By default, 'Last 7 days (dynamic time)' is selected
Analysis granularity: **'**by day' is selected by default; You can choose daily, weekly, monthly and total. When 'by week' or 'by month' is selected, the analysis period is complemented by actual granularity in the same way as the event analysis model.
**Group check: **Group check is a general or possible group item, which is a radio box. This option is valid only when the chart type is not a table.
**Chart style: **table, numerical distribution, percentage distribution, histogram, line graphs, histogram.
**V**iew Simultaneous Display Data Only**: **By default, no checks are made and all charts in the selected chart display area are plotted according to the simultaneously displayed indicators only.
# 3.3 Chart Display Area
According to the time granularity selected by the user and whether to check 'View Simultaneous Display Data Only', the type of chart displayed is also different.
| Whether to tick 'V iew Simultaneous Display Data Only ' | Time granularity | Types of charts displayed |
|---|---|---|
| Untick 'V iew Simultaneous Display Data Only ' | Non-total | Table, numerical distribution, percentage distribution |
| Untick 'V iew Simultaneous Display Data Only ' | Total | Table, histogram |
| Tick 'V iew Simultaneous Display Data Only ' | Non-total | Table, line graphs |
| Tick 'V iew Simultaneous Display Data Only ' | Total | Table, histogram |
Note: Untick 'View Simultaneous Display Data Only', there may be two situations:
- The 'View Simultaneous Display Data Only' botton is not set in the left indicator setting area.
- There is a 'View Simultaneous Display Data Only' button in the indicator setting area on the left , but the 'View Simultaneous Display Data Only' option is not ticked in the filter display area.
# 3.3.1 Table
# 3.3.1.1 Table Main Structure
- The first row is table title, from left to righ are the event time, all users (analysis subject), interval 1, interval 2...
- The contents in the table from top to bottom are: the number of users (analysis subjects) in the area, the proportion, and the simultaneous display indicators.
- When the mouse moves over the table, the data logic corresponding to the cell is displayed.
# 3.3.1.2 Event Time
- The time interval of the event is determined by the analysis period.
- According to the analysis granularity, split and complete the time period, such as "2021-09-06 week" and "2021-09 month"
# 3.3.1.3 Impact of Group Details
Group details are radio boxes and this option does not affect the display of the table when it is in a table state, i.e. the entire data is still displayed.
# 3.3.1.4 Display Logic of Grouping
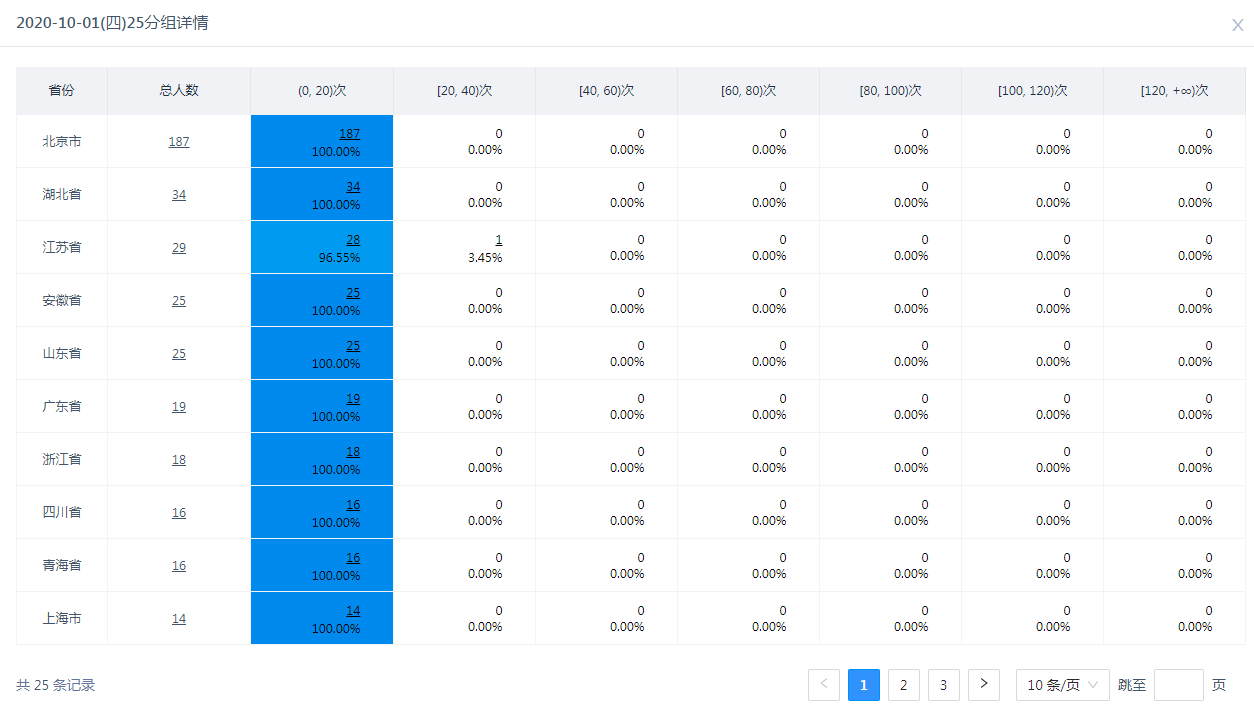
- Group items can be stowed or expanded. When expanding grouping items, you can expand grouping items under multiple dates.
- Sorting of groupings sorted by the total number of people under the certain date.
- The group attributes of each user are counted according to the attributes when the actual behavior occurs.
- A total of 1,000 possible 'date + group' data are recorded, and the complete data can be selected 'Download full data in page format'.
- Supporting drilling down to the user list, you can enter the user list by underlining, and further view the user behavior sequence of individual users.
# 3.3.1.5 Display Logic Under Multi-grouping Items
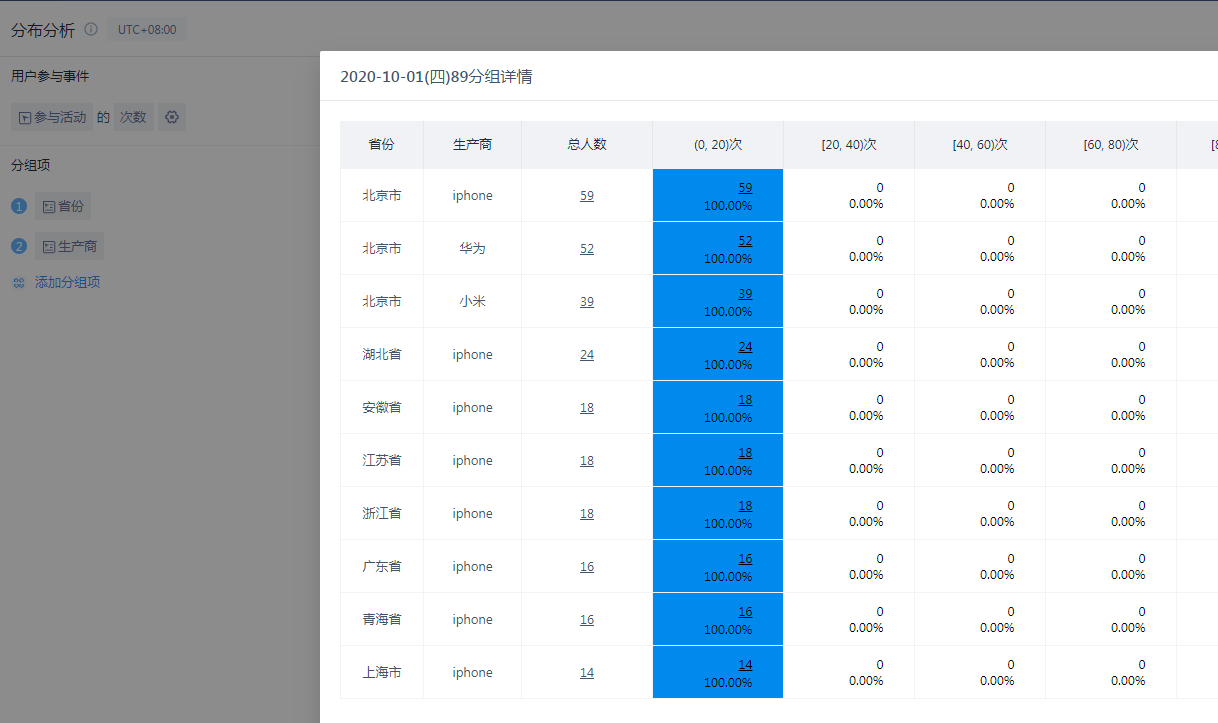
When expanded, you can view data under the intersection of multiple group items at the same time.
# 3.3.2 Numerical distribution, Percentage distribution
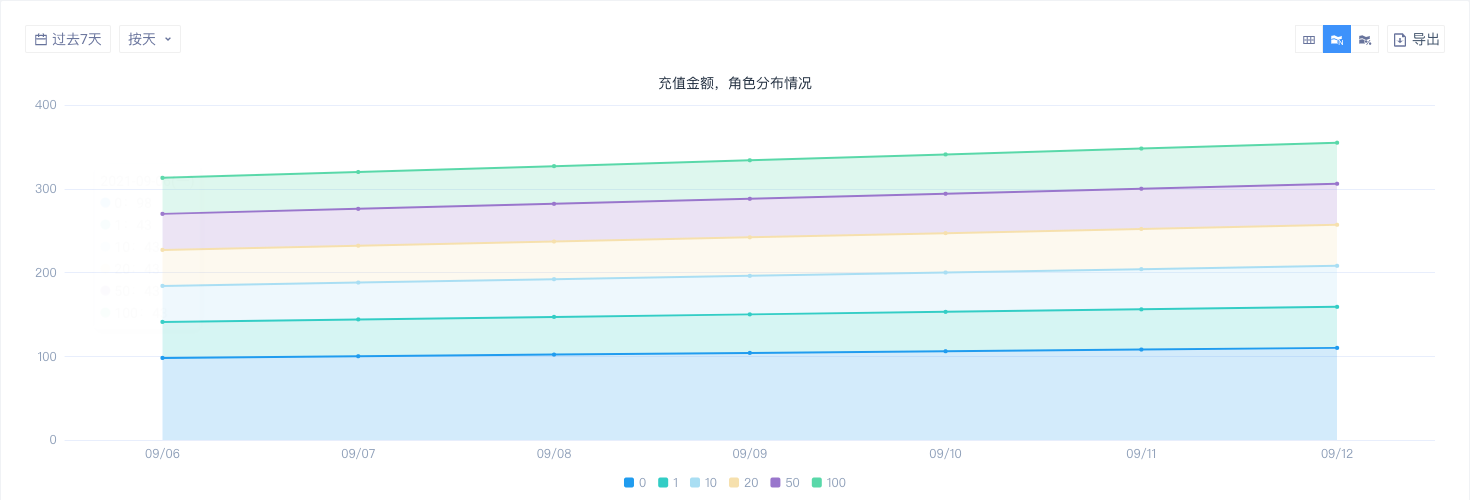
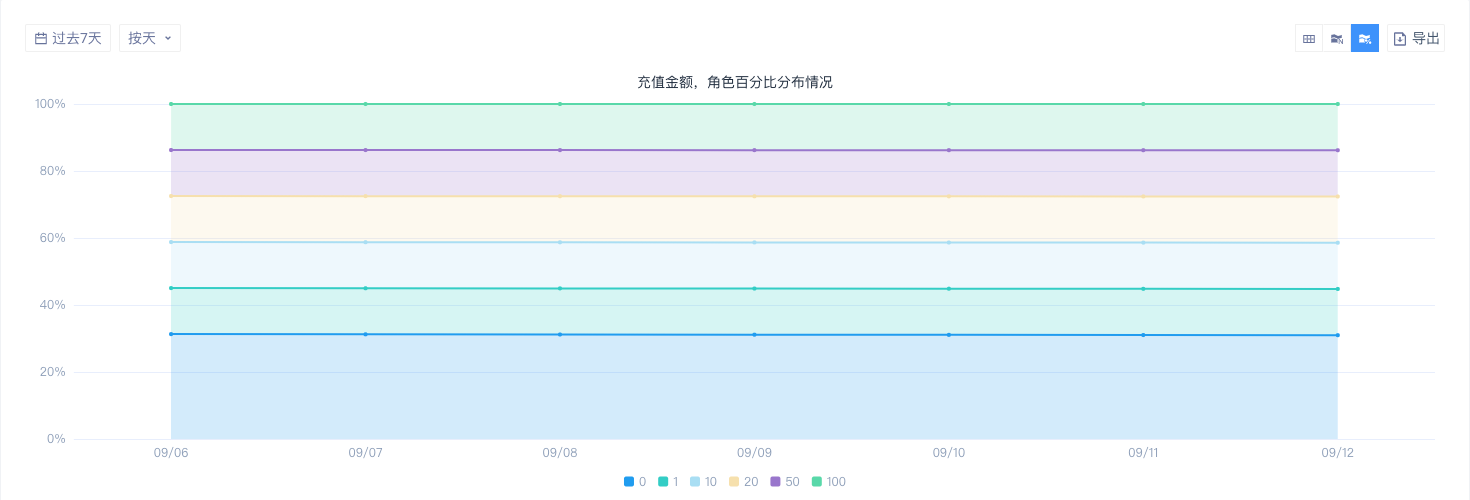
Display scene: Untick 'View Simultaneous Display Data Only', and the time granularity is non-total.
Each color (graphic) represents the trend of the number of users or the proportion of users in the area with the date. If you set a group item in the indicator setting area, you can click the 'Grouping' drop-down list to switch. The default setting is 'Overall'.
# 3.3.3 Histogram
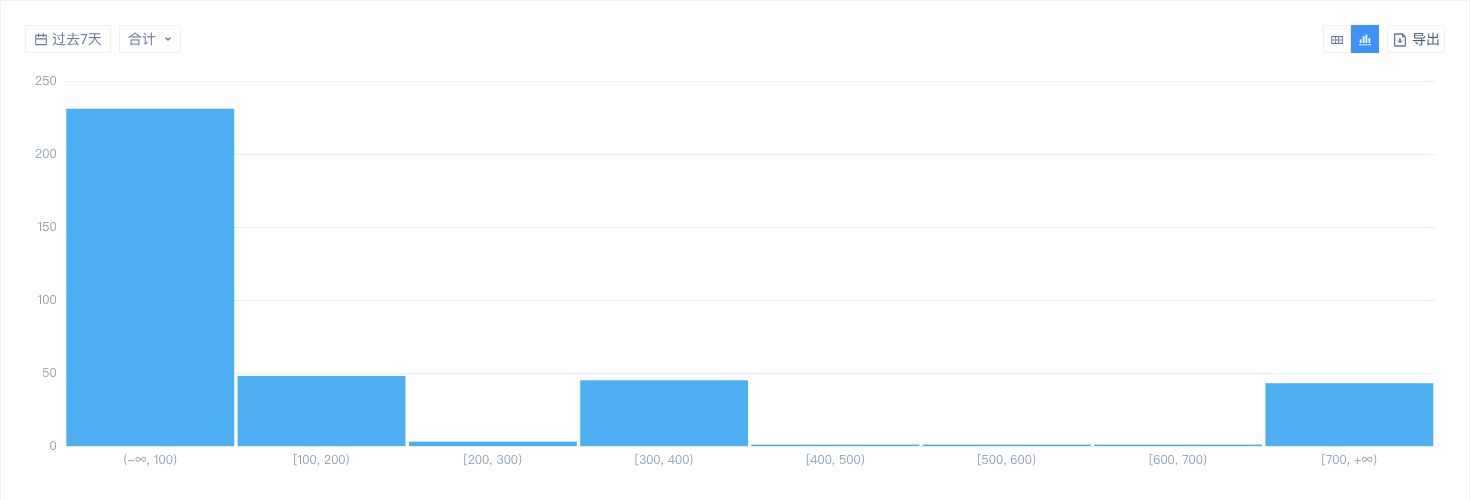
Display scene: Untick 'View Simultaneous Display Data Only', and the time granularity is total.
Each column represents the number of users in the zone. If you set a group item in the indicator setting area, you can click the 'Grouping' drop-down list to switch. The default setting is 'Overall'.
# 3.3.4 Line Graphs
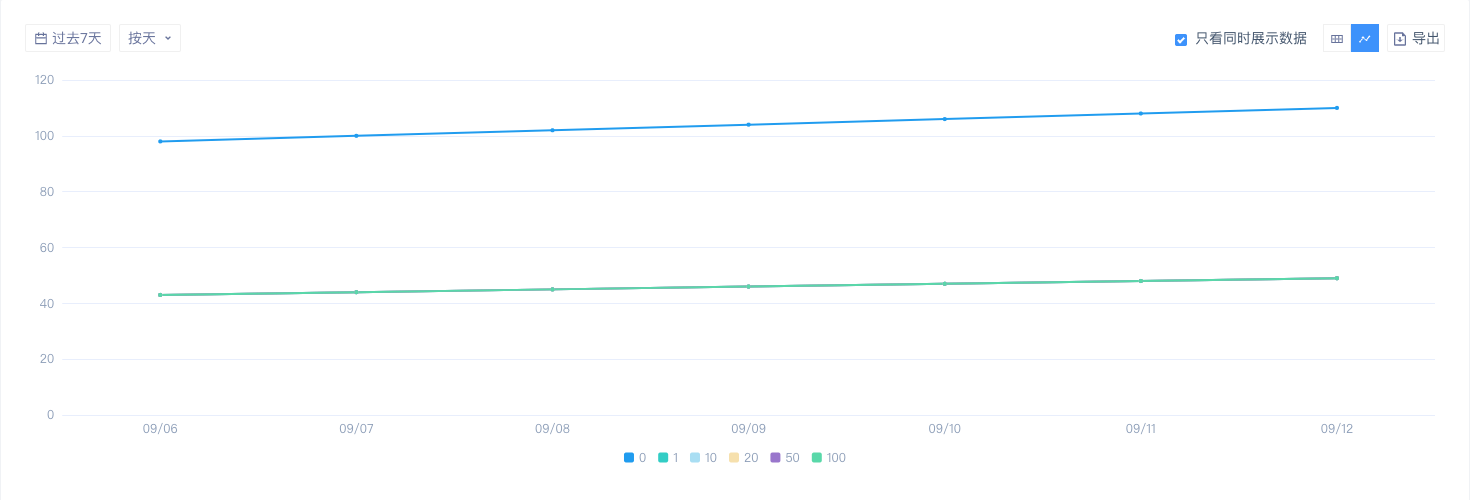
Display scene: Untick 'View Simultaneous Display Data Only', and the time granularity is non-total.
Each polyline represents the trend of the user's **simultaneous display indicator **with the date. If you set a group item in the indicator setting area, you can click the 'Grouping' drop-down list to switch. The default setting is 'Overall'.
# 3.3.5 Histogram
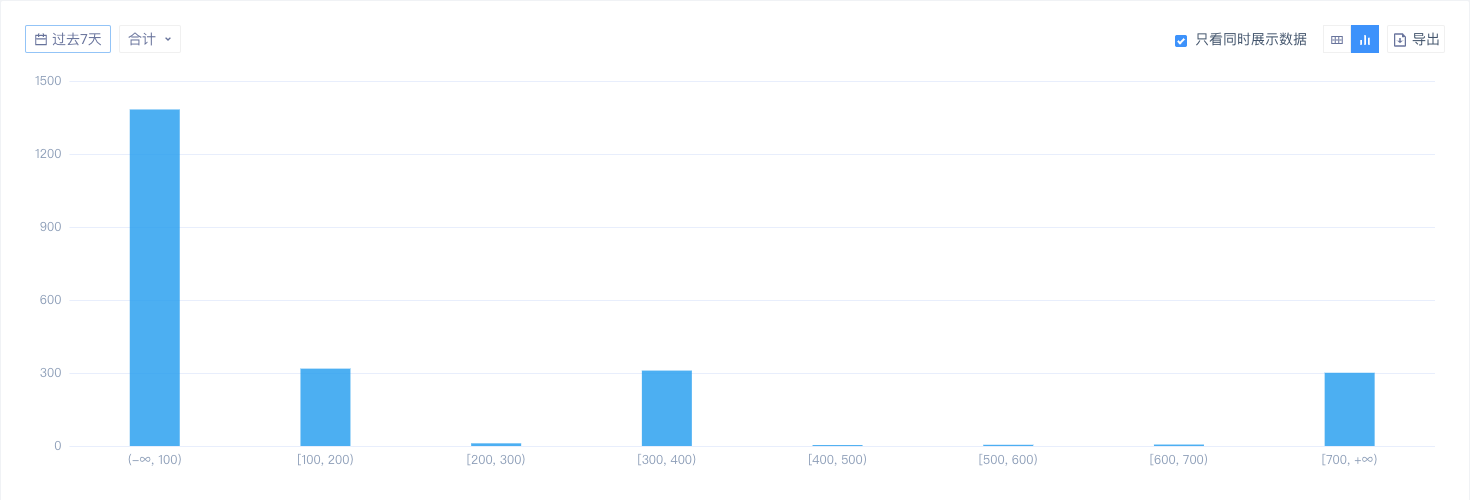
Display scene: Untick 'View Simultaneous Display Data Only', and the time granularity is total.
Each column represents the **simultaneous display indicators **of users in this interval. If you set a group item in the indicator setting area, you can click the 'Grouping' drop-down list to switch. The default setting is 'Overall'.
# IV. Usage of Distribution Analysis
# 4.1 Common Usage Scenarios
1. Initial **A**nalysis **S**cenario
The initial analysis is based on the overall analysis, such as the analysis of the number of active hours of players per day within a week.
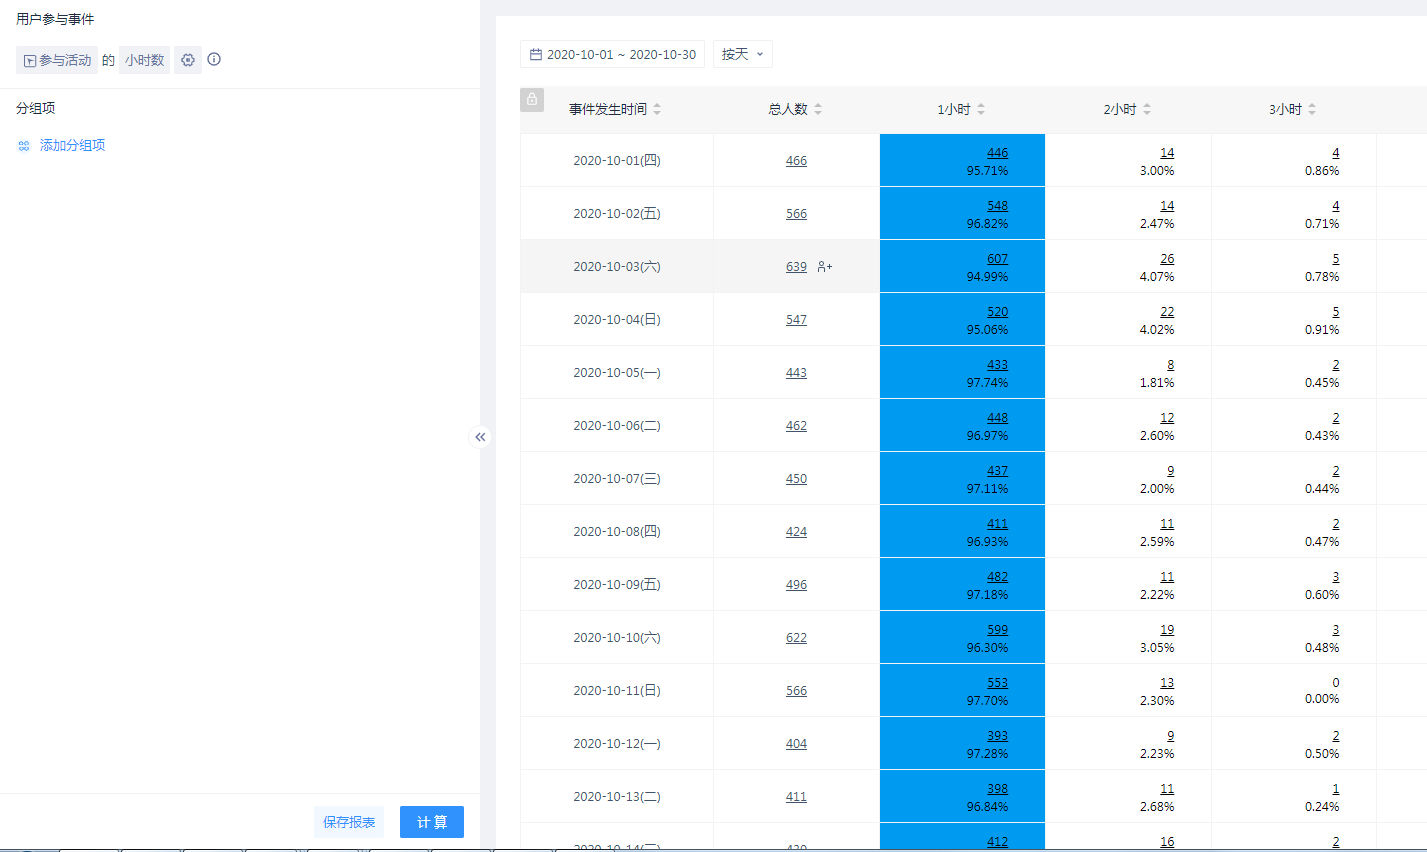
2. View **A**nalysis **S**cenarios in **S**pecified **G**roups
If you look by province, the number of active hours per day in each province within a week.
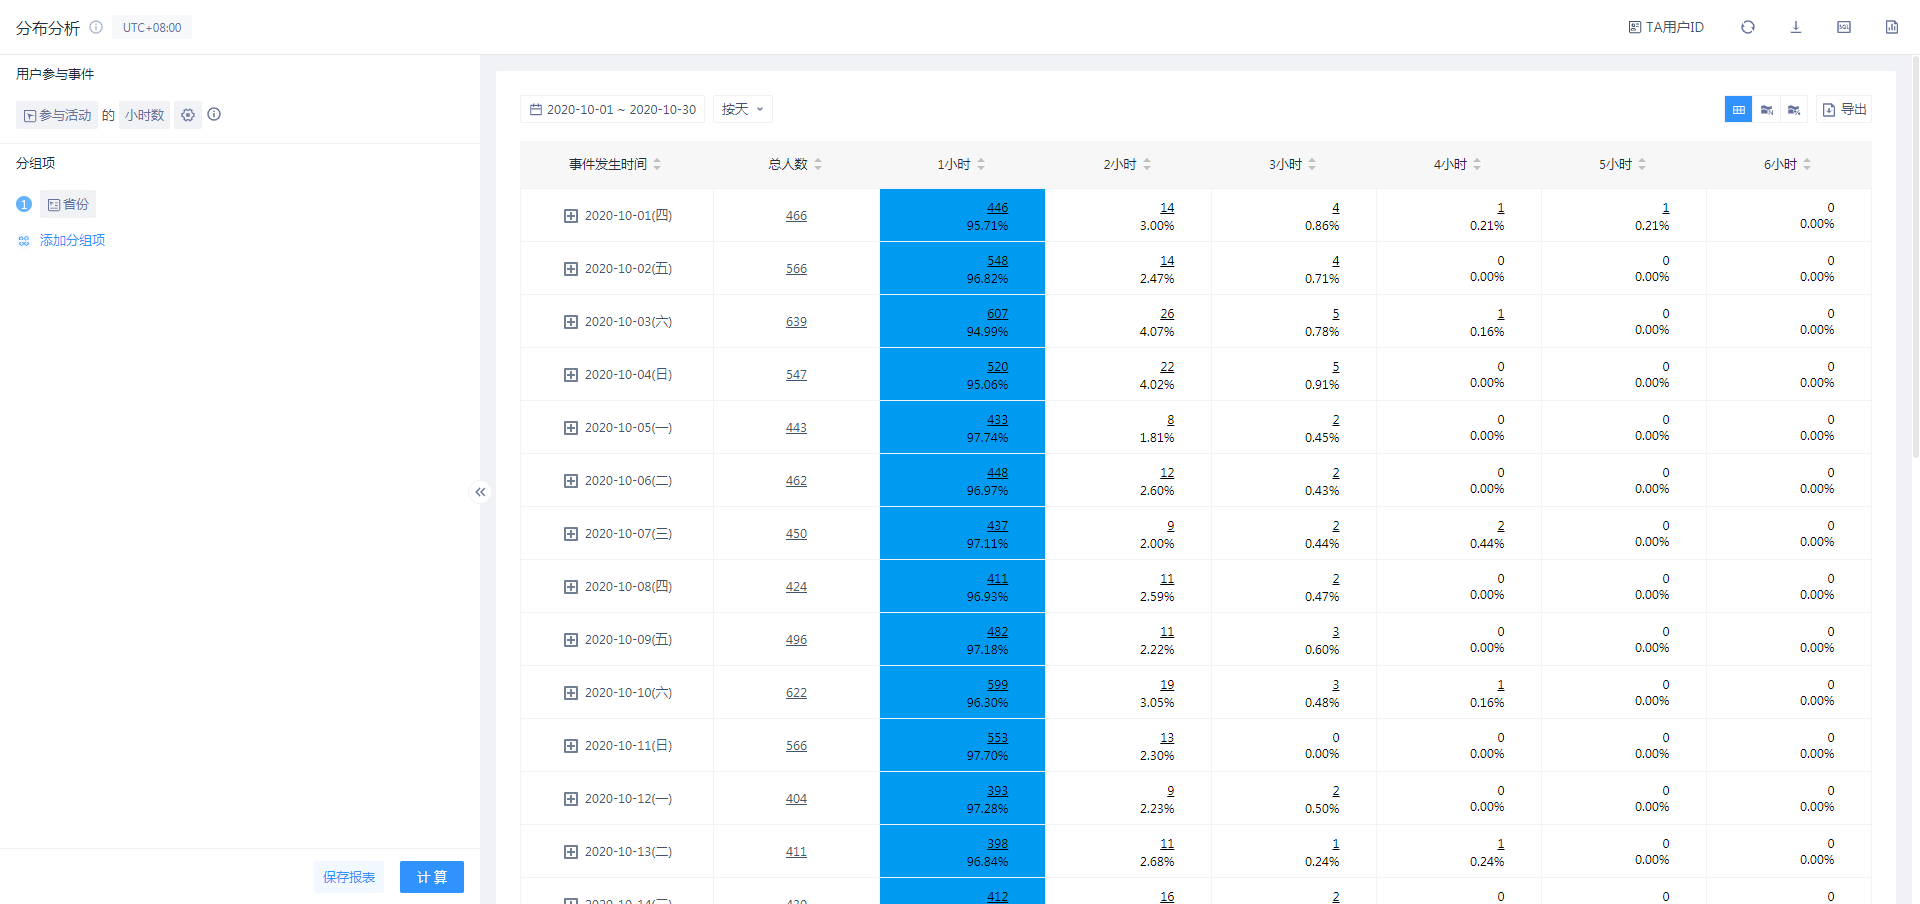
3. View the **T**rend of the **N**umber of **P**eople **D**istributed by **T**ime

4. Percentage **C**hange **T**rend in the **D**istribution by **T**ime

# 4.2 Data Calculation Logic
# 4.2.1 Attribution of Groups
Data is counted when customer engagement is analyzed within the breakdown time by analysis granularity.
If viewed in groups (event properties, user features, or user grouping), the behavior is recorded in the specific group values.
**For example: **Xiaoming and Xiaomei recharged in Shanghai, Hangzhou and Ningbo on January 1st respectively. The specific recharge times are as follows:
| Shanghai | Hangzhou | Ningbo | |
|---|---|---|---|
| Xiao Ming | 1 | 2 | 3 |
| Xiaomei | 9 | 6 | 3 |
| Shanghai | Hangzhou | Ningbo | Overall | |
|---|---|---|---|---|
| Xiao Ming | 1 | 2 | 3 | By total = 6, 18 |
| Xiaomei | 9 | 6 | 3 | |
| By city | Shanghai = 1, 9 | Hangzhou = 2, 6 | Ningbo = 3, 3 | |
| By province | Shanghai = 1, 9 | Zhejiang = 5, 9 | ||
# 4.2.2 Group Value and the Display Upper Limit
- First, the total data from the entire time interval is calculated by grouping. When the number of possible groupings exceeds 1,000, the 1,000 items with the largest total value are taken as specific grouping classes. And this sort is used as the sort in the grouping details.
- When you look at a specific date, you can expand the specific grouping under that date.
# V. Best Applications
# 5.1 Knowledge of the Distribution of Participatory Behaviour
Distribution analysis is very similar to event analysis in setting. From an algorithmic point of view, distribution analysis can also be regarded as a drill-down of event analysis indicators. In event analysis, the sum of aggregation and average value can be obtained, and the number of concentrated quantities can be calculated. Distribution analysis models can directly calculate the complete distribution of indicators, which can describe the actual participation in a more detailed way, so as to further understand the parts of concentration that cannot be expressed.
# 5.2 Access to High-value Users
By By clustering the payment amount of users through distribution analysis, the number of users in each payment grade can be obtained and further user clustering can be supported. Then, high-value users can be easily obtained by clustering users in high payment grade. Replacing the payment amount with other behaviors worthy of attention can also group users with high participation, thus obtaining high-value users.
# 5.3 View Gold Receipt and Expenditure for Users with Different Gold Consumptions
Maintaining the balance of virtual currency output and expenses in the game is a daily task of operations. Taking gold coins as an example, first set an interval according to the consumption of gold coins of each user, divide users into different groups, and then set simultaneously display index: per capita value of gold coin acquisition - per capita value of gold coin consumption.** **In the table, economic system health can be analyzed positively and negatively and broken down into individual groups.
