# TA Mobile Edition
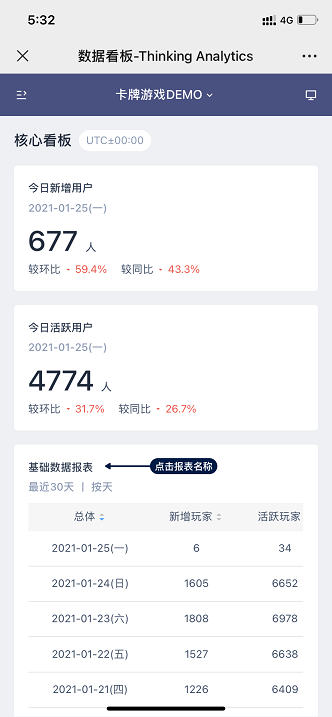
Since version 3.1, TA users can access TA through their mobile phones and view the data dashboard content on the phone.
# I. Login to TA Mobile
Users can log in to TA in the following two ways:
- Address Login
Open the TA address in the mobile browser and view it after logging in
- Third-party workbench authorization login (recommended)
After binding to third-party platforms(WeCom/DingTalk/Feishu), directly authorize login in the third-party mobile application workbench
# II. Overview
The mobile homepage consists of three parts: navigation bar, dashboard information, dashboard report.
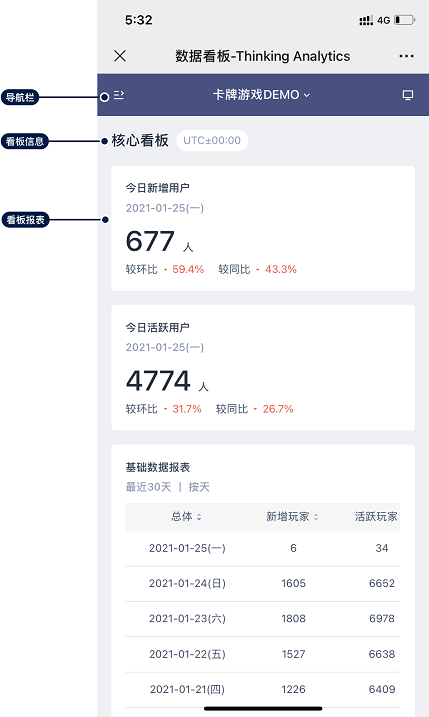
- Navigation bar: including switching items, menu, switching to PC.
- Dashboard information: including dashboard name and time zone information.
- Dashboard Report: Display each report under dashboard.
# 2.1 Navigation bar
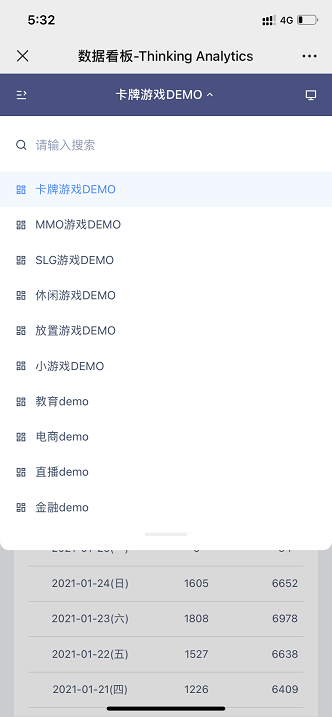
(1) Switch items
Click on the project name to switch projects to view the data dashboard.
(2) Menu bar
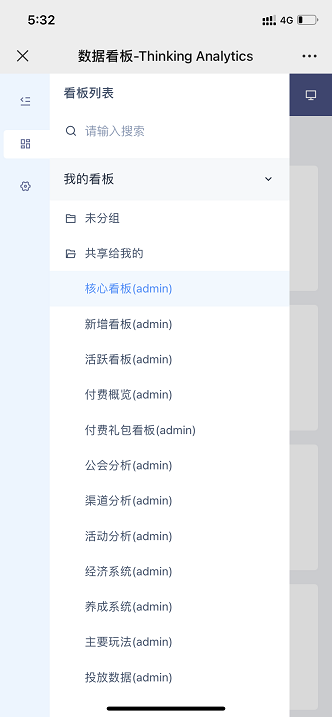
Click the hamburger button in the upper left corner to open the menu bar. The menu bar includes data dashboard and settings.
- Data dashboard
The same as the PC dashboard list, you can switch the dashboard under different projects to view.
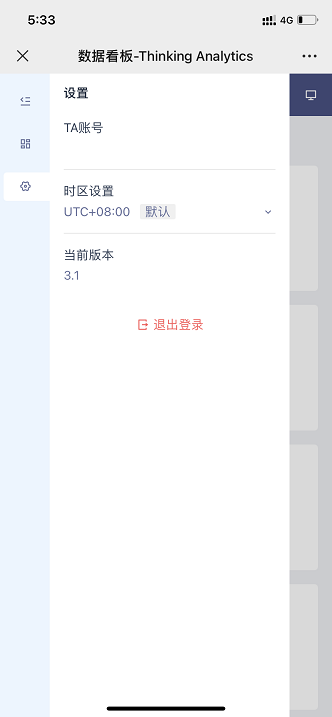
- Settings
Including account information, time zone settings (this option exists for items that turn on time zone settings), current version number and logout.
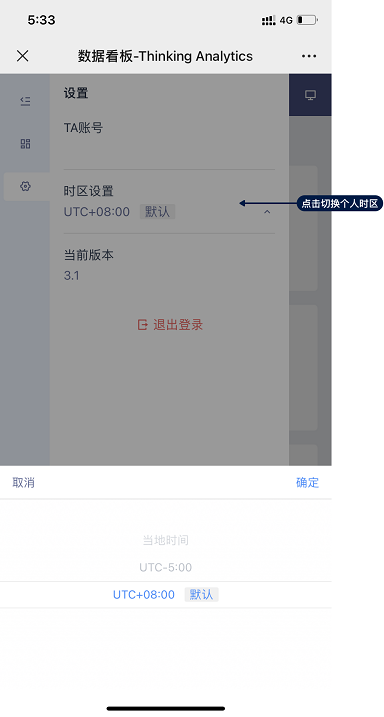
Click Time Zone Settings to switch the individual time zones of the project. After switching, the dashboard in the unlocked time zone will be calculated according to the selected time zone.
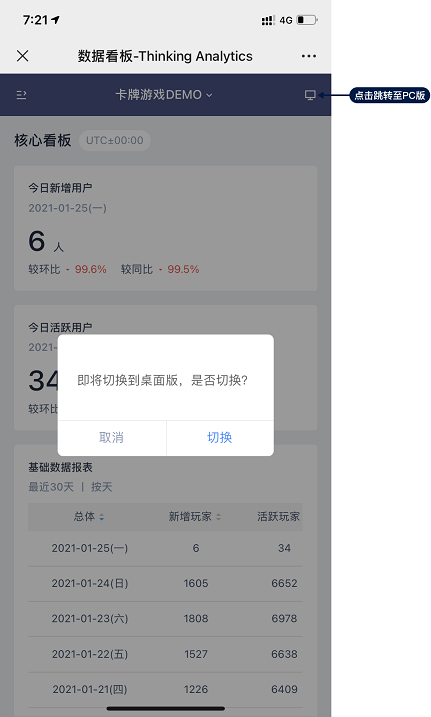
(3) Swich to PC
If you want to access the PC function on the phone, you can click the jump button in the upper right corner to switch to the PC version for use.
# 2.2 Dashboard Information
- Dashboard information includes dashboard name, time zone information (this option exists for items with time zones turned on), and global filtering information (this option exists for dashboards with global filtering criteria saved on the PC version)
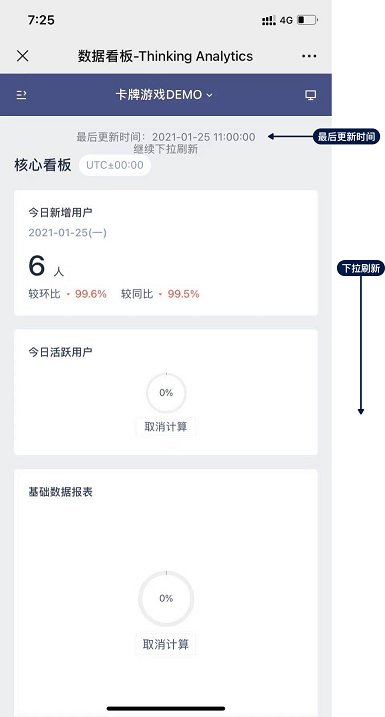
- Refresh dashboard: drop down to view the last update time of the dashboard. Continue to drop down to refresh the dashboard.
# 2.3 Dashboard Report
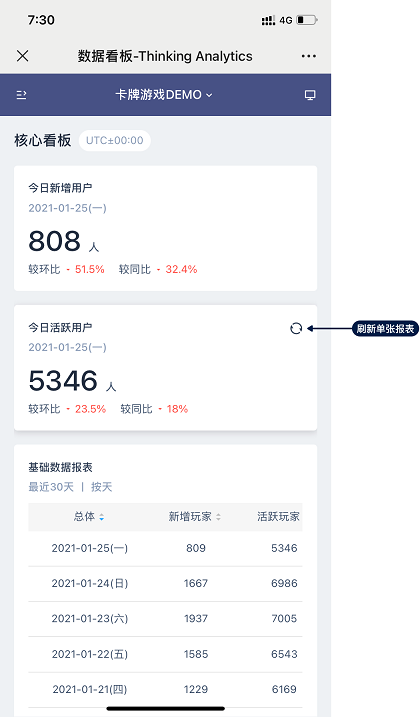
(1) Refresh single report
Click the report in the report area to select the report, the refresh button will appear in the upper right corner, and click 'refresh the single report'.
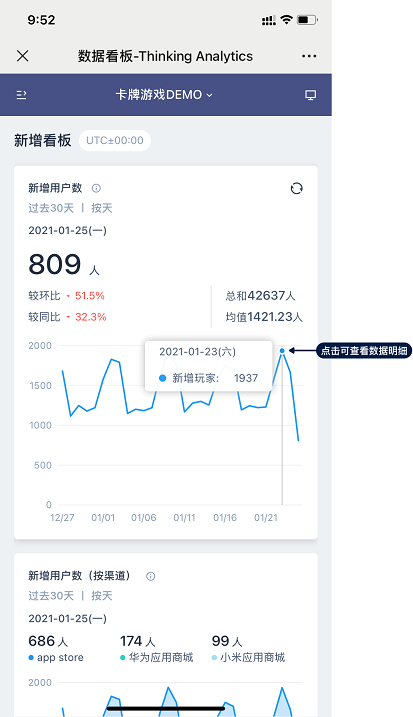
(2) View data details
(3) View report details
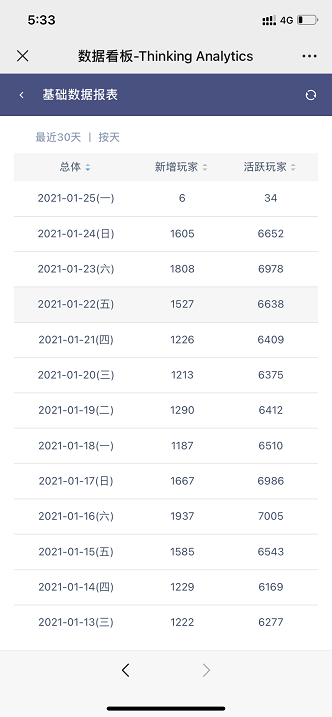
Click on the report name (the small picture does not support viewing details) to enter the viewing report details. The report details page displays the detailed contents of the data in the form of [Data Table].
