# Alerts
# I.The Significance of Alerts
To give project managers the ability of Alerts and monitoring for key data, the main functions are as follows:
- Timely polling of real-time data. For the key indicators exceeding the standard, SMS or email Alerts can be carried out in the first time so as to shorten the response time and improve the control over the product.
- Create early Alerts by editing formulas, such as ratios, to increase flexibility in creating indicators;
- Alerts by grouping, and different grouping items of the same index are warned by different Alerts trigger standards;
- Alerts based on the comparison with forecast value can provide more intelligent and fast insight into abnormal data.
# II. Location and Applicable Role of Alerts
# 2.1 Function Position
The location of early Alerts related functions can be operated through the following two entrances:
- [Data Management-Alerts]
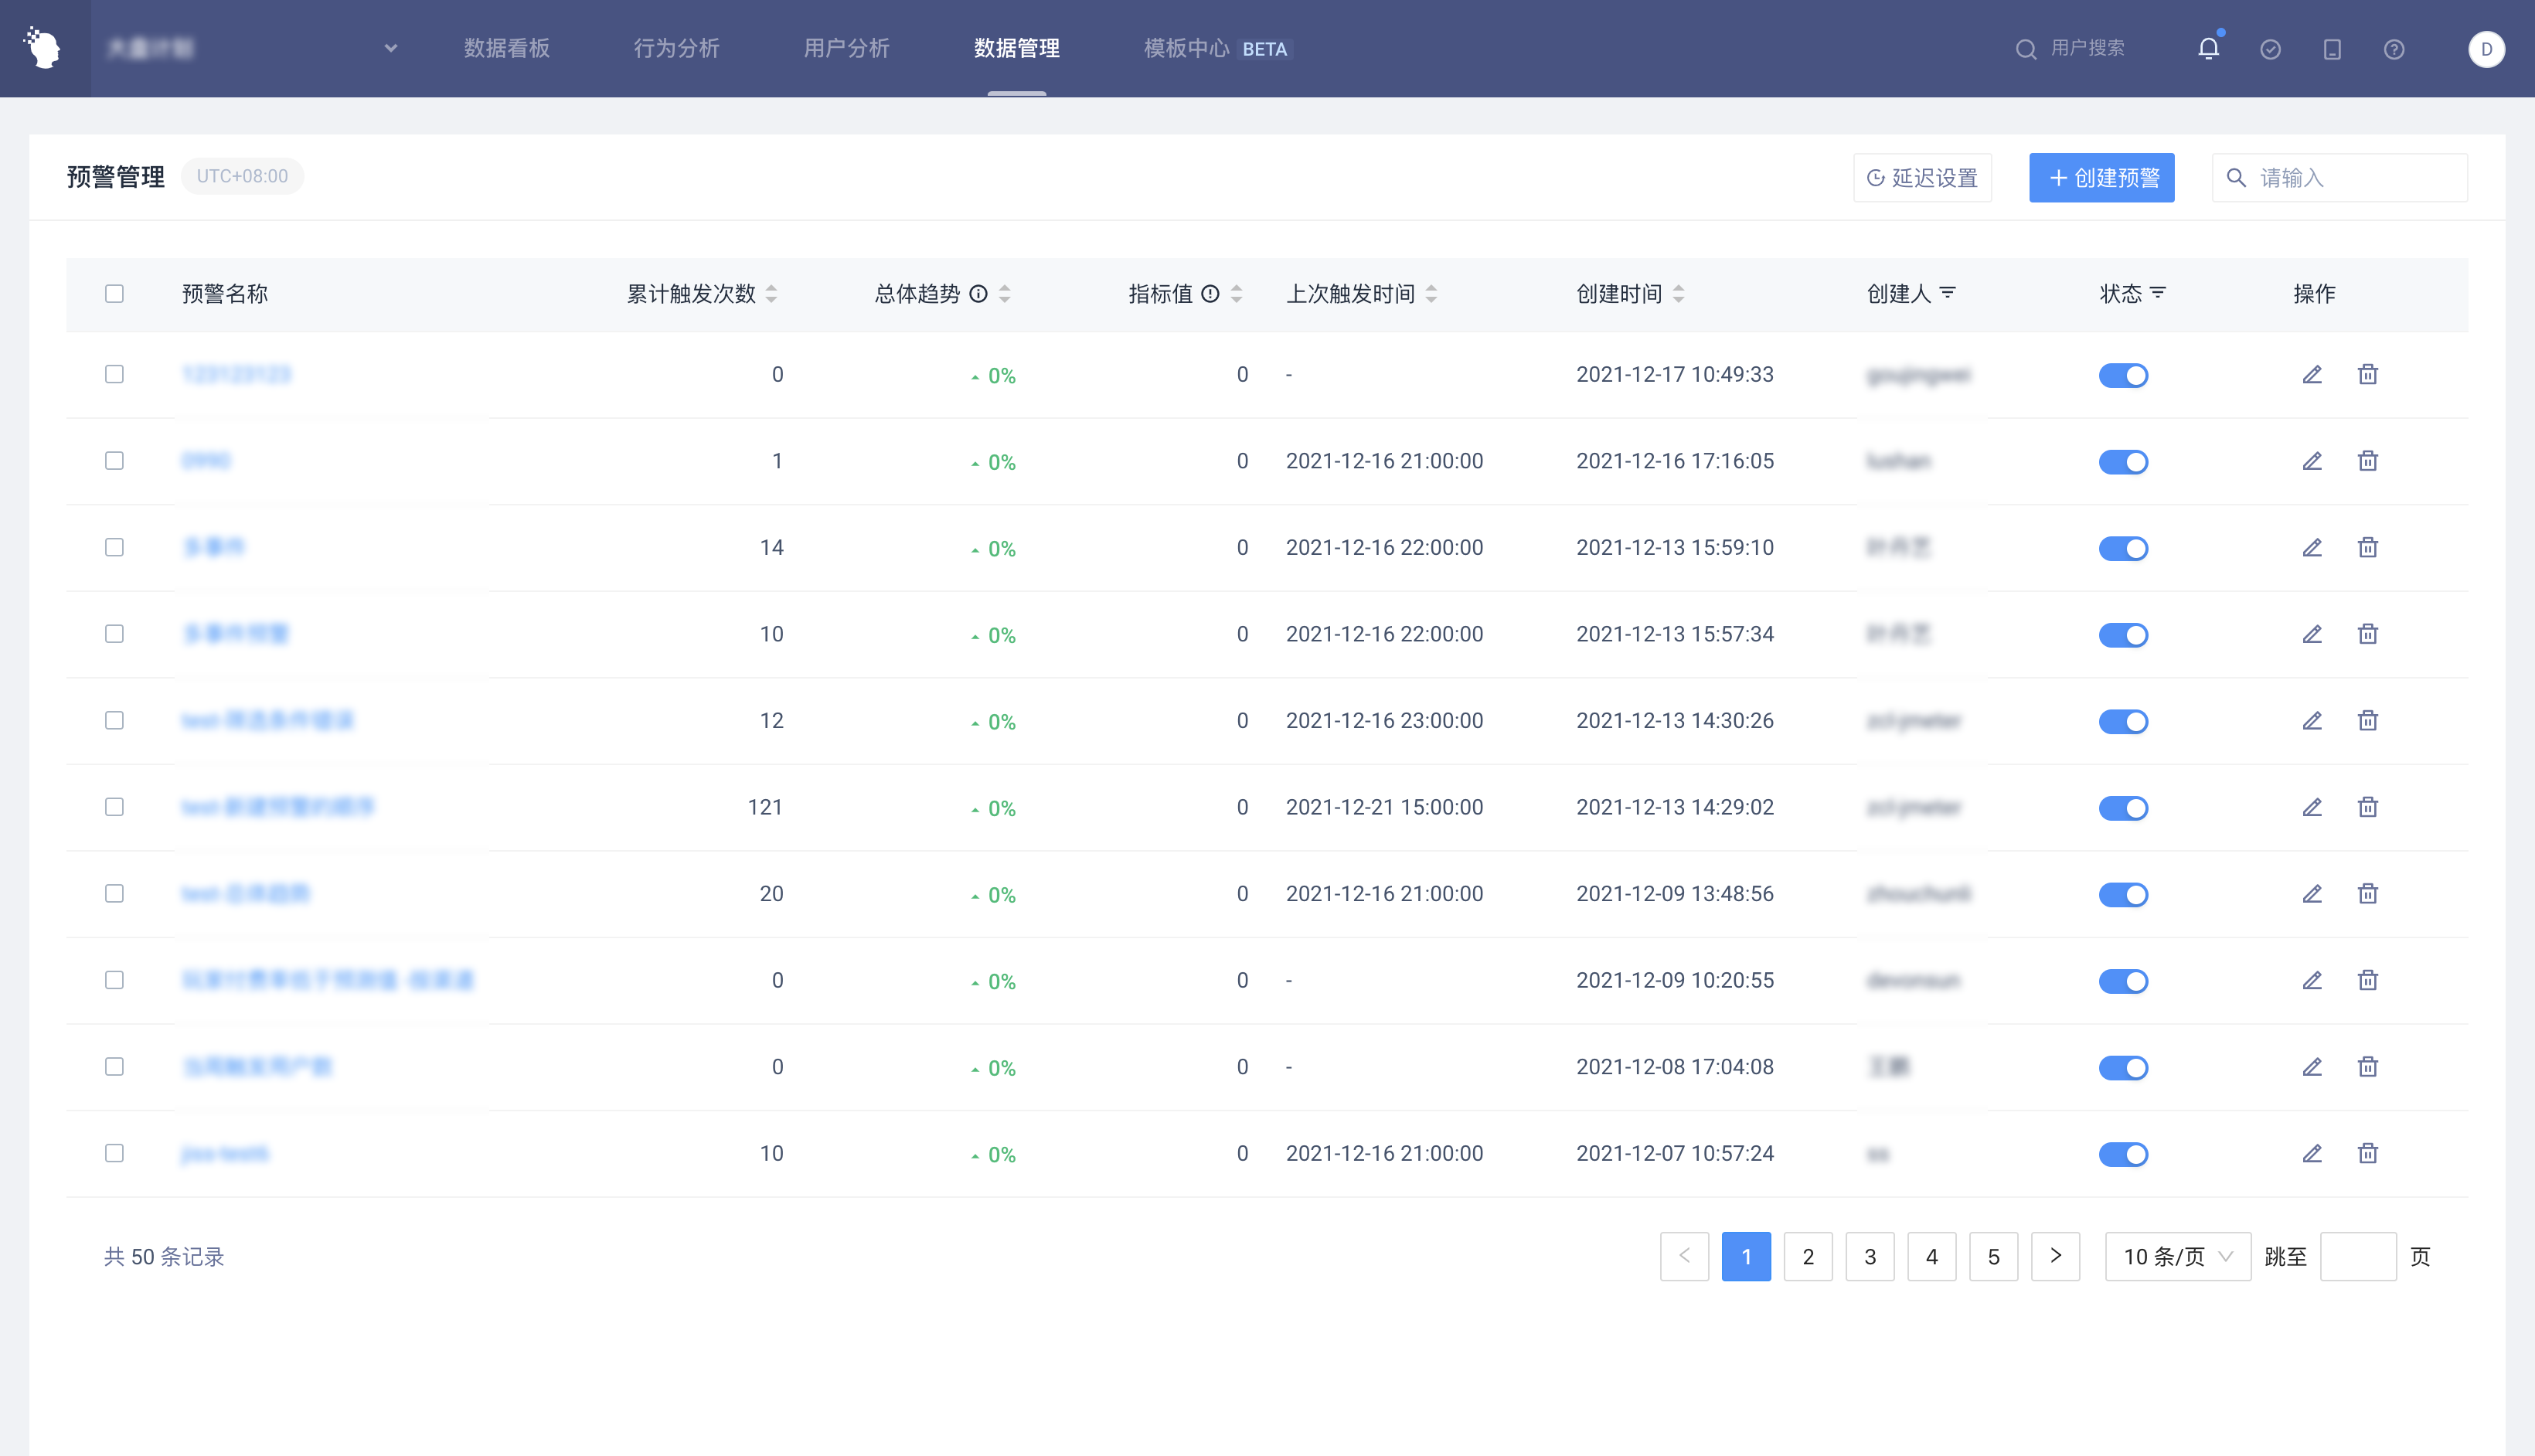
Alerts tasks in projects can be managed comprehensively.
- [Behavioral Analysis-Event Analysis]
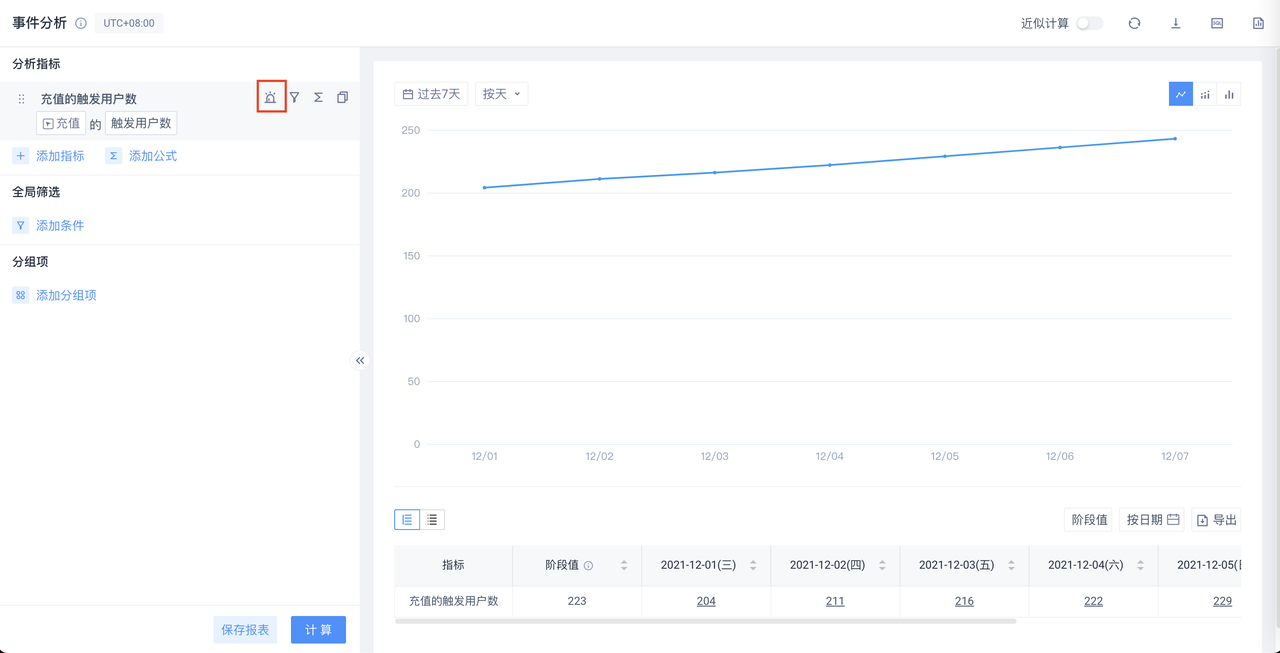
Alerts tasks can be quickly created for relevant indicators in daily analysis.
# 2.2 Applicable Roles
| Corporate Supervisor | Administrator | Analyst | Ordinary member | |
|---|---|---|---|---|
| View the list of Alerts | ● | ● | △ | ○ |
| Add, edit and delete self-built Alerts tasks | ● | ● | △ | ○ |
| Edit and delete other people's Alerts tasks | ● | ● | △ | ○ |
Permission description:
● Role must have
▲ The role has the permission by default, but can revoke
△ The role is not available by default, but can be authorized
○ Role must not have
# III. Operate Methods of Early Alerts
# 3.1 Alerts Page
# 3.1.1 Alerts Task Configuration
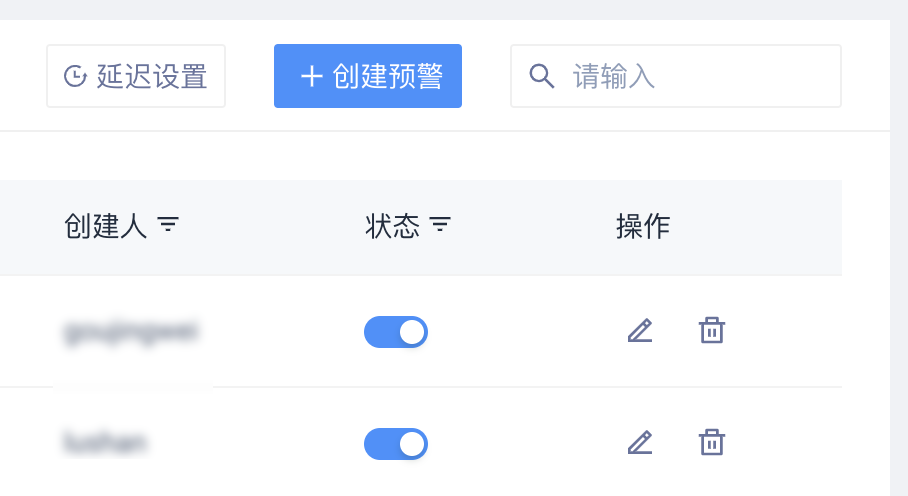
Administrators and above roles can open the configuration task pop-up window through 'Create Waring' in the 'Alerts' page
# 3.1.2 Limitation of Alerts Missions
You can configure up to 50 tasks in a project. When there are more than 50 tasks, you cannot save.
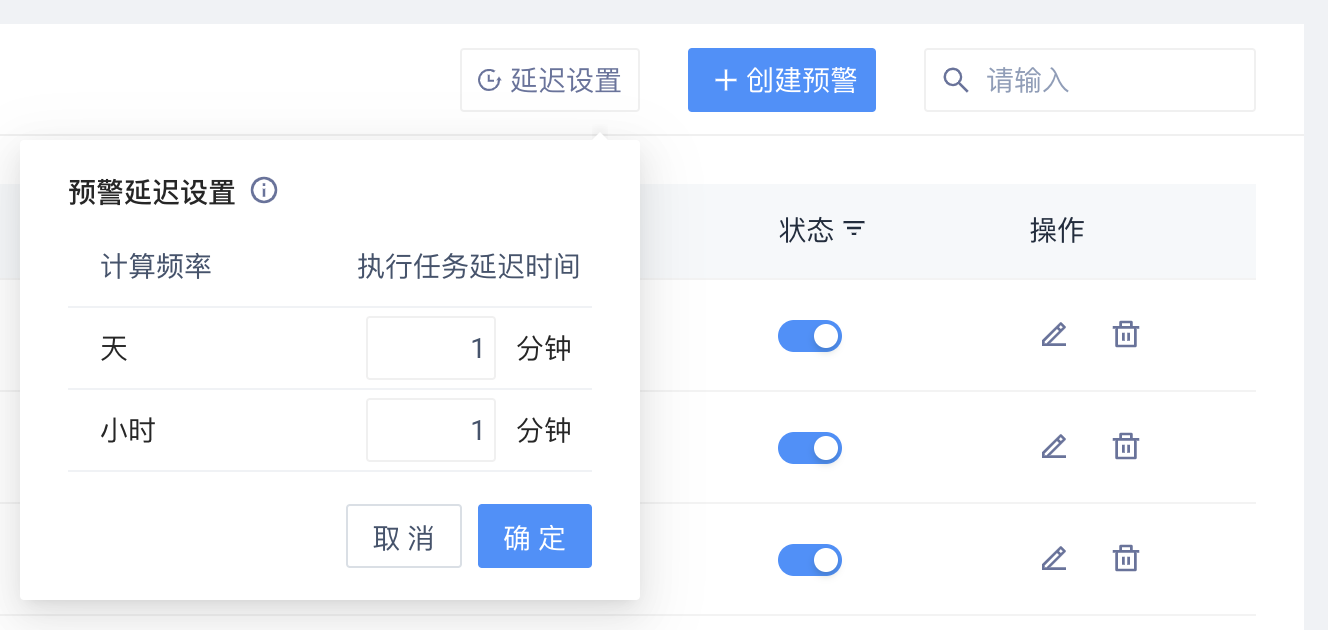
# 3.1.3 Alerts Delay Configuration
When calculating the Alerts, the transmission delay is considered. Reserved buffer period, buffer period can be set in the project configuration
The default is 120 minutes for day level and 20 minutes for hour level. The input box is limited to integers from 1 to 999.
# 3.2 Alerts Configuration Page
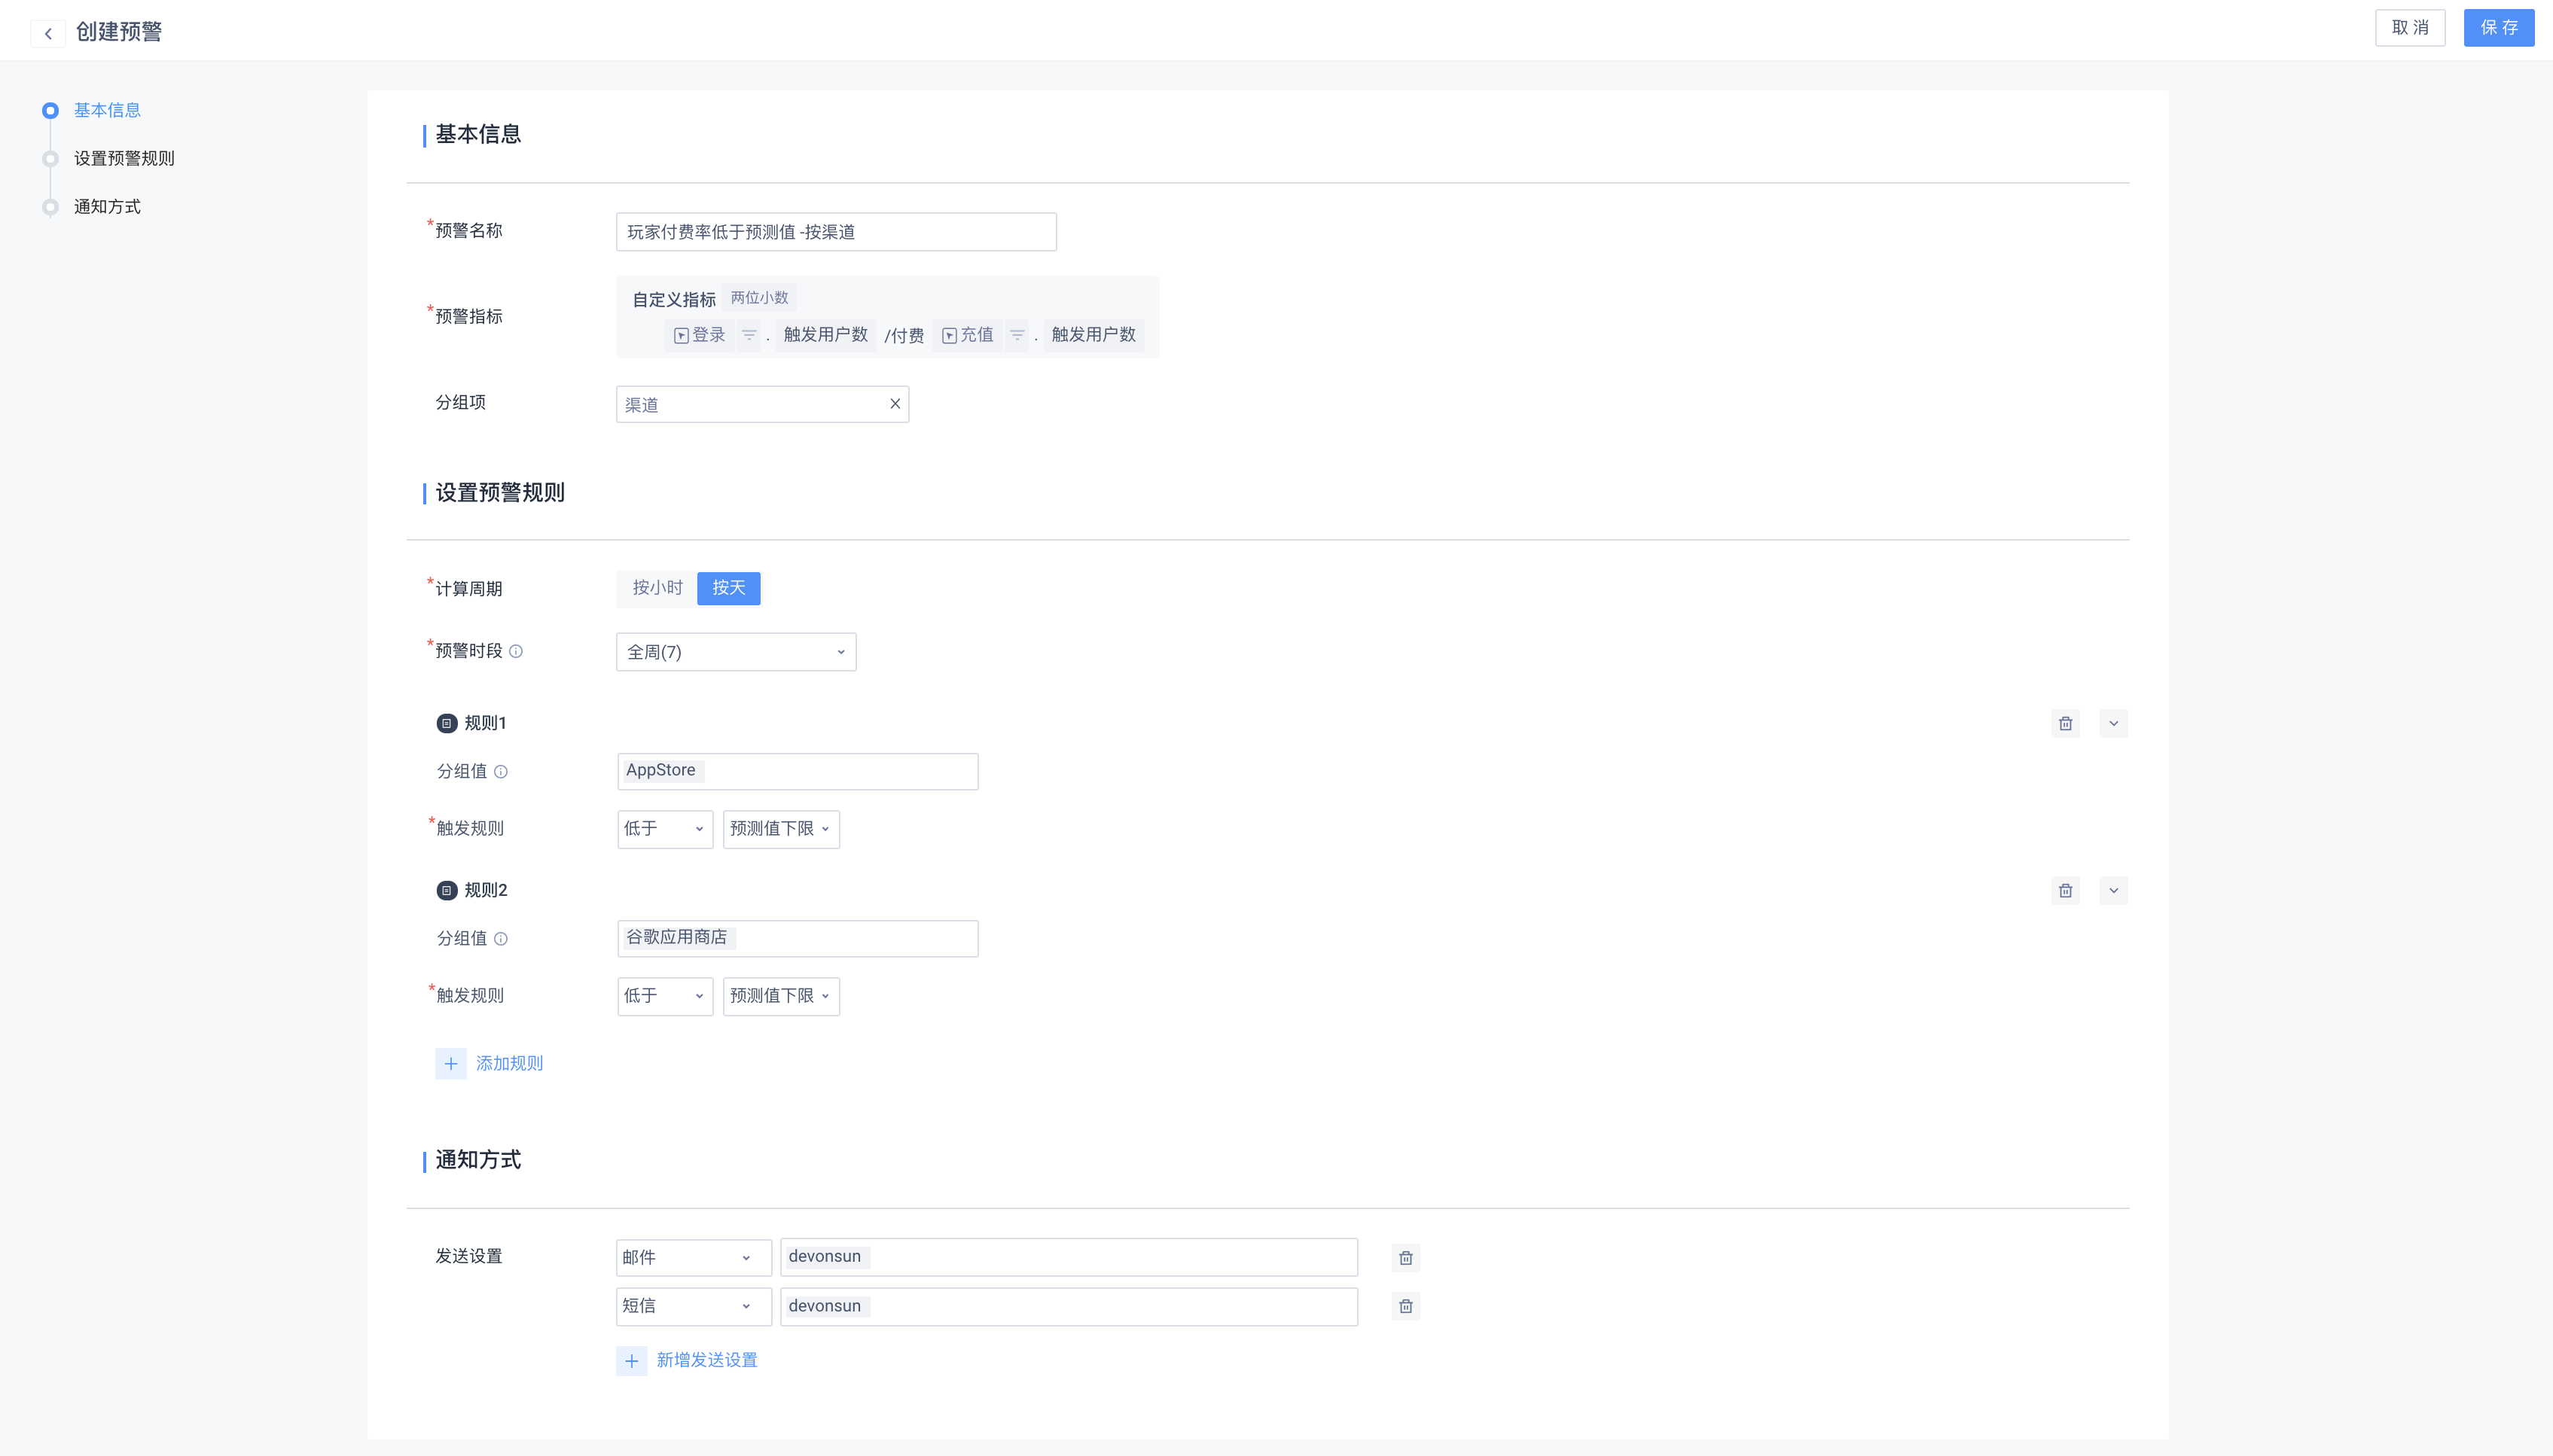
# 3.2.1 Basic Information
Alerts** Name**
You can enter up to 24 characters and cannot duplicate names.
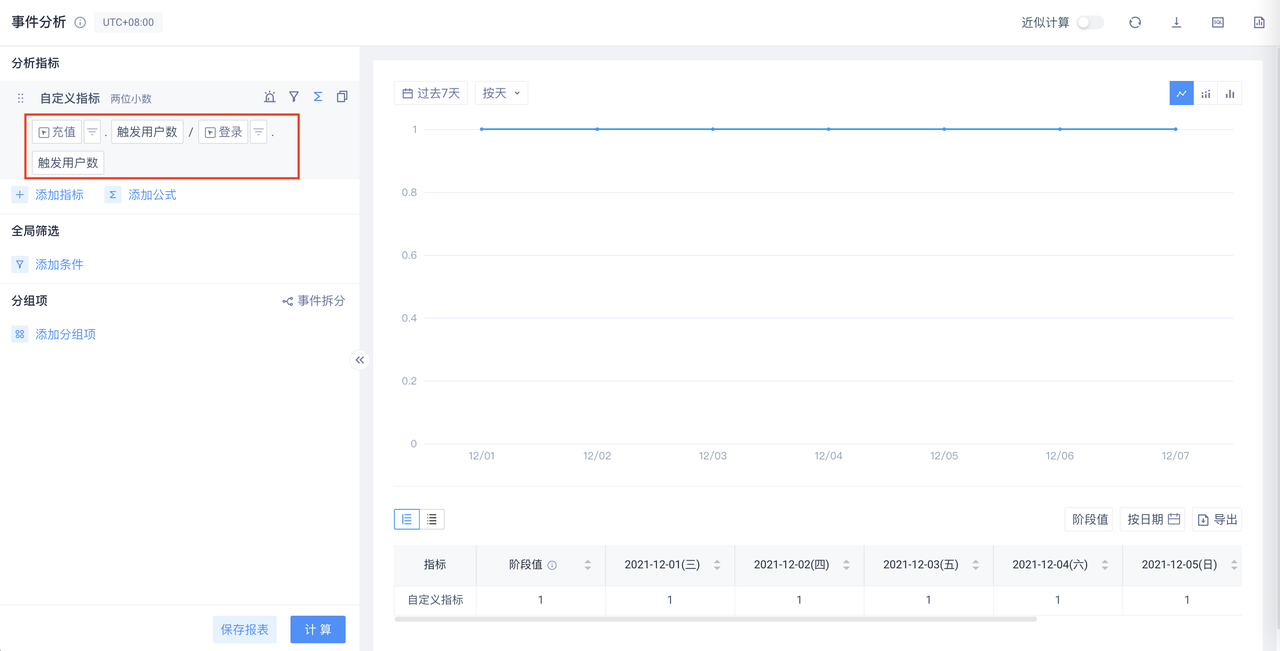
Alerts** Indicators**
You can choose a certain analysis angle of an event as an Alerts monitoring object.
Edit Formula
Alerts of indicators that require formula editing to create.
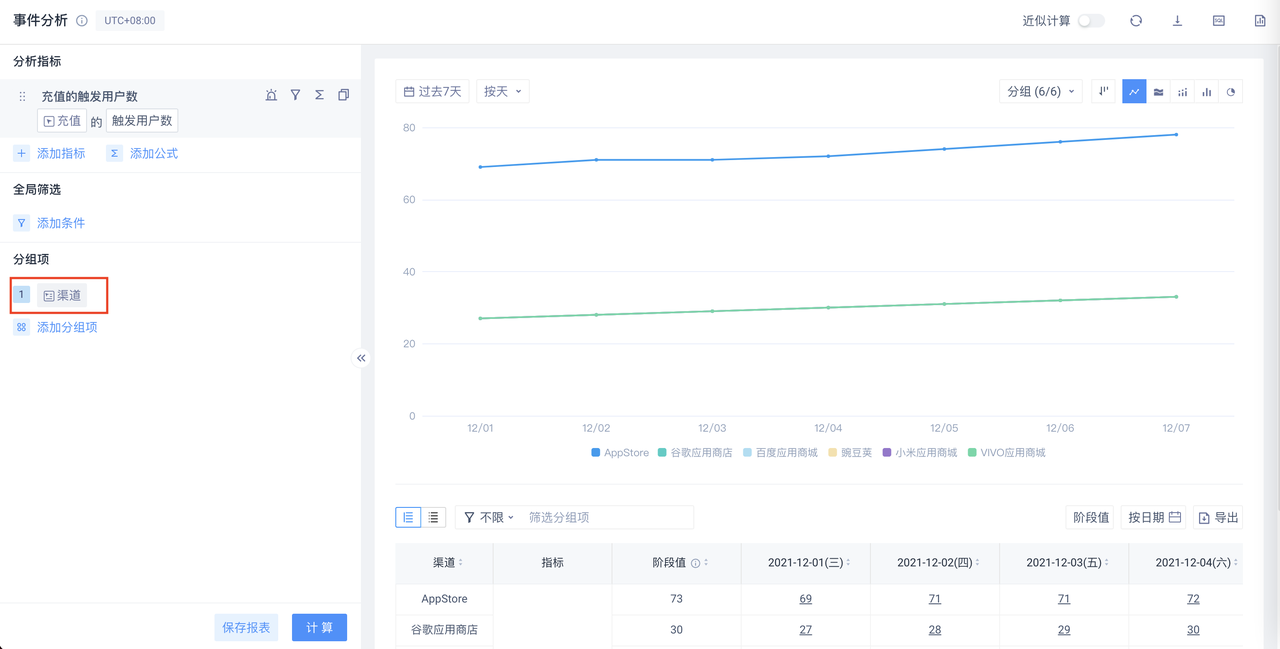
Group Item
Demand scenarios grouped by different events/user attributes address the same event indicators.
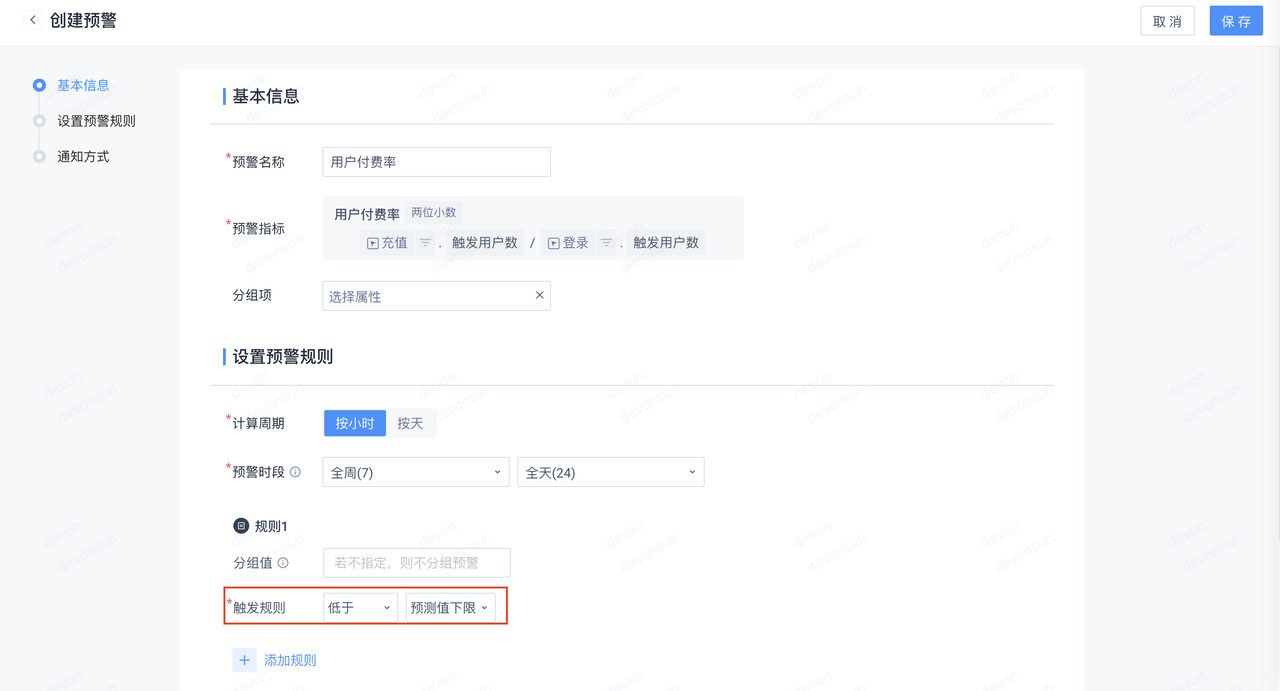
# 3.2.2 Alerts Rules
Calculation period
You can select either 'by hour' or 'by day' as the criterion, which is associated with the trigger rule in the alarm rule.
Alerts** period**
Select the time to time by hour, and the day of the week by day; the 'Alerts period' is applicable to the entire 'Alerts task'.
Alerts** rules**
Group value
When selecting a group value, you can set different Alerts trigger conditions for the batch group value.
Trigger rule
The trigger rules based on 'comparison method', 'calculation period' and 'compare with whom" are as follows:
| Compare with whom | Comparison method | Calculation period | Compare with whom (type) | What can compare |
|---|---|---|---|---|
| Fixed value | High/low | - | Fixed value | Value |
| Last day | High/low | By day | Period value | Value/percentage |
| Same time last week | High/low | By day | Period value | Value/percentage |
| 7-Day average | High/low | By day | Period value | Value/percentage |
| Last hour | High/low | By hour | Period value | Value/percentage |
| Same time yesterday | High/low | By hour | Period value | Value/percentage |
| 24-Hour average | High/low | By hour | Period value | Value/percentage |
| Predicted value | High | By hour/by day | Forecast upper limit | - |
| Predicted value | Low | By hour/by day | Forecast lower limit | - |
Predicted value
In the case of no need to master the specific business indicators, you can judge whether to trigger a Alerts based on the predicted value:
- When the indicator is above the upper limit of the predicted value
- When the indicator is below the lower limit of the predicted value
The algorithm of the prediction model adopts the Hannan-Rissanen algorithm, and the algorithm paper can refer to the doc (opens new window).
# 3.2.3 Notification Method
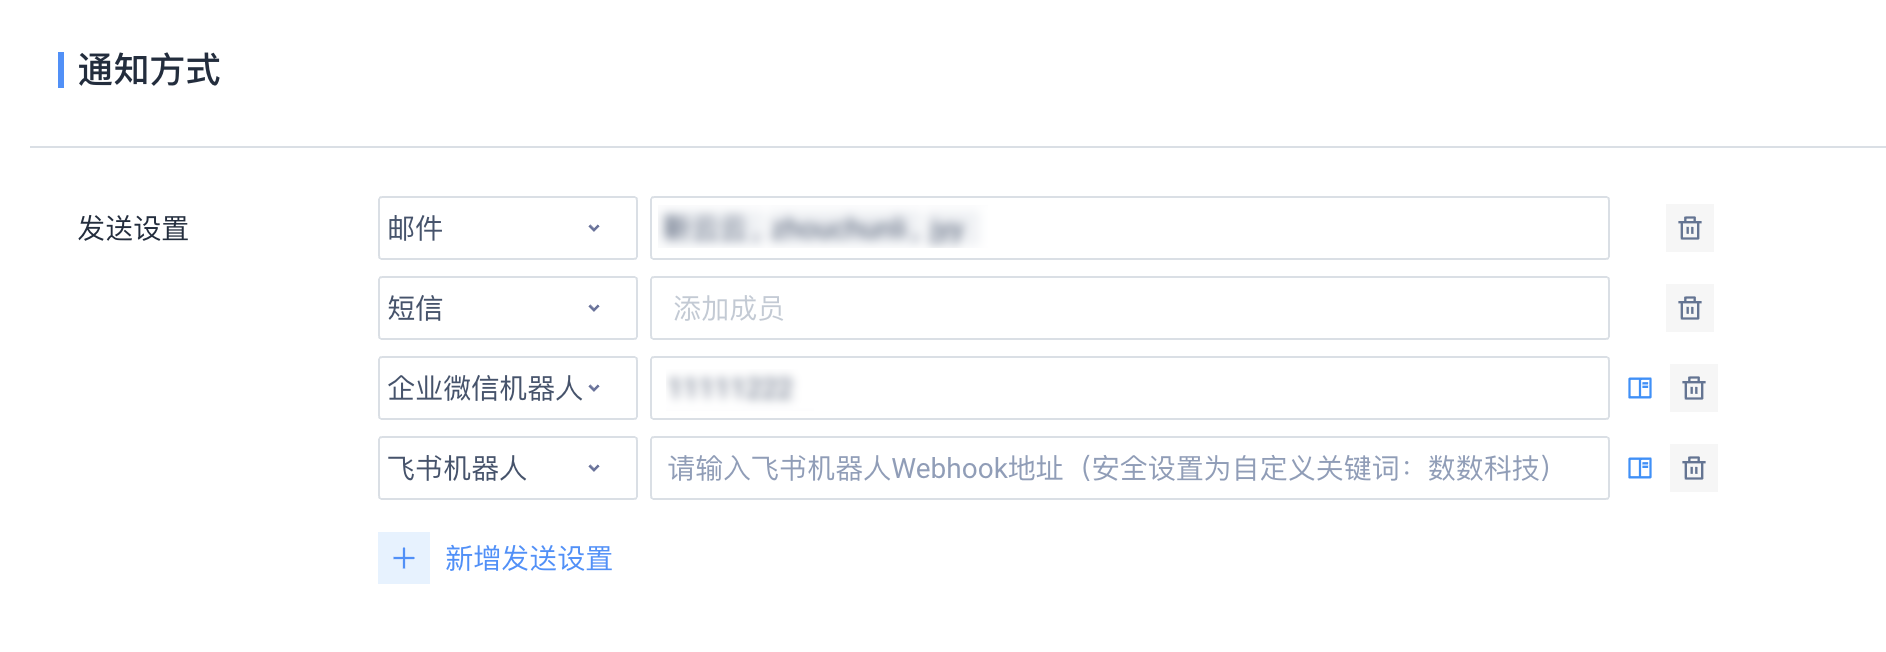
You can configure the members to be added in SMS and email separately
# 3.3 Alerts Details Page
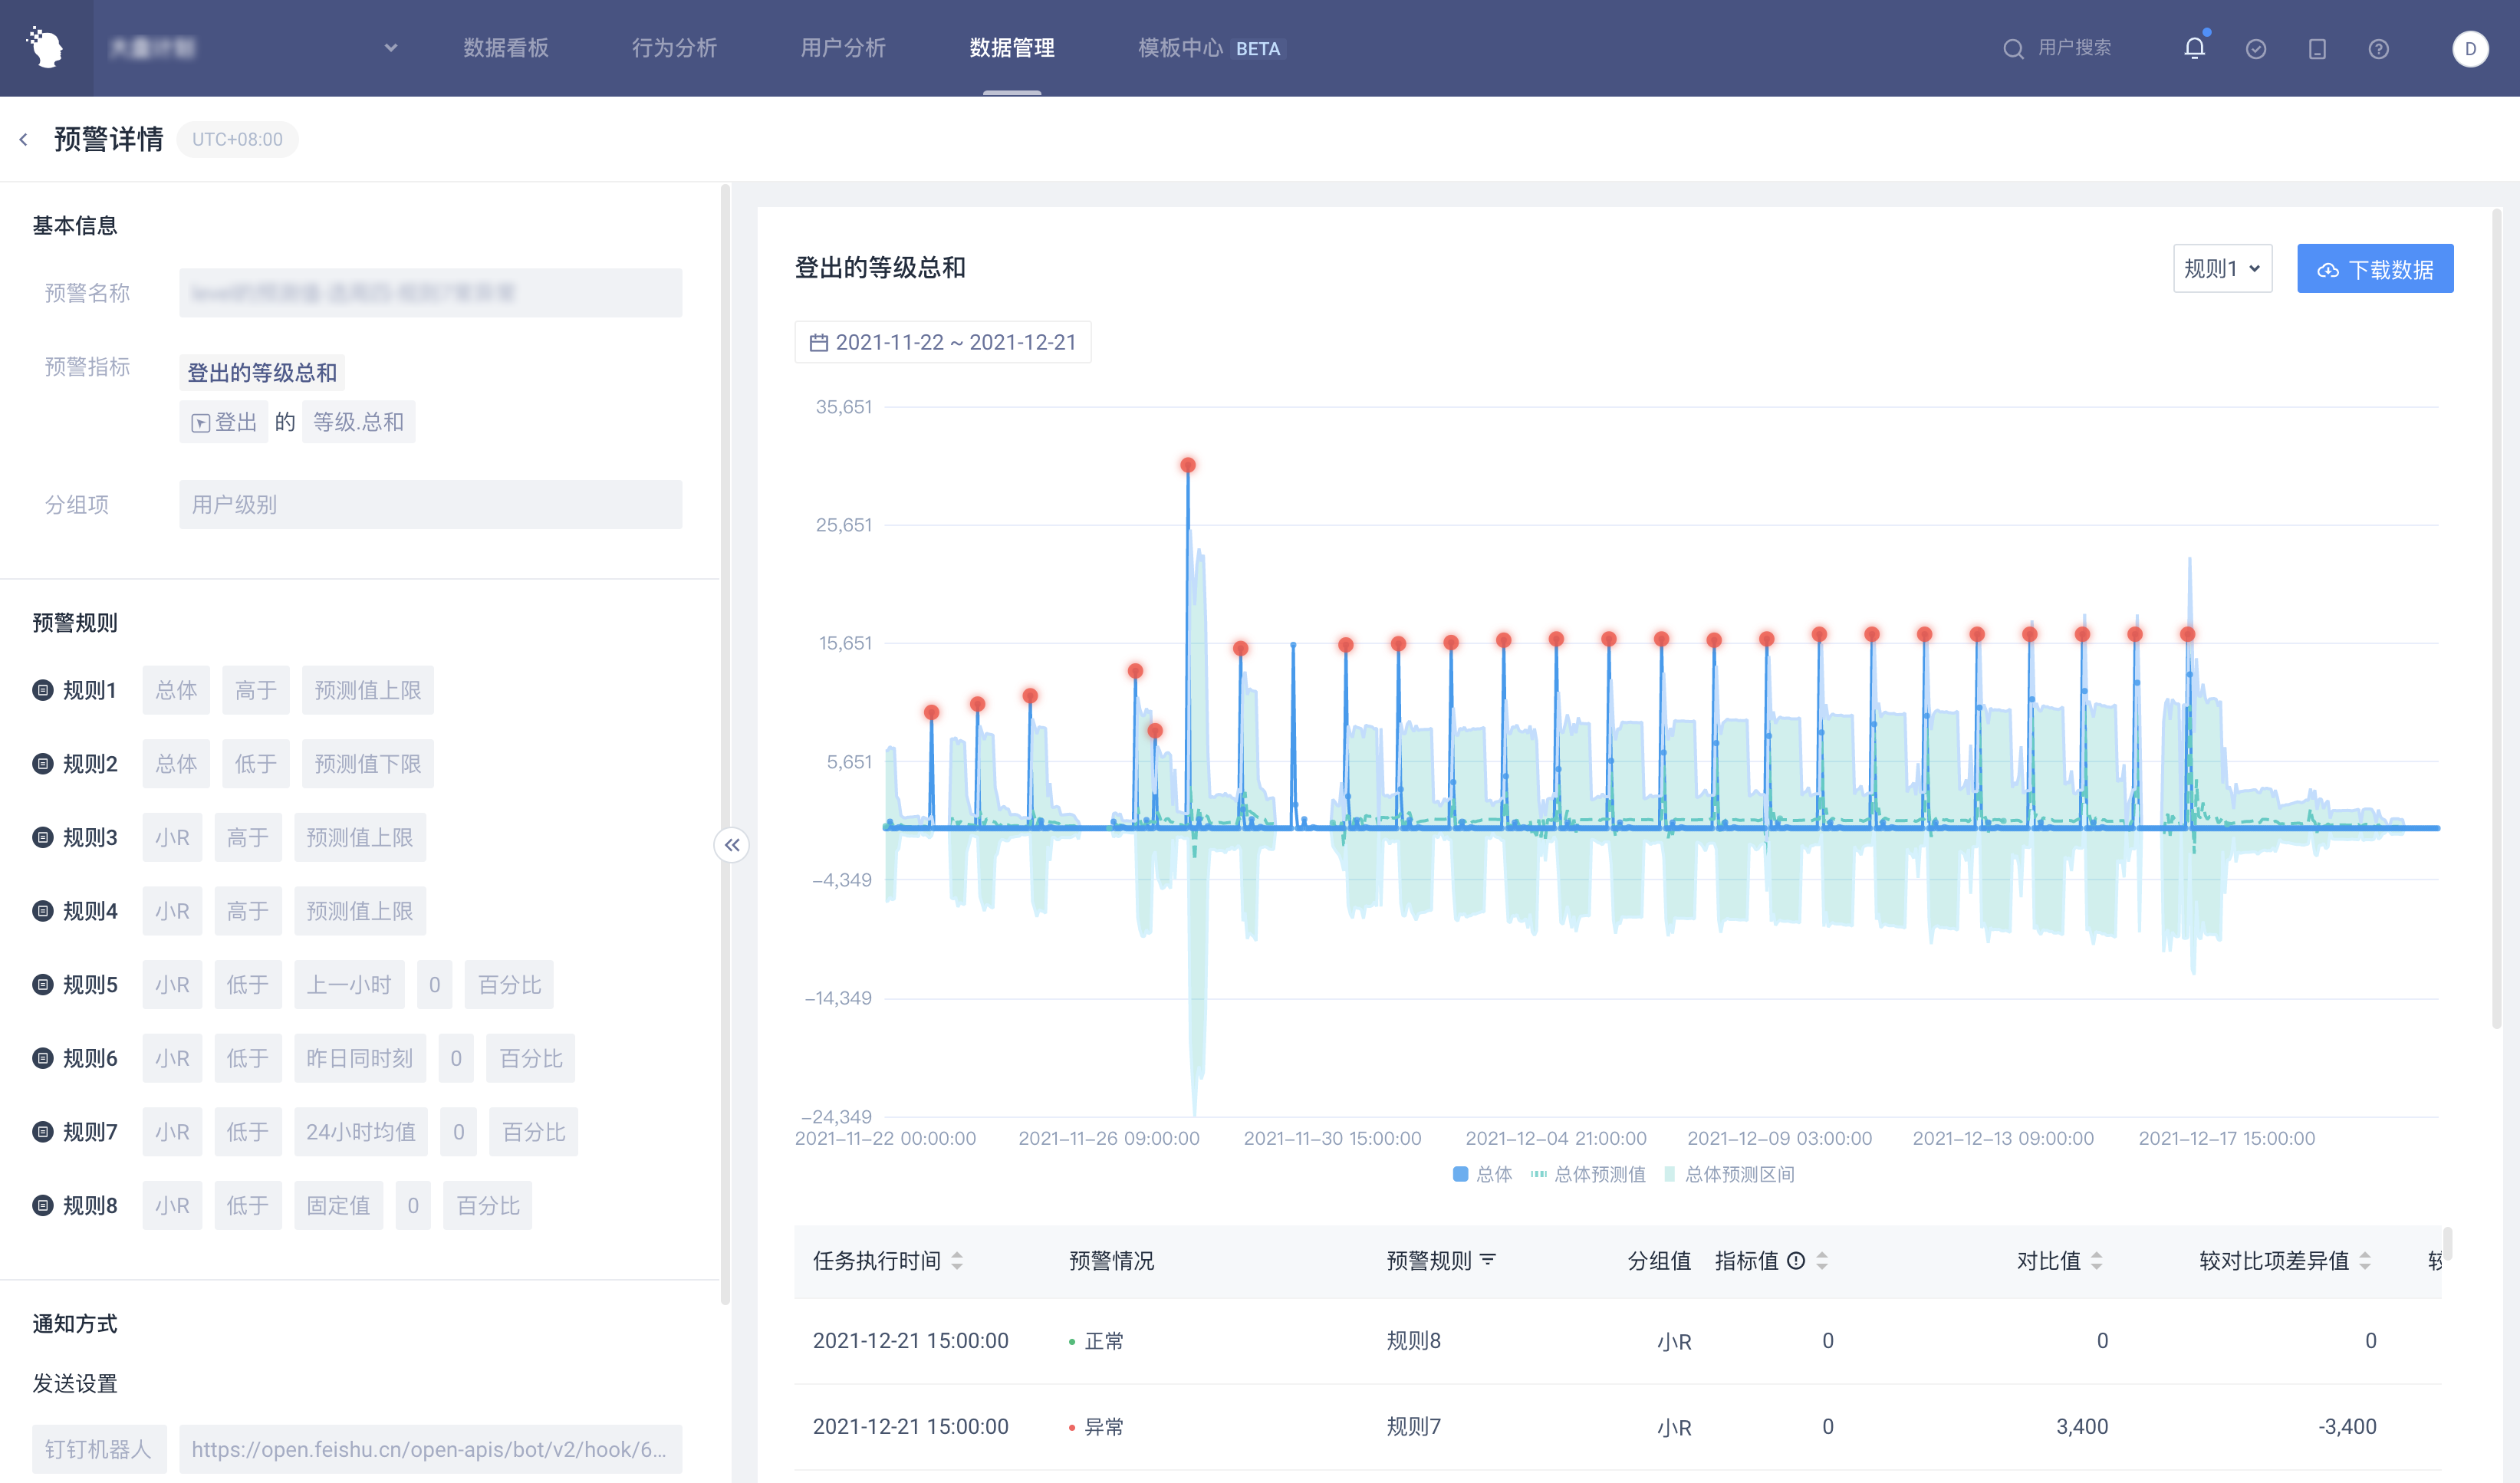
# 3.3.1 Alerts Task Setting
This part will be substituted into the settings of the Alerts task. Expansion can be folded and cannot be edited by default.
# 3.3.2 Display screening area
Time checkbox style
The time checkbox is the same as in event analysis.
Data recording range
For tasks by day, record data for the past year (up to 366 points), and display data for the past year when selected.
For hourly tasks, record data for nearly one year (up to 36,624 points) and display data for up to one month (3124 points) when selecting. When the time frame is selected for more than 31 days, only the results of the last 31 days of the frame will be displayed.
Predicted value legend
- Indicator actual value y (dark blue solid line in the figure)
- Prediction curve yhat (light blue dotted line in the figure)
- Prediction interval yhat_upper-yhat_lower (light blue area in the figure)
- Abnormal indicator point display (red dot in the figure)
Download data
- If the difference is negative, put a negative sign on it.
- Different rules correspond to Alerts under different group conditions.
- The Alerts situation is indicated by either "normal" or 'abnormal'.
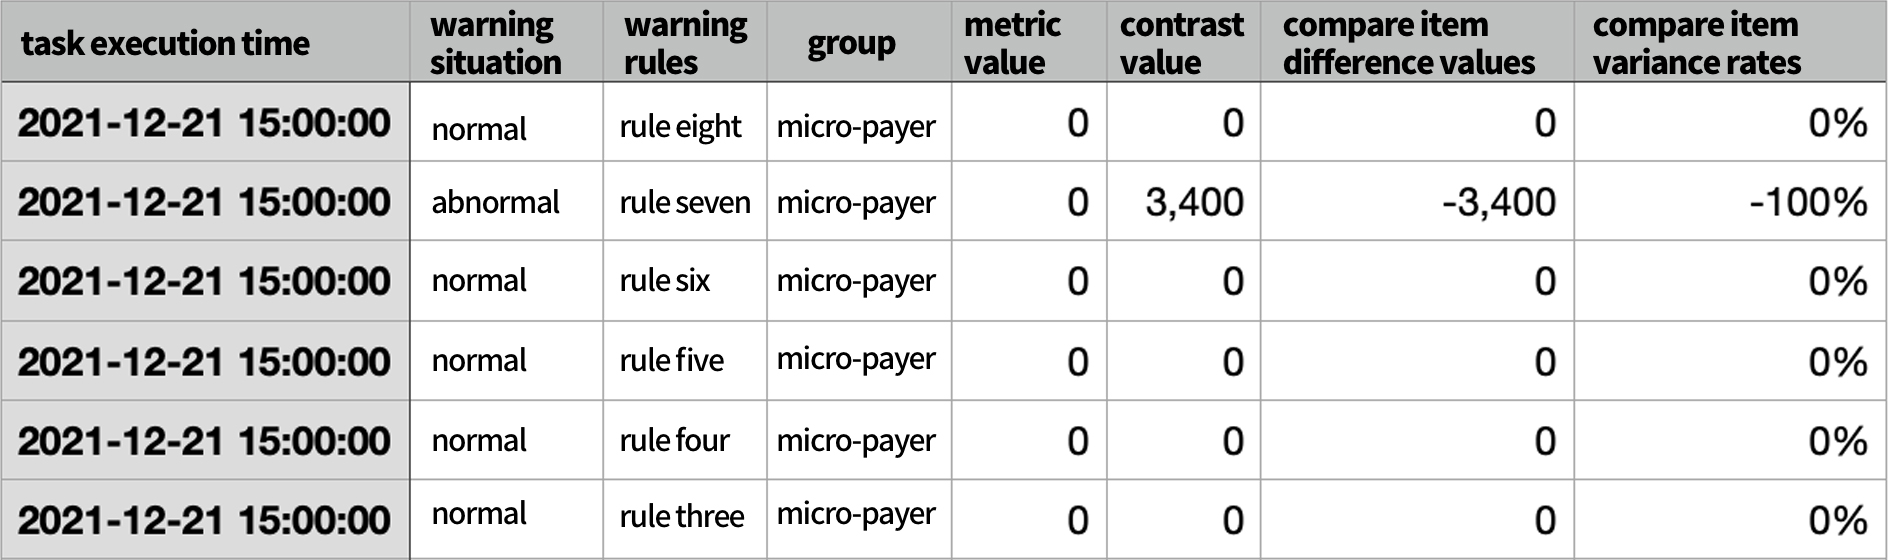
# 3.3.3 Form Details Area
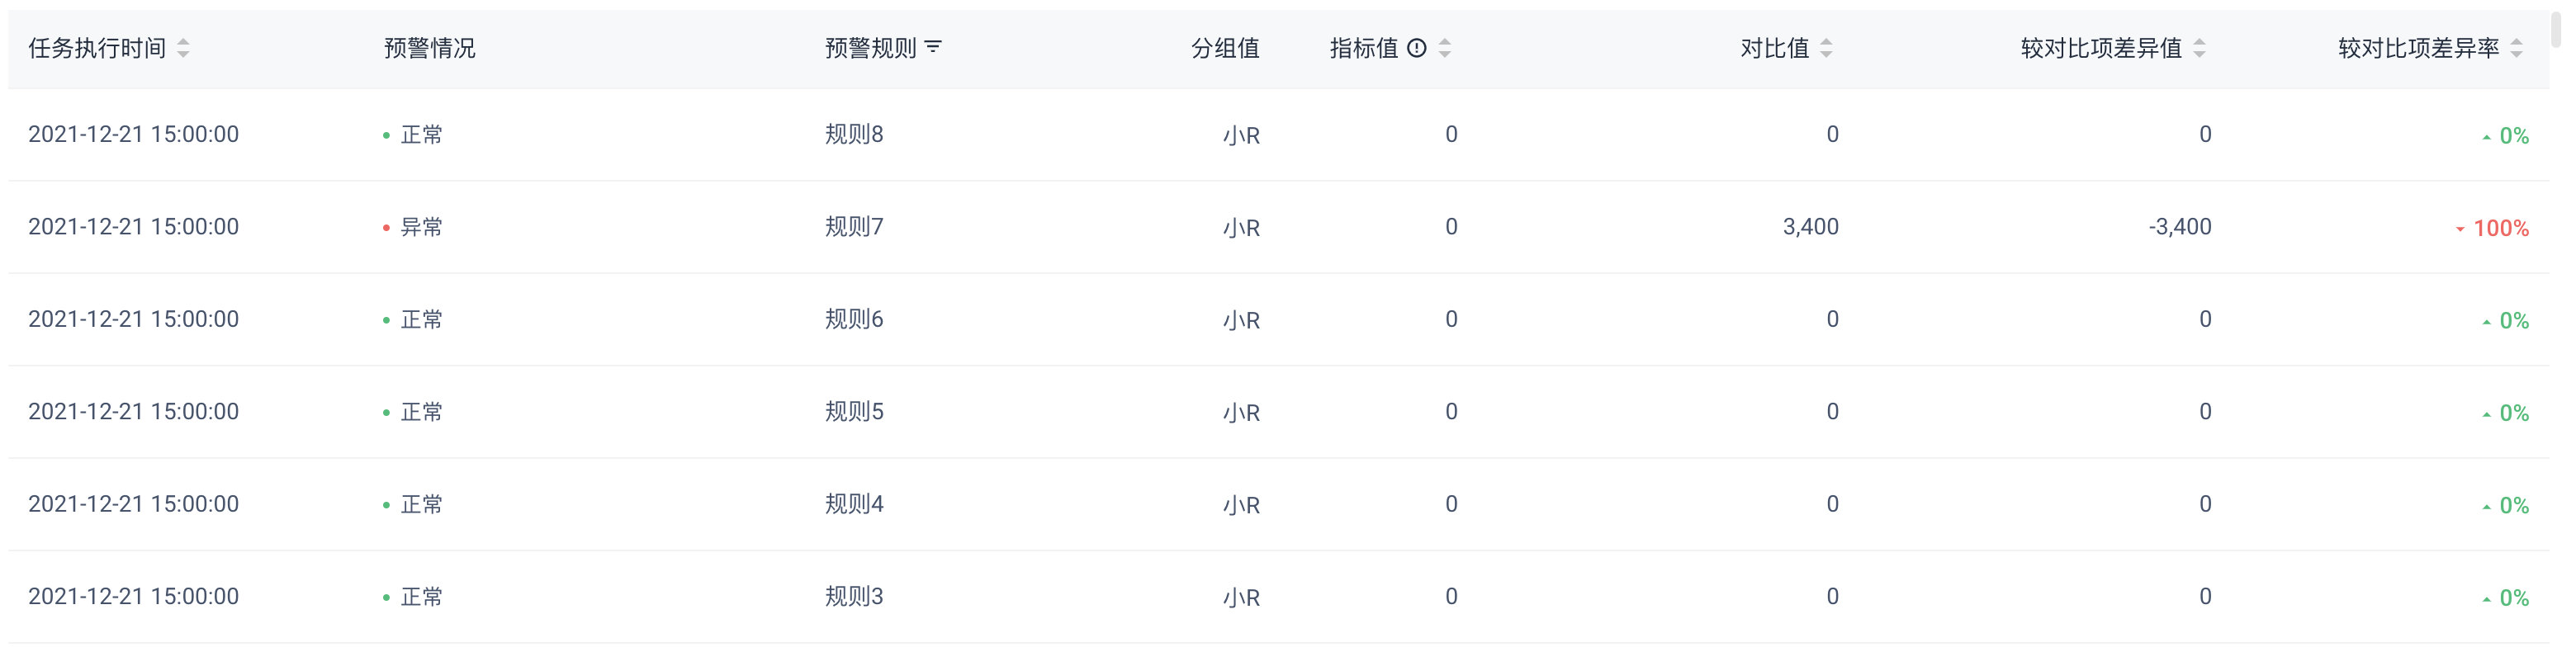
- Time: Running time of Alerts task, in order of time in table
- Alerts Rules: Rules for the left-hand Alerts task setting area
- Alerts situation: Normal or abnormal; If the prompt 'too few samples of forecast value' indicates that the data point is less than 10 and no forecast value calculation has been carried out.