# User Tags
# I.The Significance of User Tags
User tags are a collection of people with a certain series of characteristics, and tag values are a collection of "a group of similar people". The population can be easily structured through tags and tag values.
For example, the user label is "paid user", and there are three groups with label values of "big R", "middle R" and "small R" under the label.
Through a certain way of creation, users with similar features are summarized according to characteristic values to form labels, which is convenient for subdivision analysis in various models; at the same time, labels can be added in the kanban, making daily data monitoring more convenient
- Multiple creation methods for deeper client based drill-down analysis
- Multiple similar people in the same dimension form labels, and each group serves as a label value to realize the connection between related groups
- Tags can create historical versions (backups) of different dates, and you can see how the number of users with different tag values changes with the date
- Tags can switch between different analysis subjects, corresponding to different calculation logic and analysis scenarios
# II. Location and Applicable Roles of User Tags
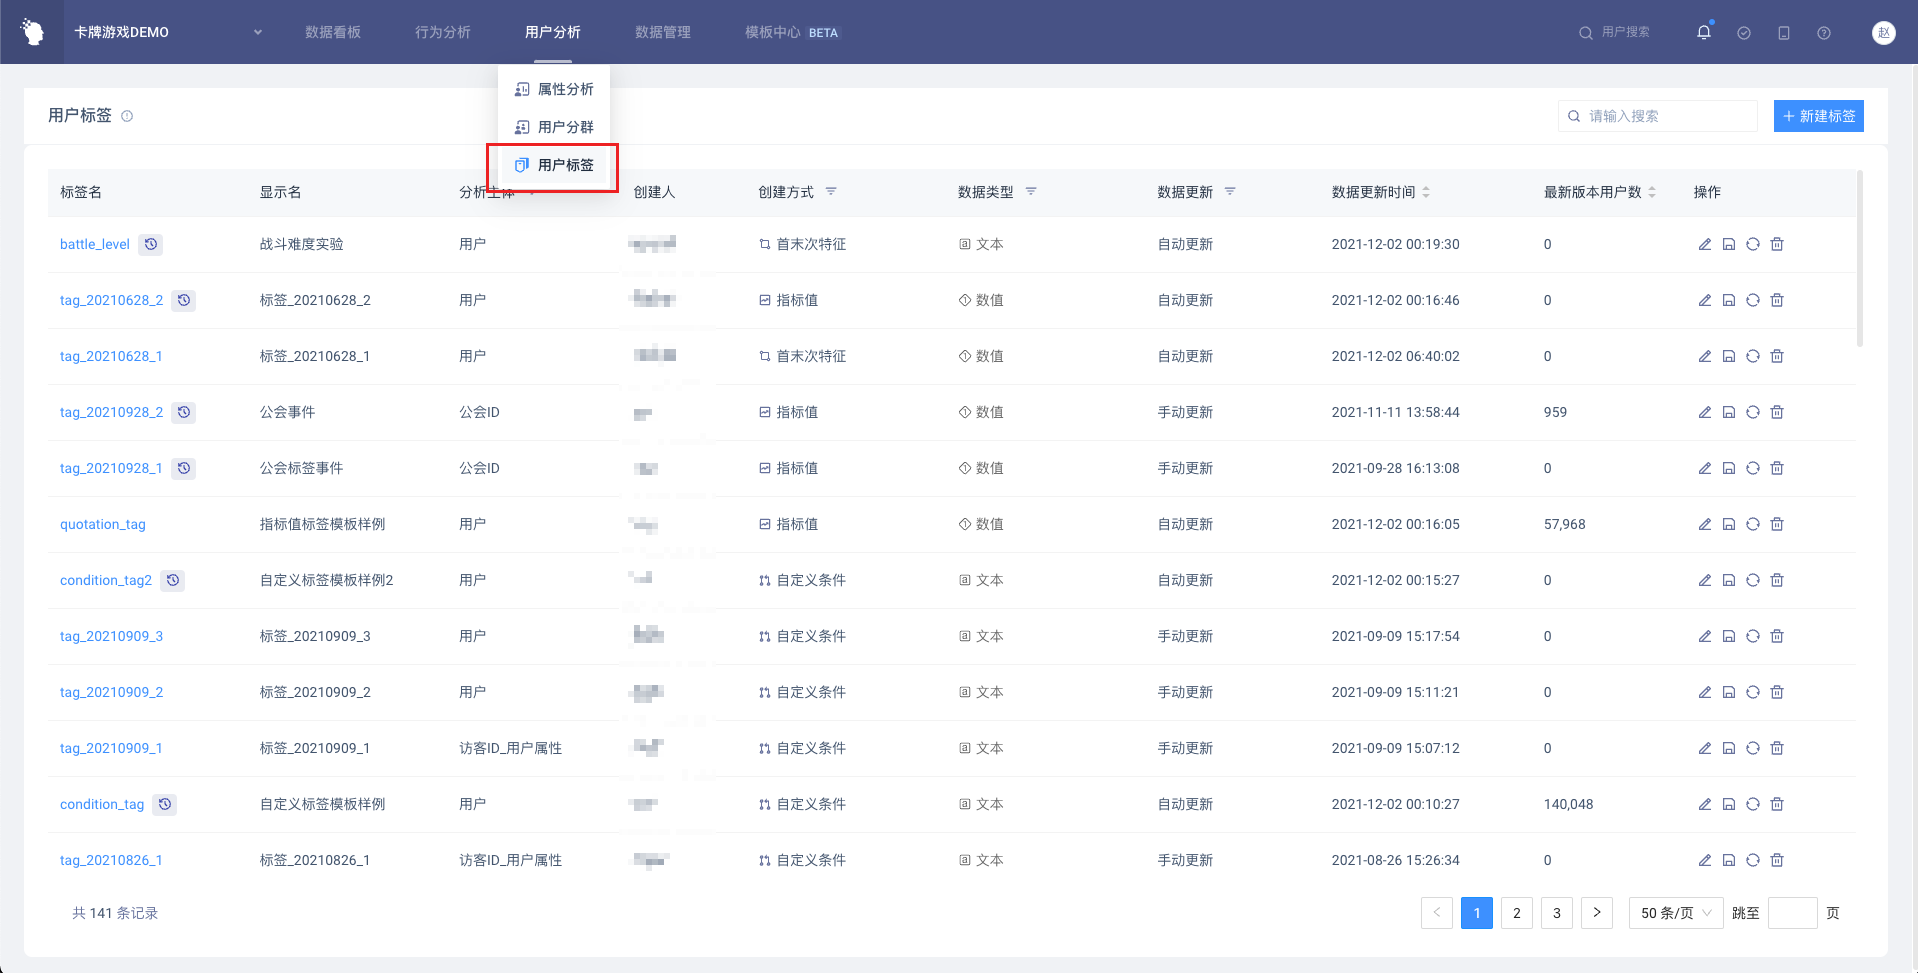
Users with user tag viewing permissions enter from "User Analysis - User Tag" to set user tags
| Company supervisor | Administrator | Analyst | Ordinary members | |
|---|---|---|---|---|
| View label list | ● | ● | ● | ○ |
| Add, edit and delete self-built tags | ● | ● | △ | ○ |
| Edit and delete other people's tags | ● | ○ | ○ | ○ |
Permission description:
● Role must have
▲ The role has the permission by default, but can revoke
△ The role is not available by default, but can be authorized
○ Role must not have
# III. Overview of User Tags Page
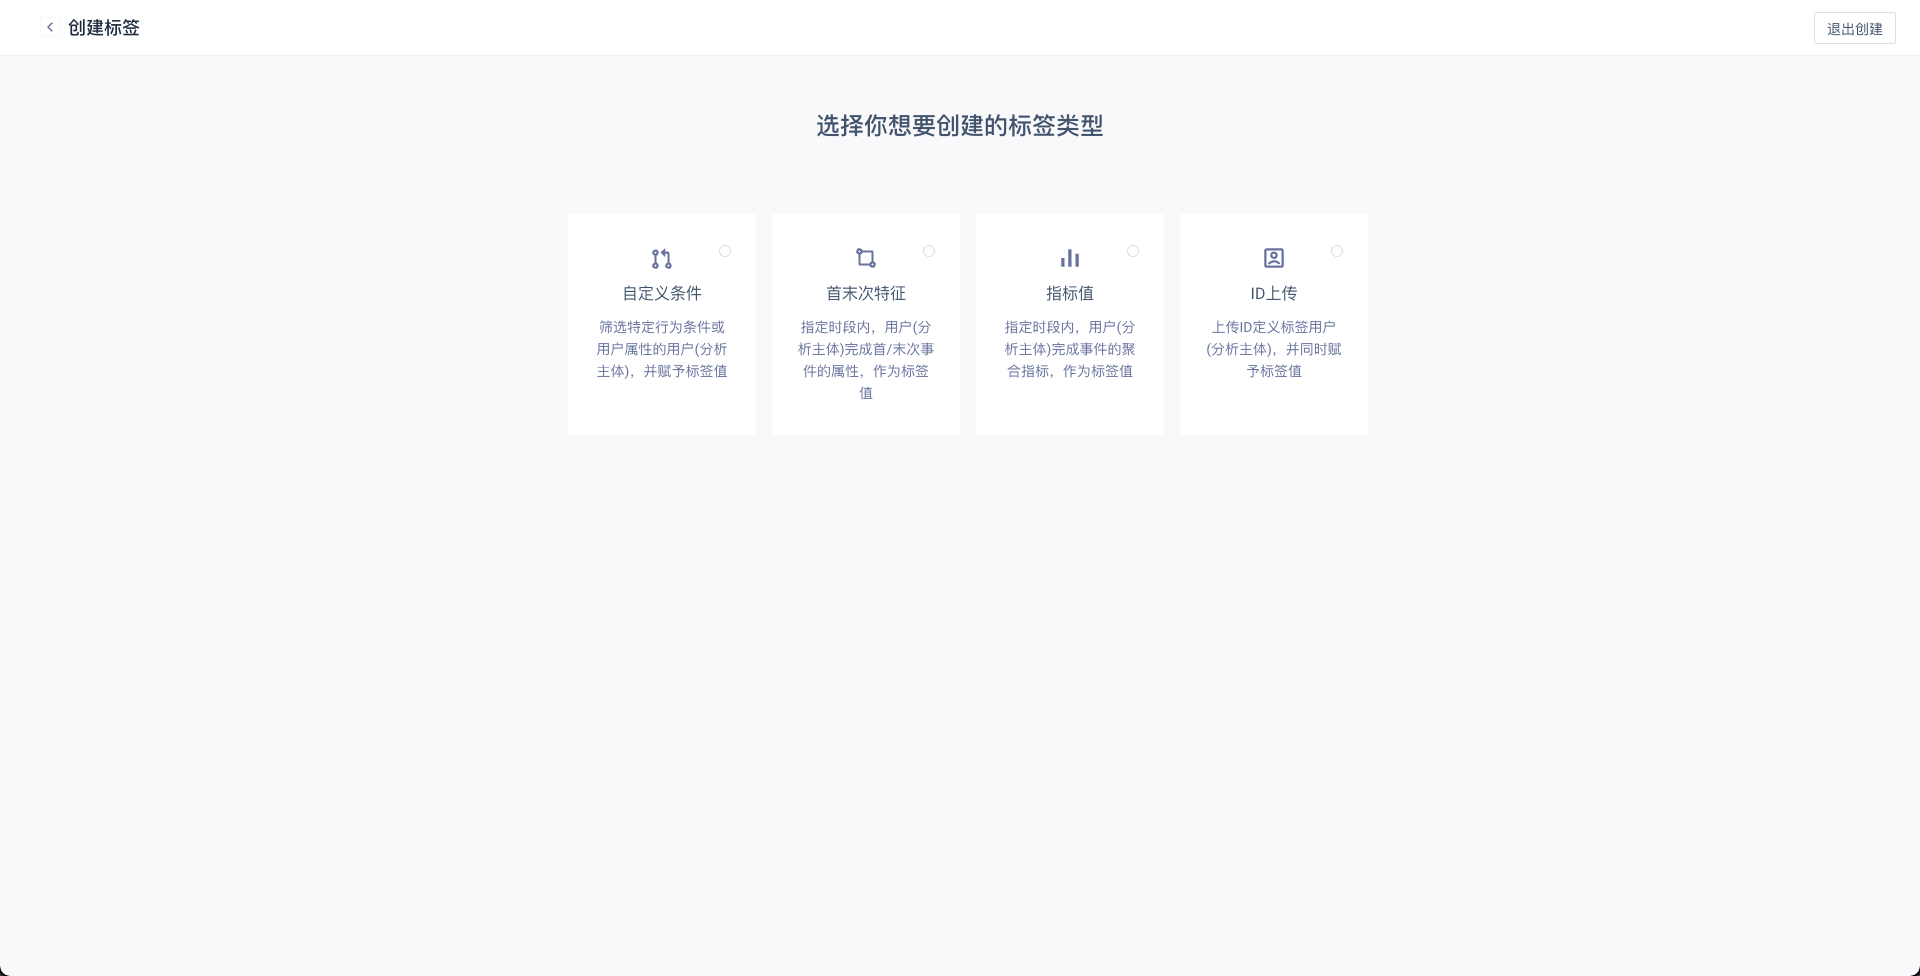
Click the '+ New Label' button to select a tag type.
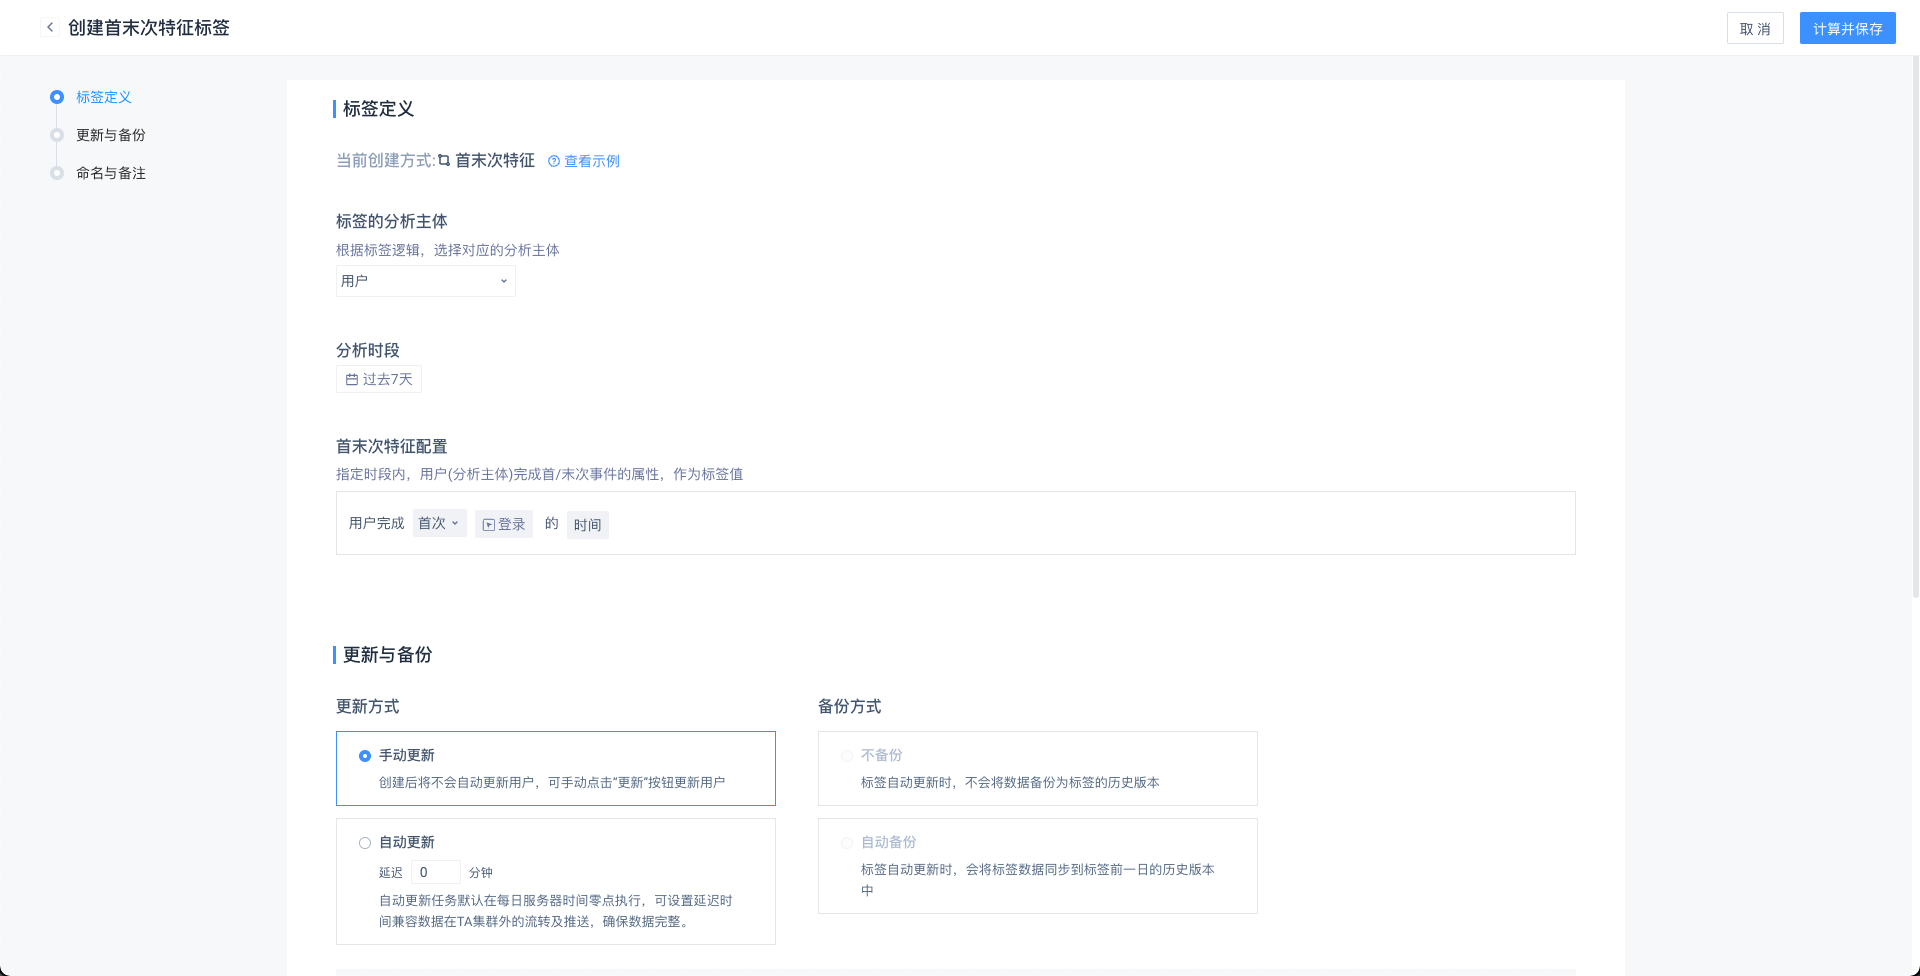
Complete the entire tag creation process.
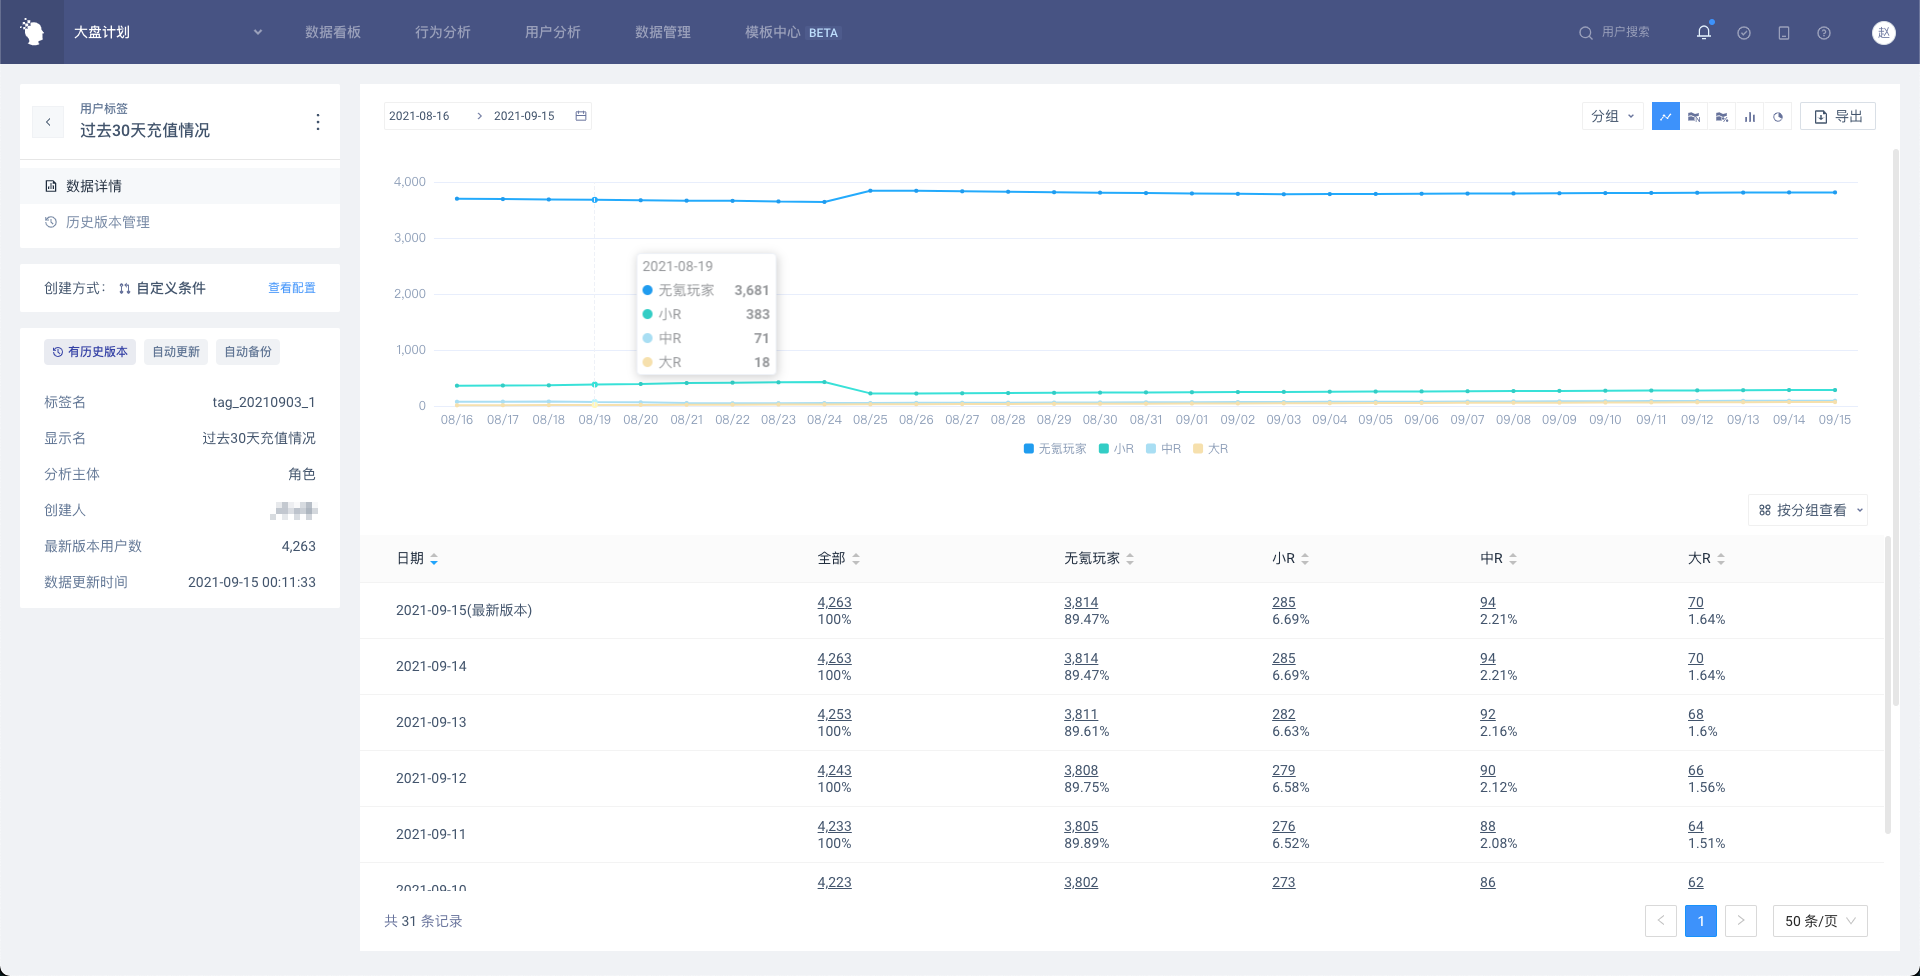
View the tags of different users.
Use tags in model filter and group item view.
# IV. Usage of User Tags
# 4.1 User Tags and Tag Values
User tags are a set of 'multiple groups of similar people in the same dimension' and tag values are a set of 'a group of similar people'.
For example, the user tag is 'paid user', and there are three groups with tag values of 'big R', 'middle R' and 'small R' under the tag.
Users belonging to a tag have and only have unique tag values. If a tag has a historical version, the user's label values in each historical version (each date) under the tag may be different.
# 4.2 Create User Tags
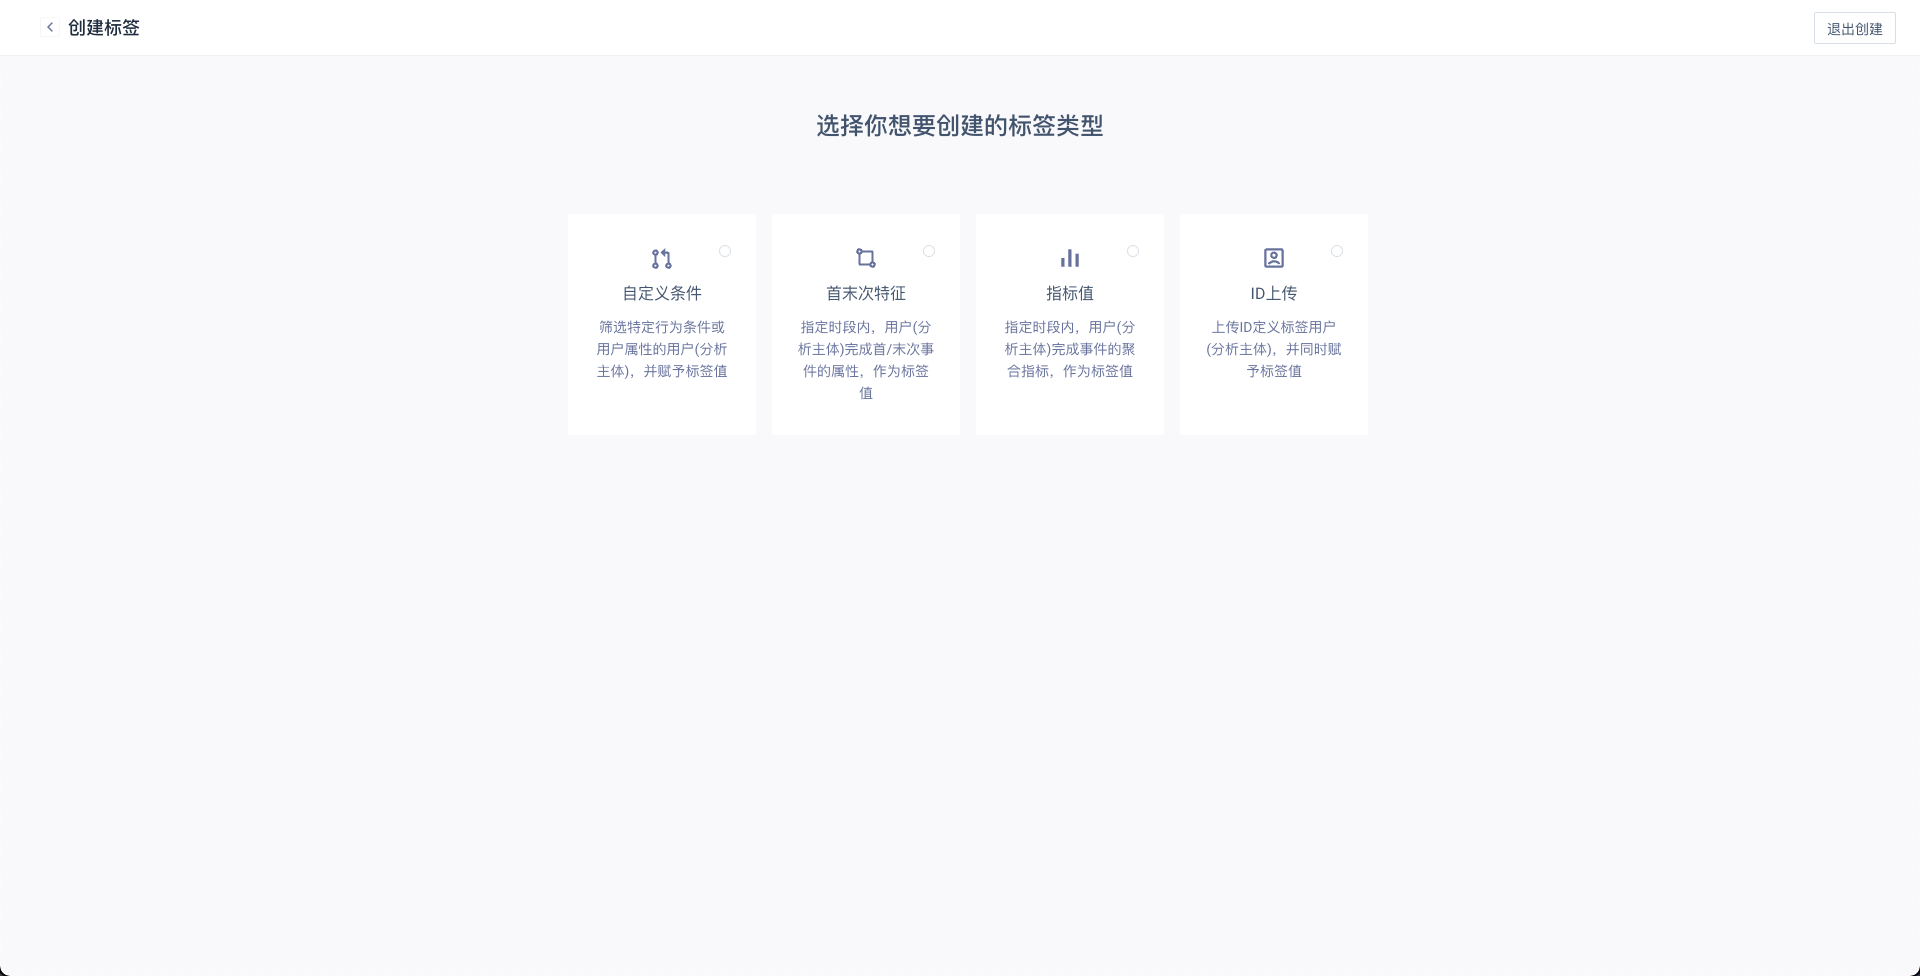
When creating a new tag, you can select one of the four tag types of 'Custom Conditions', 'ID Upload', 'First and Last Features' and 'Indicator Value'. After selection, you can enter the specific creation configuration page.
# 4.2.1 Label Definition
For all tags, you need to select from the configured analysis subject first. By default, the preset analysis subject (TA user ID) is selected; after the tag is created, the analysis subject cannot be modified.
(1) Custom Conditions
Filter users with specific behavior conditions or user features and assign tag values; Users are preferentially matched to tag values that meet the conditions and are in the first order.
For example, a 'paid user tag' can be created, and users can be divided into high-consumption users, medium-consumption users and low-consumption users through custom conditions. Later, the tag can be used as a group item and three types of users can be analyzed at the same time.
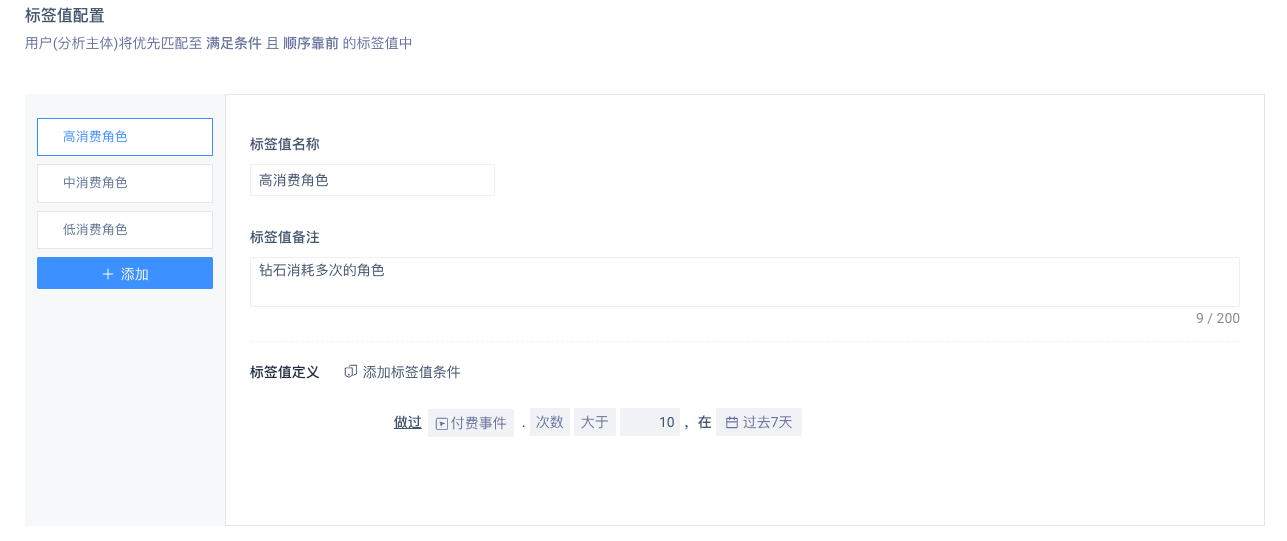
- When you customize the condition, all users will judge the composition in order according to the order of tag values. That is, after the same user meets the upper tag value, it will no longer be in the lower tag value filter.
- The user in all tag values jointly constitutes the tag users.
- The added tag value is always after the last tag value. A tag is created with up to 20 sets of tag values. When 20 is reached, no new additions are possible.
- Upper limit of 200 tags created by custom condition.
DANGER
If the source of the tag's subject is event attribute, only the condition 'something done' can be selected, neither 'nothing done' nor 'user attribute satisfied' can be selected. At the same time, only events with this attribute are in the event drop-down list.
(2) First and Last Features
Within a specified period of time, the user completes the attributes of the first/last event as the tag value.
Example: The event tracking level does not record the user's first login time, but it needs to be grouped or filtered by the first login date. You can select from the opening date to the present as the analysis period, and the first login time as the user's tag value.
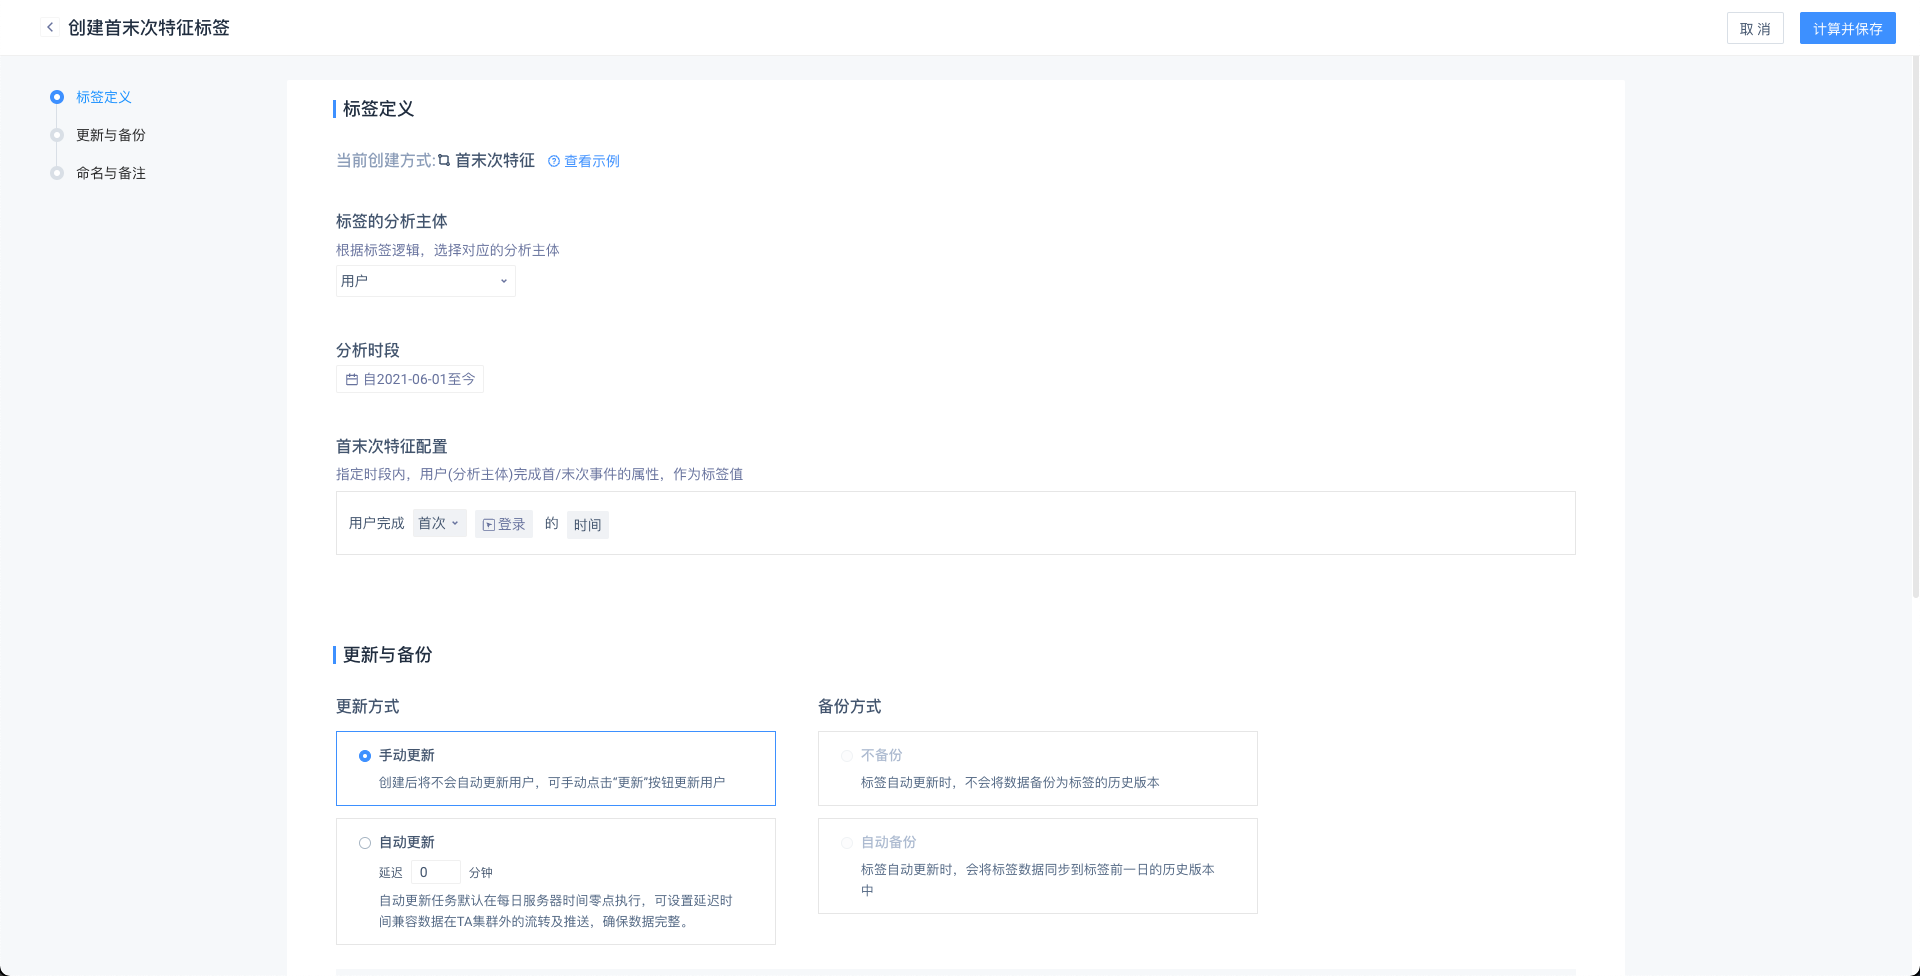
- Analysis period: the dynamic 'past 7 days' is selected by default, and dynamic or static time can be selected.
- First and last information: you can choose the first or last time.
- Completion events: select any physical or virtual event, filter event properties or user features.
| Event type | Filterable event properties |
|---|---|
| Physical events | Event properties |
| Virtual event | Event properties for virtual events (union) |
When a time event property is selected as a filter, it is offset to the project's default time zone before being evaluated
- Analysis attribute (tag value): optional occurrence time or event attribute, meta attribute, virtual attribute, dimension table attribute can be selected, but does not include objects, object groups, object group sub-attributes.
- The data type will determine the data type of the tag and the keywords when using the tag.
| Type | Attribute | Data type |
|---|---|---|
| Preset indicators | Time * | Time |
| Event attribute indicator | Numerical attribute | Value |
| List attribute | List | |
| Boolean attribute | Boolean | |
| Time attribute * | Time | |
| Text attribute | Text |
DANGER
- Even if there is a completion event, when the tag value is empty, the user will still be removed from the tag; if the analysis subject of the tag is an event attribute, the event drop-down list can only select events that contain the event attribute
- Time or time type attributes, all with the value after the offset to the project's default time zone as the tag value.
(3) Index Value
The aggregate indicator of the user completion event for a specified period of time is used as the tag value.
For example, it is necessary to record the accumulated payment data of users over a period of time, through which users are layered.
The total amount paid over this period can then be used as a tag value. Users are then filtered or grouped for comprehensive analysis.
- Tag Condition Settings at Creation
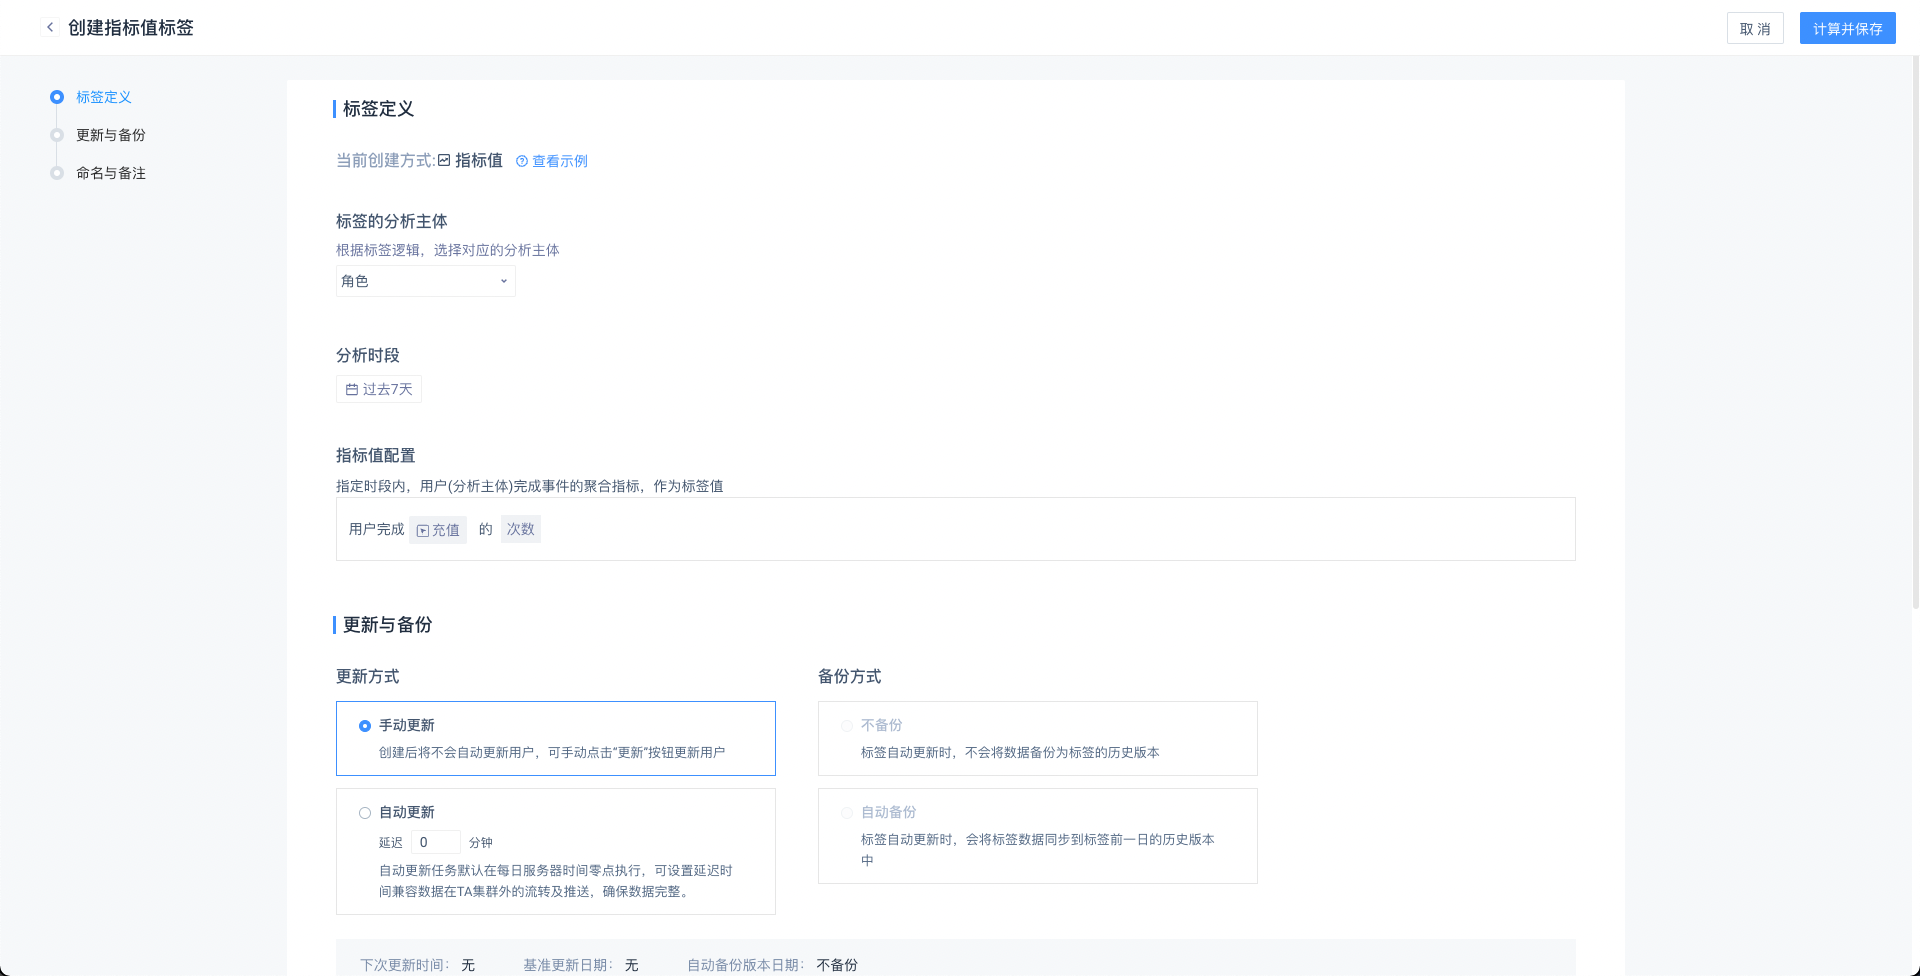
Users who complete the event will belong to the tag (users with empty indicators will be eliminated).
Analysis period: the dynamic 'past 7 days' is selected by default, and dynamic or static time can be selected.
Completion event: select any physical event or virtual event or any event.
Filter condition for events: You can filter event attributes or user features.
| Event type | Filterable event atttributes |
|---|---|
| Physical events | Event atttributes |
| Virtual event | Event attributes for virtual events (union) |
When a time event attribute is selected as a filter, the attribute is offset to the project's default time zone and then evaluated.
DANGER
If the analysis subject of the tag is an event attribute, the event drop-down list selects only events that contain the event attribute.
- Create Tag Value Determination for Condition
Determine the tag value of the user by analyzing indicators, namely ('Event' + 'Attribute' + 'Calculation Method') or directly ('Event' + 'Calculation Method')
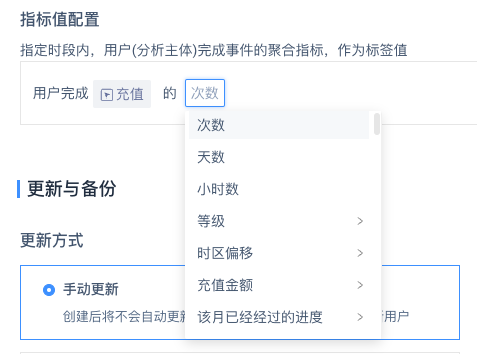
| Attribute | Calculation method |
|---|---|
| Total number | |
| Number of days | |
| Number of hours | |
| Numerical attribute | Sum, mean, median, maximum, minimum, deduplicate number, 99 percentiles, 95 percentiles, 90 percentiles, 80 percentiles, 75 percentiles, 70 percentiles, 60 percentiles, 40 percentiles, 30 percentiles, 25 percentiles, 20 percentiles, 10 percentiles, 5 percentiles |
| List attribute | List deduplicate number, list element deduplicate number |
| Boolean attribute | True number, false number, deduplicate number |
| Time attribute * | Deduplicate number |
| Text attribute | Deduplicate number |
| Object attribute | Deduplicate number |
| Object group attributes | Deduplicate number |
The time of occurrence is calculated according to the time zone of the project, which is not the time zone configured by the individual.
- Edit Formula Scene
Each formula needs to edit the display name, and the elements in the formula form the formula through four operations.
- Composition Specification of Each Component in Formula Calculation
| Event description | Indicator description/data type | Analysis angle |
|---|---|---|
| Any event | Number of times, days, hours | |
| Meta event | Number of times, days, hours | |
| Meta event | Event attributes (numeric) | Sum, mean, median, maximum, minimum, deduplicate number, 99 percentiles, 95 percentiles, 90 percentiles, 80 percentiles, 75 percentiles, 70 percentiles, 60 percentiles, 40 percentiles, 30 percentiles, 25 percentiles, 20 percentiles, 10 percentiles, 5 percentiles |
| Meta event | Event properties (list type) | List deduplicate number, element deduplicate number |
| Meta event | Event properties (Boolean) | True number, false number, empty number, not empty number, deduplicate number |
| Meta event | Event properties (other types) | Deduplicate number |
- Overall Filter and Subdivision Filter

The optional attributes of the overall filter are the public event attributes of all components of the formula or all user features.
The filtering logic of attributes is consistent with event analysis.
All user samples are: meet the overall filter condition and have participated in any event in the component.
- Value of non-participating events
The analysis angle of the user's non-participation event in the formula, the value is recorded as 0.
- Abnormal situation of calculation result
When division is used, the divisor may be 0, and the value cannot be calculated at this time. It will be defined as "unknown" and the user will be removed from the label.
(4) ID upload
According to the standard upload ID required by the template, the tag user is defined, and the tag value is given at the same time. You can select a user feature as an associated field to judge the user.
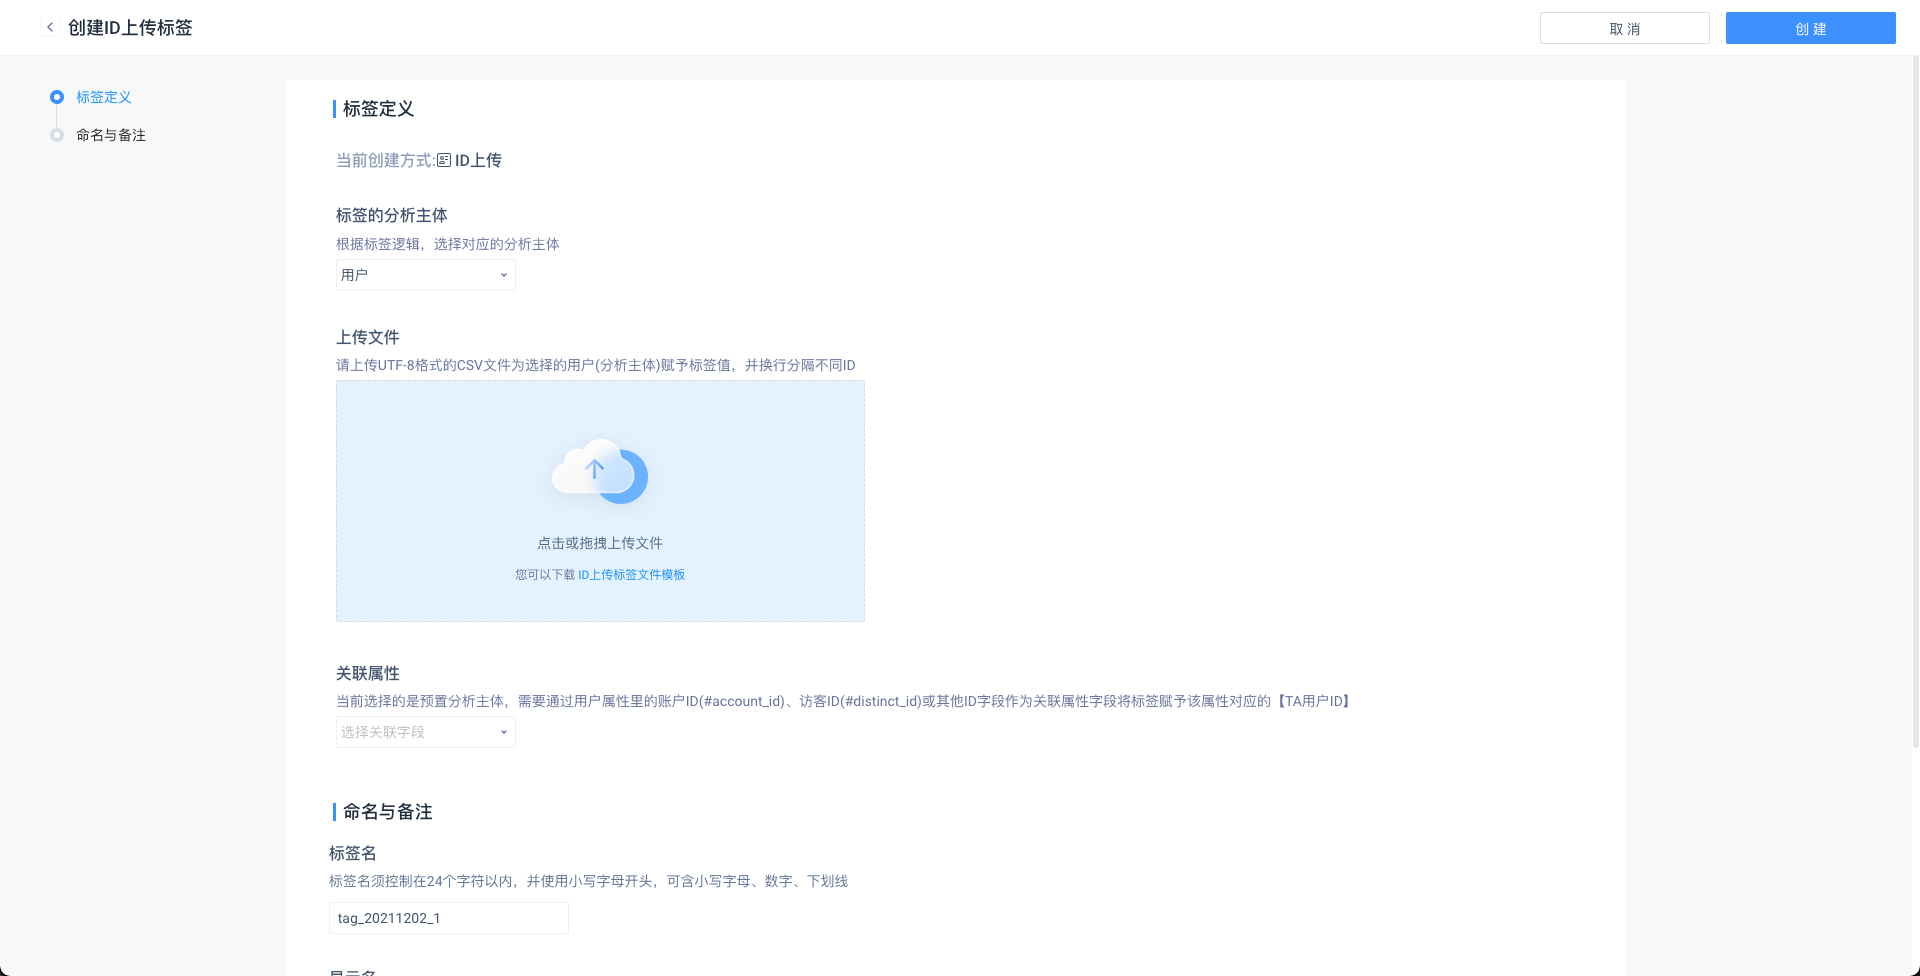
- Users with the same value in the second column will form the same tag value.
- If the user does not have a tag value, the row record will be discarded and a prompt will be given when the result is displayed in the last step.
- ID upload the tag value created, there is no upper limit on the number of independent tag values recorded.
- ID upload type tag, can not set 'update method' and 'backup method'.
If the analysis subject selects the TA user ID (#user_id), a user feature can be selected as the associated field to judge the user, and the TA user ID that meets the selected user feature value (the first column) at the time of uploading will be given The corresponding tag value.
If other analysis subjects are selected, the first column in the uploaded file will be directly used as the analysis subject ID, and whether the corresponding ID exists in the currently reported data will not be verified. Please check carefully before uploading.
For example: take the district service ID as the analysis subject, assuming that the current game is only open to the 60th district service, the uploaded file can still use 61, 62... As the analysis principal ID.
TIP
Each user supports the creation of 50 ID upload tags. After reaching the upper limit, you can continue to add by deleting the existing tags.
A project supports the creation of 200 tags (except ID upload tags), you can contact TA staff to increase the maximum number of tags.
# 4.2.2 Updates and Backups
- You can only set the update method if the label type is not 'ID Upload'. The default option is 'Manual Update'.
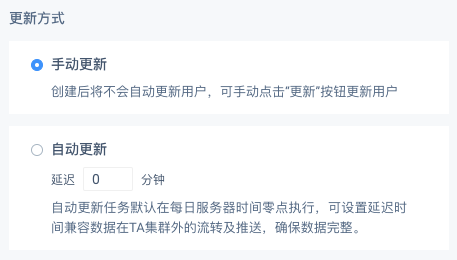
- Manual update: users will not be updated automatically after creation. users can be updated manually by clicking the 'update' button.
- Automatic Update: The automatic update task defaults to execute at 12 am of the daily server time and delay time compatibility can be set for data flow and push outside the TA cluster to ensure data integrity.
For example, if the update delay is set to 30 minutes, the tag update task of the previous day will be performed at 00:30 of the daily server time.
- Backup mode can only be set if data update mode is selected for automatic update.
- No backup: Data is not backed up as a historical version of the label when the tag is automatically updated.
- Automatic backup: When the label is automatically updated, the tag data is synchronized to the historical version of the day before the tag.
Note: Automatic backup can only take effect if 'Automatic Update' is set. If the update method is 'Manual Update', automatic backup will not be performed regardless of whether automatic backup is turned off or not.

# 4.2.3 Name and Remarks
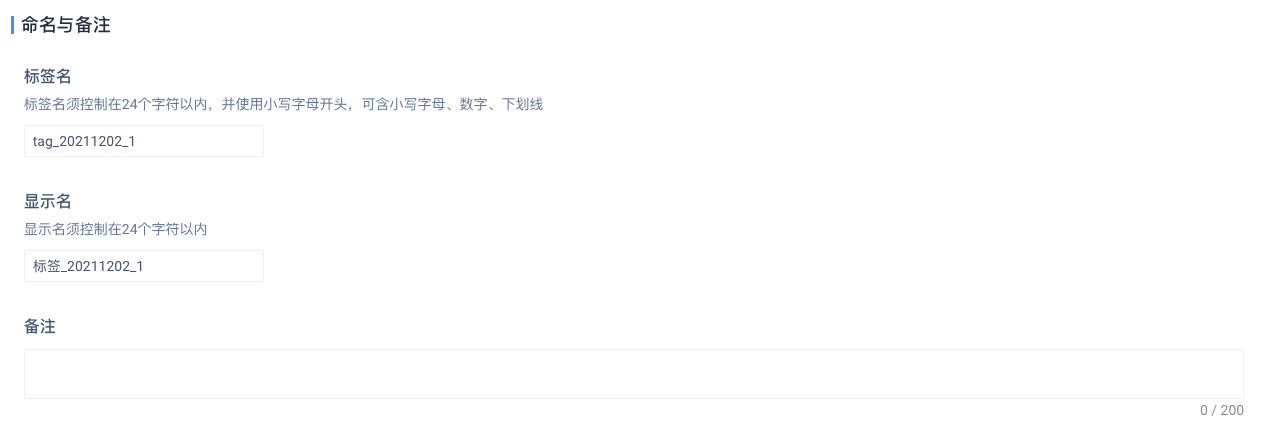
- Tag signature: Tag signature must be controlled within 24 characters, and start with lowercase letters, which can contain lowercase letters, numbers, and underscores ; after the label is created, the label signature cannot be modified.
- Display name: display name must be controlled within 24 characters.
- Remarks (optional): Remarks must be controlled within 200 characters.
# 4.3 Operation of Historical Version
# 4.3.1 Automatic Backup
If the automatic backup is turned on, when the tag is automatically updated, the updated data is written to the historical version of the previous day, i.e. the automatic update task of that day accomplishes two things at the same time.
# 4.3.2 Manual Backup
In addition to automatic backup, it can also actively calculate the historical version of the specified date, which is mainly used to supplement missing versions, recalculate failed tasks or update tag calculation logic and other scenarios.
- Recalculation: For a date that has been calculated (backed up), you can click the 'Recalculation' button to calculate the data of that date
- Batch Calculation: Click the 'Batch Calculation' button to select all historical versions or abnormal versions within the date range for calculation.
Note: Batch calculation of historical versions may take a long time, please choose an appropriate time to perform.
TA system will restore the data at that time as much as possible when manually backing up. If user features are used in the tag rules (including virtual event attributes or dimension table attributes using user features), you need to select options in the dialog box:
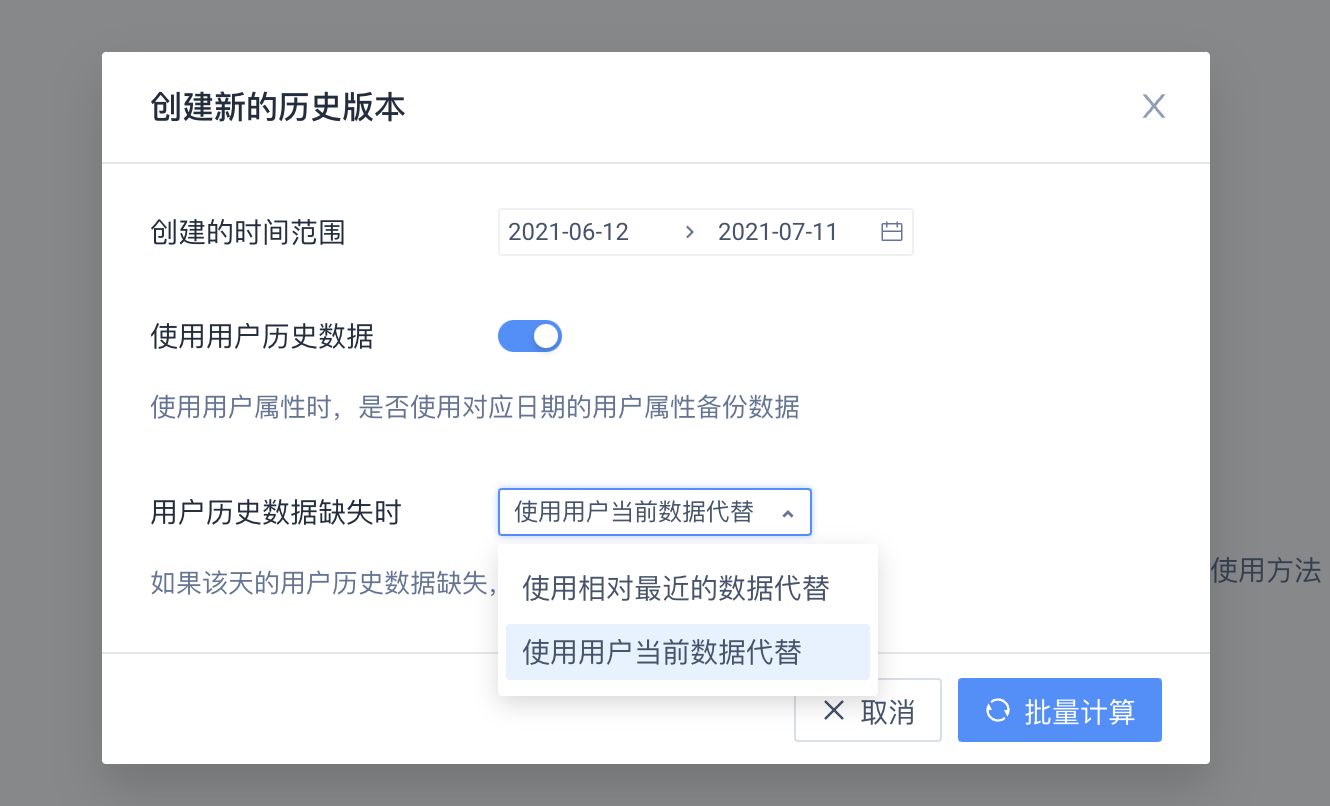
- Whether to use user history data: When using user features, whether to use user features corresponding to the date to back up data.
- How to deal with missing user history data: This option can only be selected when 'Whether to use user history data' is checked. If the user history data of that day is missing, whether to use the user's current data instead or the relatively recent data instead.
# 4.3.3 Clean Up the Historical Version
If the historical version saved before this label is no longer needed, you can click the 'Clean Historical Version' button and all historical versions within the selected date range will be removed.
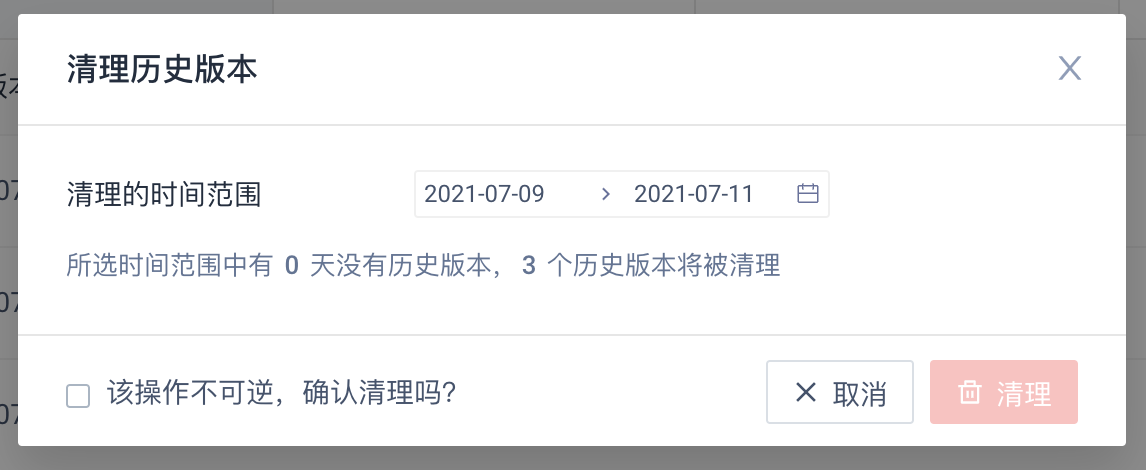
Note: The operation of cleaning up the historical version is irreversible, please pay attention before cleaning; If you accidentally clean up, you can refer to the previous 'batch calculation' operation to make up for the missing version of the data.
# 4.4 Usage of User Tags in Models
# 4.4.1 Filter Condition Under User Tags
User tag filtering, further select the scenarios of 'tag value'.
When 'tag' is selected as the filter item in the user tag, the attribute logic, associated value is the same as the 'text' type.
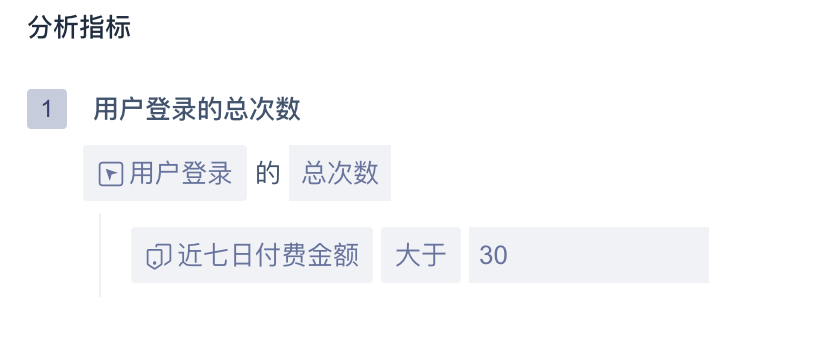
List about label filter logic.
| Data type of label | Optional |
|---|---|
| Text | Equal to, not equal to, include, not include, have value, have no value, regular match, regular mismatch |
| Value | Equal to, not equal to, less than, less than or equal to, greater than, greater than or equal to, with value, without value, interval |
| Time | Located in interval, less than or equal to, greater than or equal to, relative to current date, relative to event occurrence time, with value, without value |
| List | Existing element, non-existing element, element location, value, no value |
| Boolean | True, false, valuable, worthless |
# 4.4.2 Usage of User Label Group Items
When selecting user group and user tags as group items
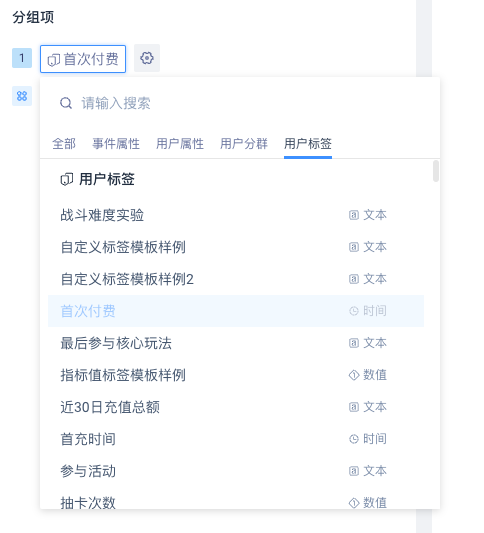
| Group item options | Group items under groups |
|---|---|
| User tags | Label value, (null) |
The group under the user tag is 'tag value' and (null) (equivalent to not belonging to the label), if you do not want to see (null) in the data, you can select the label 'has value' in the filter condition.
# 4.4.3 Usage of Historical Tags
If the tag used has a version history, you can specify the desired version when the filter or group item is used.

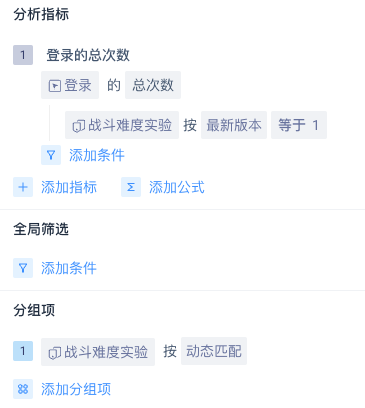
- Latest version: calculated according to the user's latest tag value.
- Dynamic matching: calculated by the user's tag value on the day of the event.
- Historical version: based on the user's label value on a specific date, only the historical version (date) with data can be selected.
Note: Current event analysis, retention analysis, funnel analysis, distribution analysis, flow analysis, interval analysis support tag selection version, while attribute analysis can only use the latest version of tag.
# 4.5 User Tag List Page
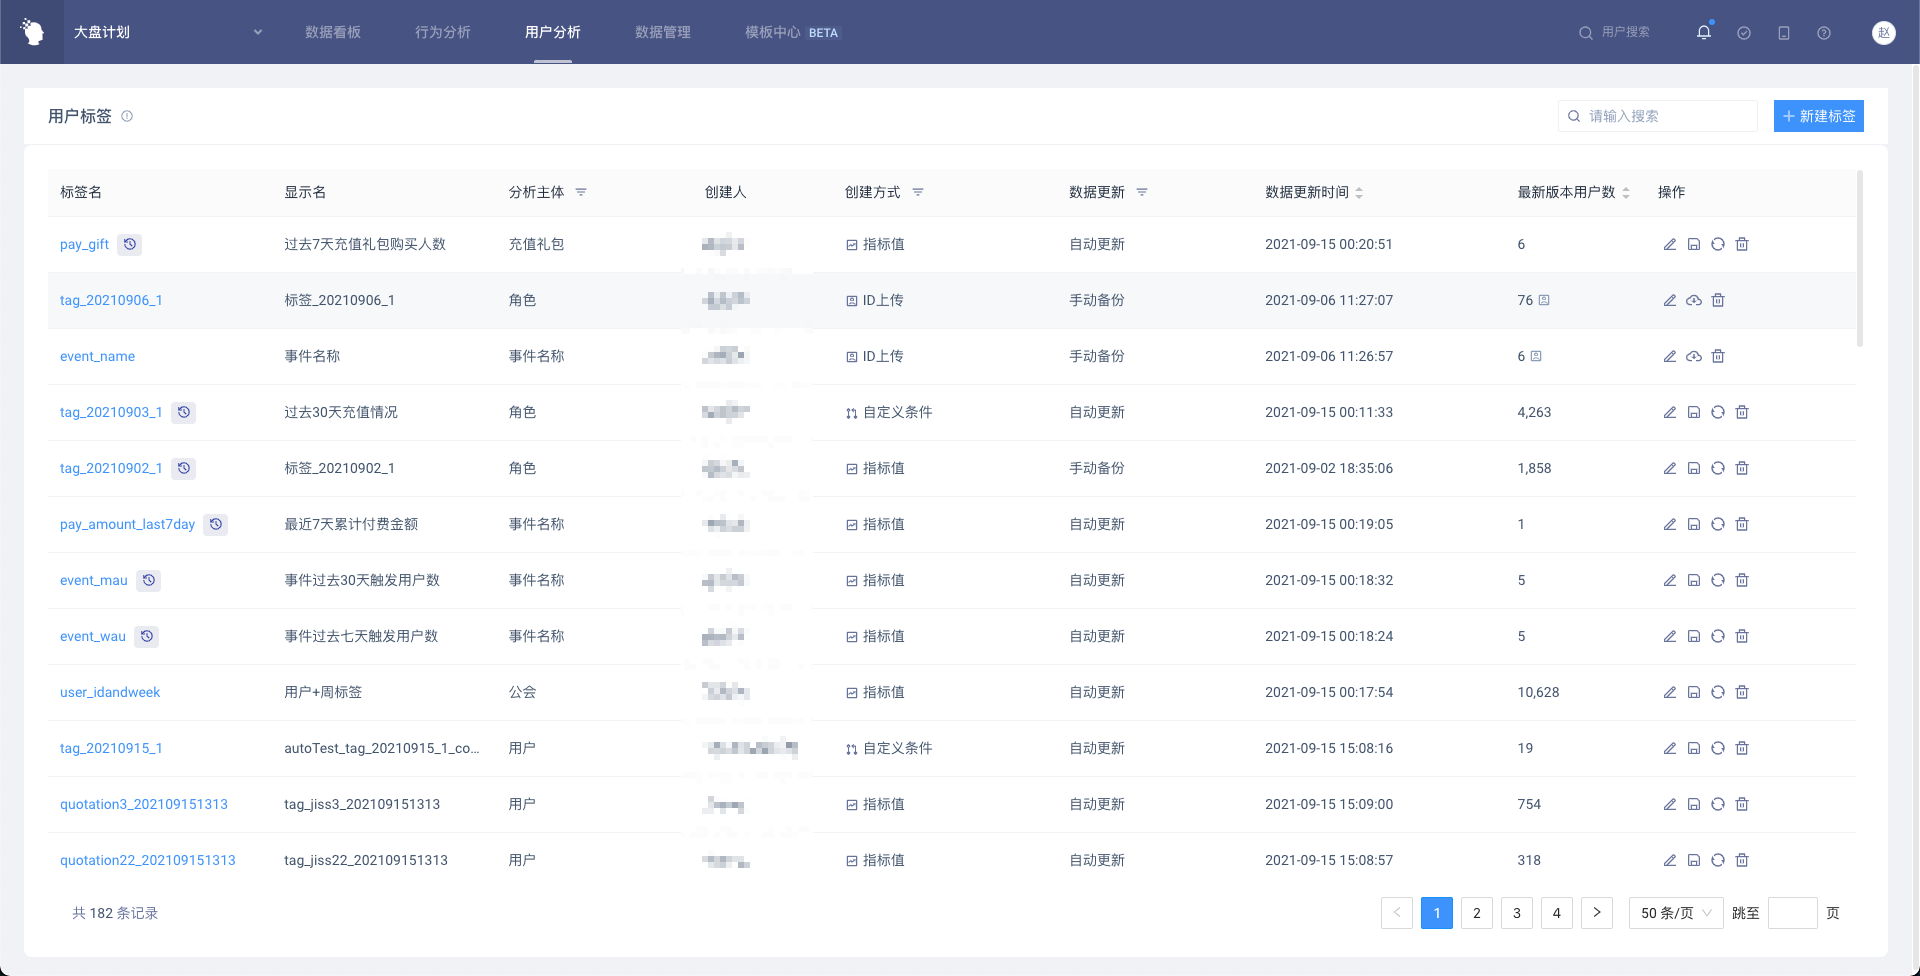
- You can enter the user tag details page (data details) by clicking on the tag signature; click on the icon next to the tag signature to enter the user tag details page (historical version management)
- Click the 'New Tag' button in the upper right corner to create a tag.
- Click on the icon of the operation bar to perform various operations.
- Click 'Edit Tag' to enter the tag editing page.
- Click 'Save As' to bring the conditions of the current label to the new label page.
- Click 'Update Data' to recalculate the latest version of the label based on the current date.
- Click 'Download' to download the user tag data directly (only the ID upload tag has this button)
- Click 'Delete' to delete the label. Please note that reports and virtual properties using the tag will not be available after the tag is deleted.
# 4.6 User Tag Details Page
User tag details page, including tag basic information, data details and historical version management three parts.
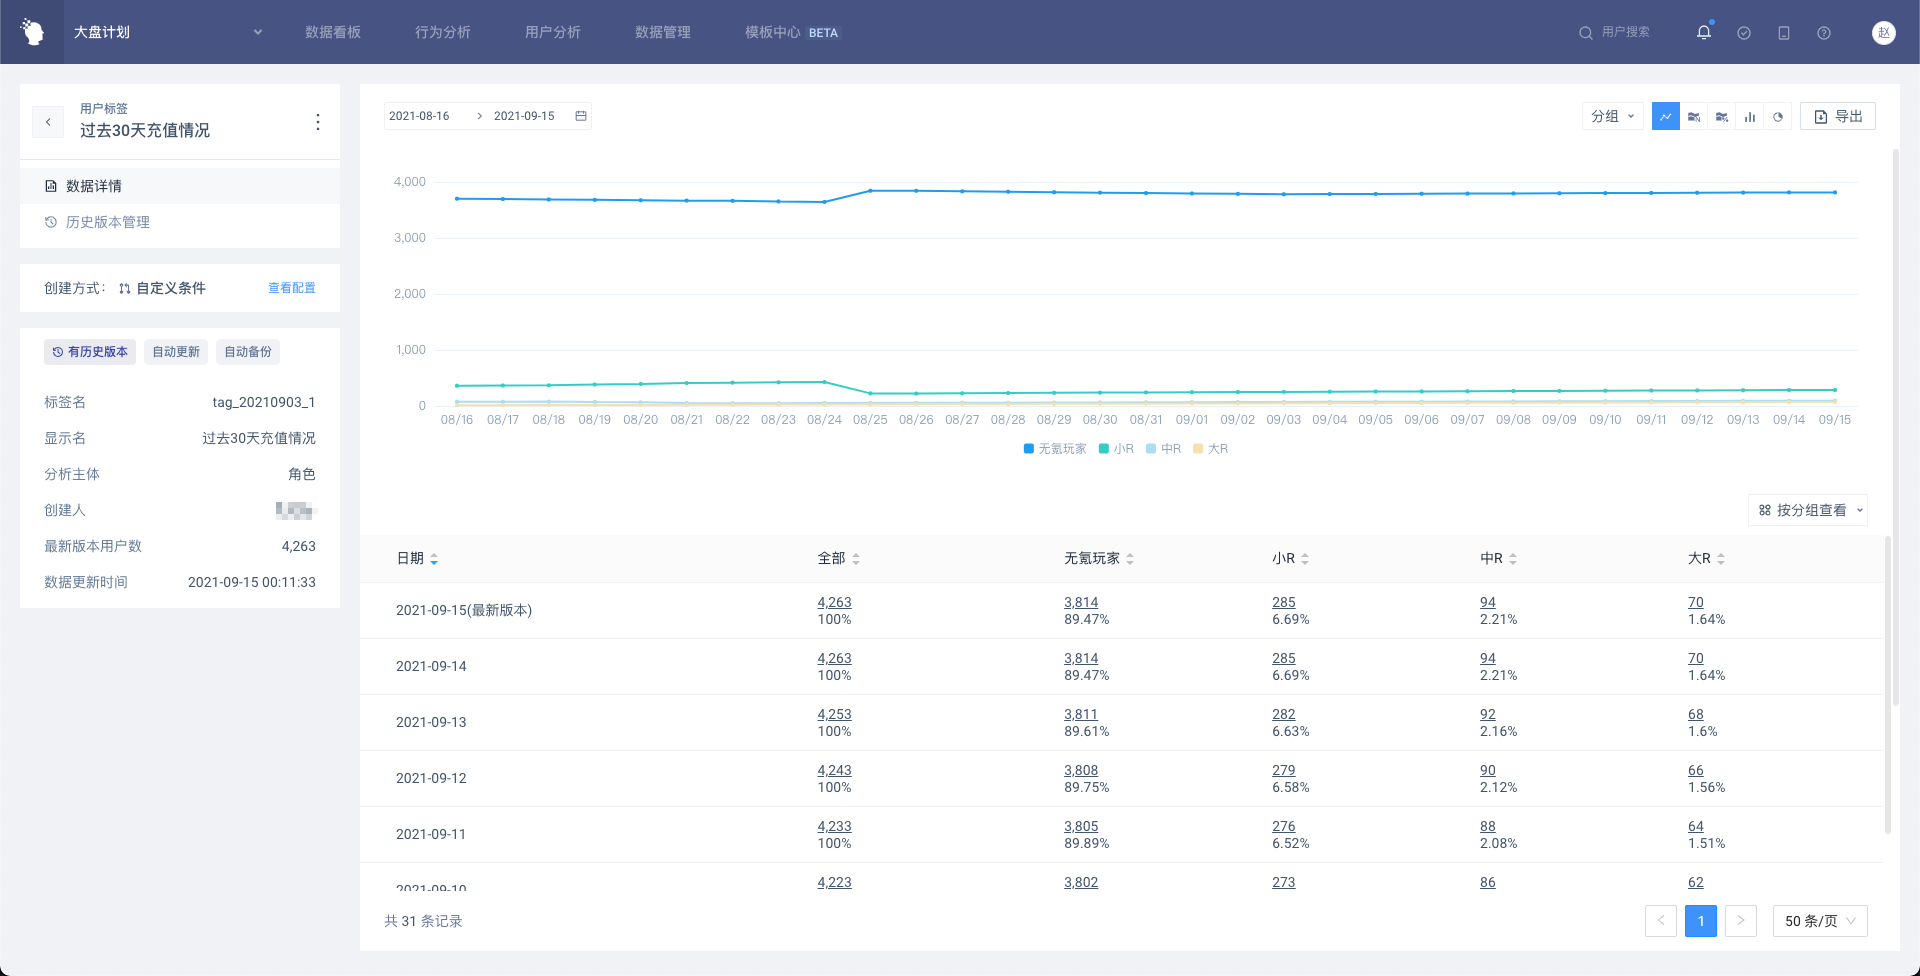
# 4.6.1 Basic Label Information
Display the basic information of the label, which is basically the same as the content displayed on the user label list page.
Click 'View Configuration' to open a pop-up window with details to view the specific creation conditions.
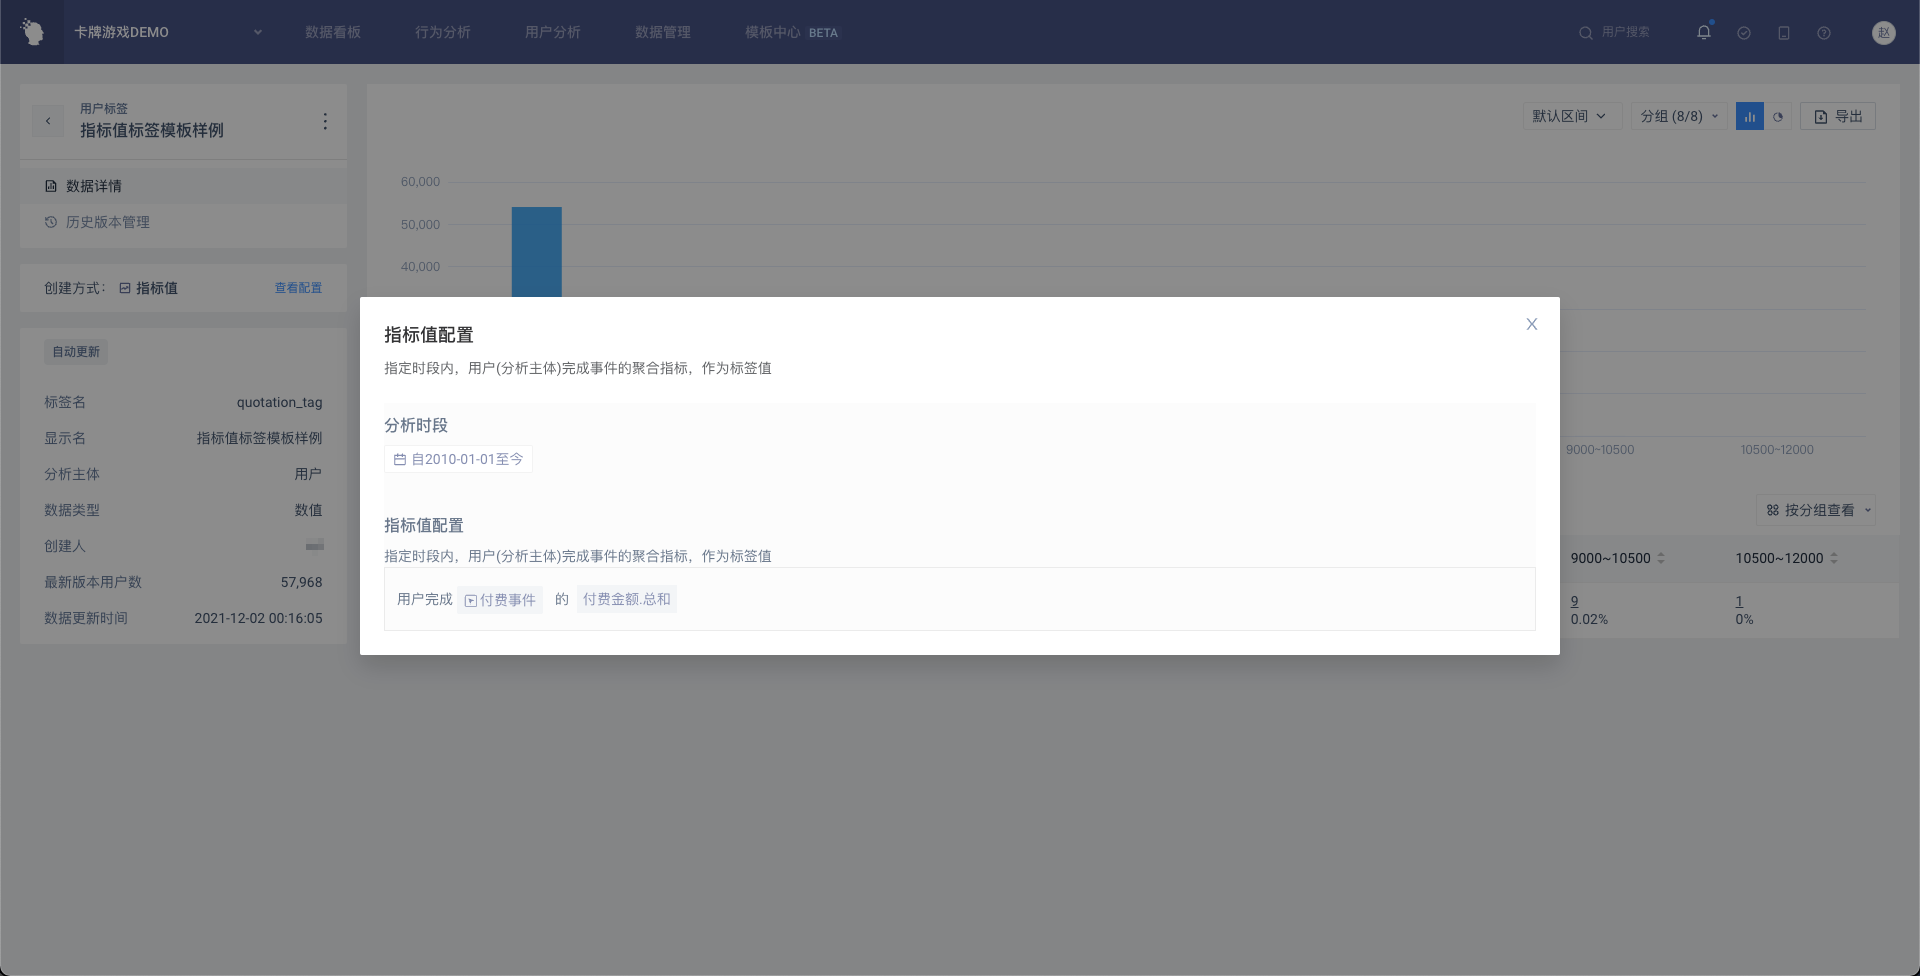
Click the 'More' button next to the tag name to operate, which is consistent with the user tag list page.
# 4.6.2 Data Details
Display the data of the latest version and historical version of the tag. The latest version will be displayed on the date of 'today'. By default, the data of the last 31 days (the last 30 days + the latest version) will be displayed. If the time span of the historical version is less than 30 days, that is, the date of the earliest historical version is within 30 days, the data from that date to today will be displayed.
If the type of the label value is numeric, list, or time, you can customize the way the data is summarized.
(1) Form Display
The table shows the number and attribute of users grouped by tag values, and also shows 'all', that is, all users with tag values. Click on the underlined number to enter the user list, which is consistent with the analysis model. In addition to attributes, the user list will also display tag values and tag dates.
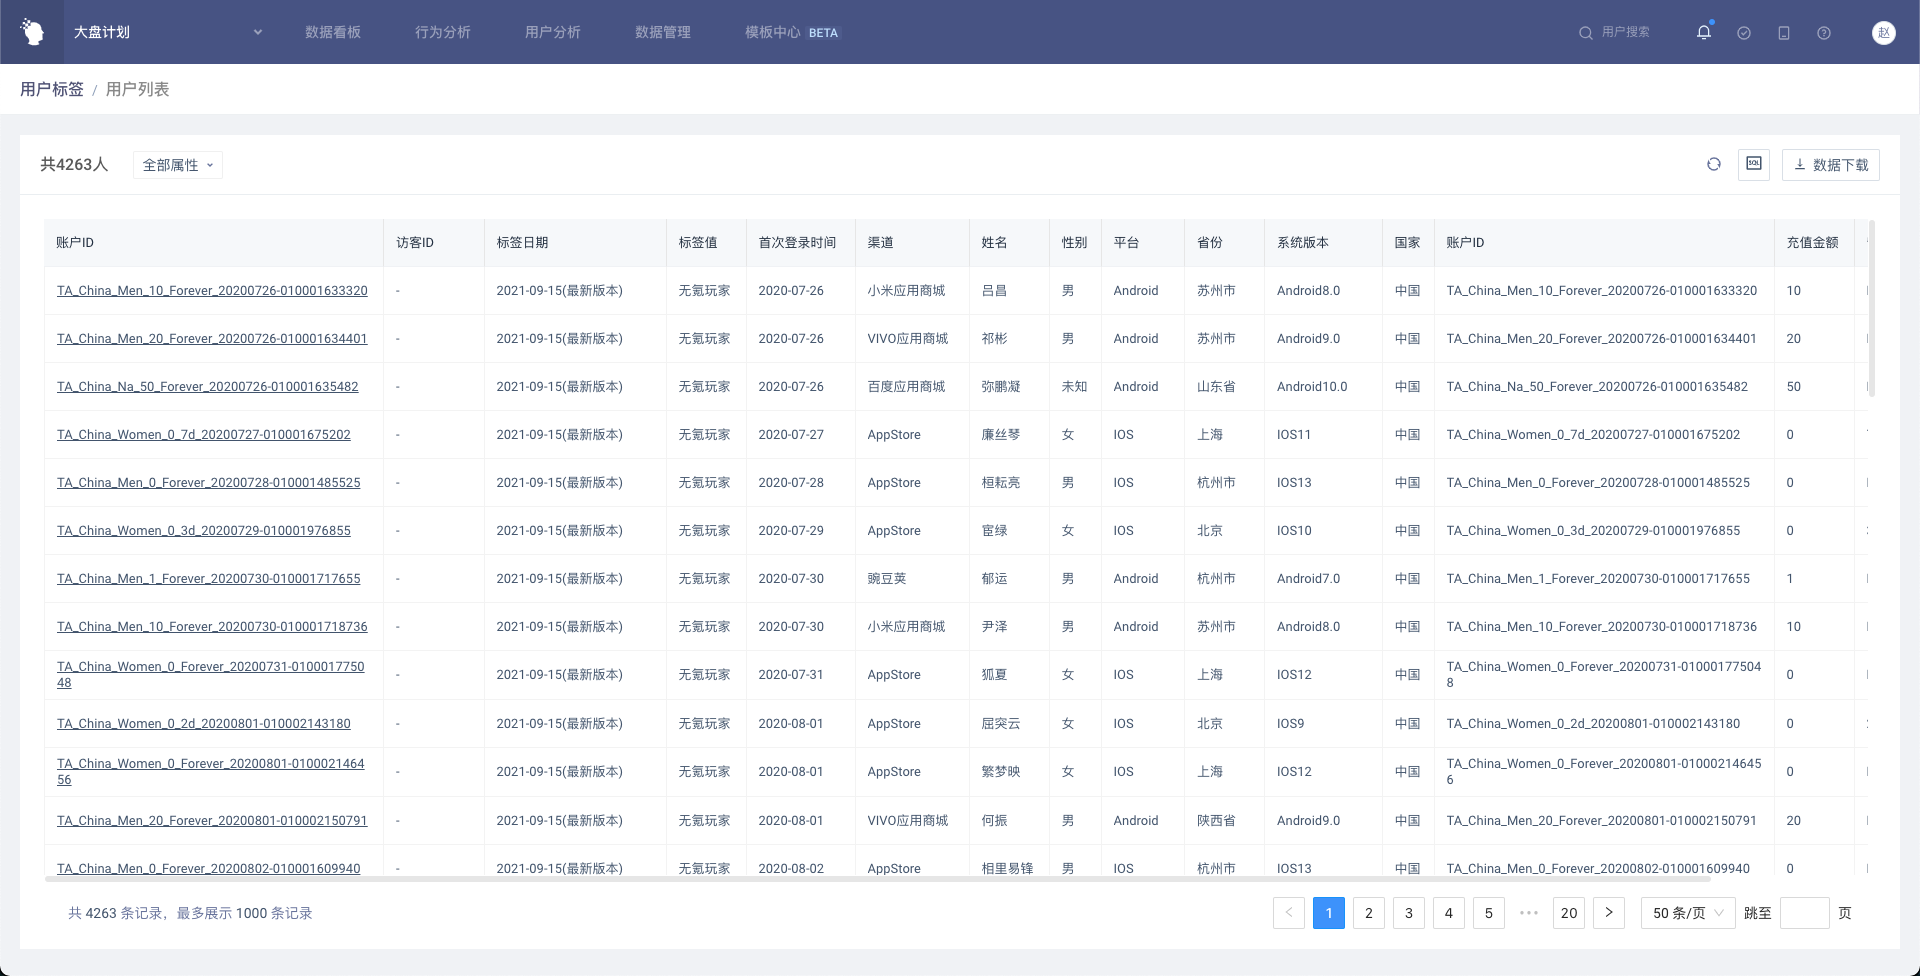
The table supports two display styles, the default is to view by group.
View by group
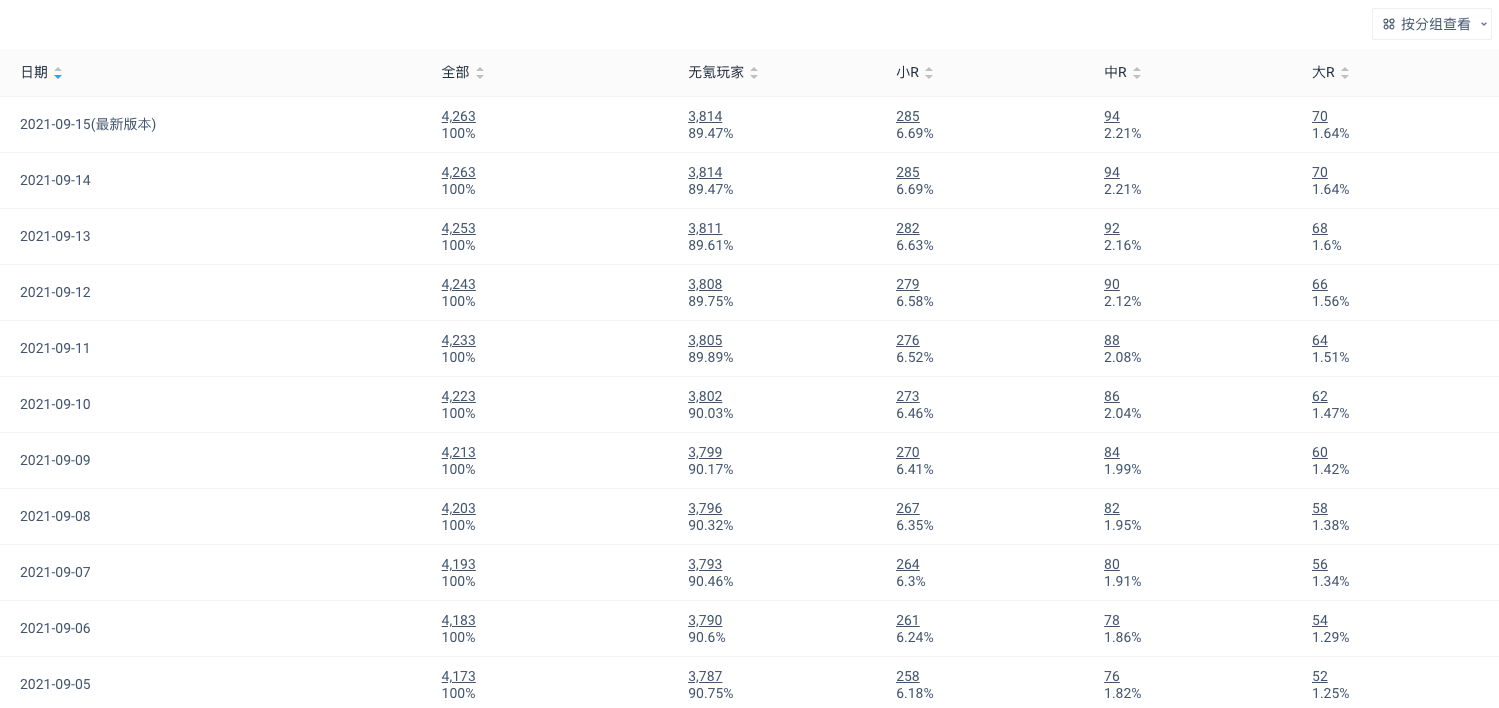
View by date

(2) Chart Display
If the label has a historical version, all chart types are supported. If the label has no historical version, it can only be displayed by histogram and pie chart. When the label with the historical version is switched to the histogram or pie chart, the version to be displayed needs to be selected from the date range.
Line Graphs

Numerical Stacking Diagram

Percentage Stacking Chart

Histogram

Pie Chart

# 4.6.3 Historical Version Management
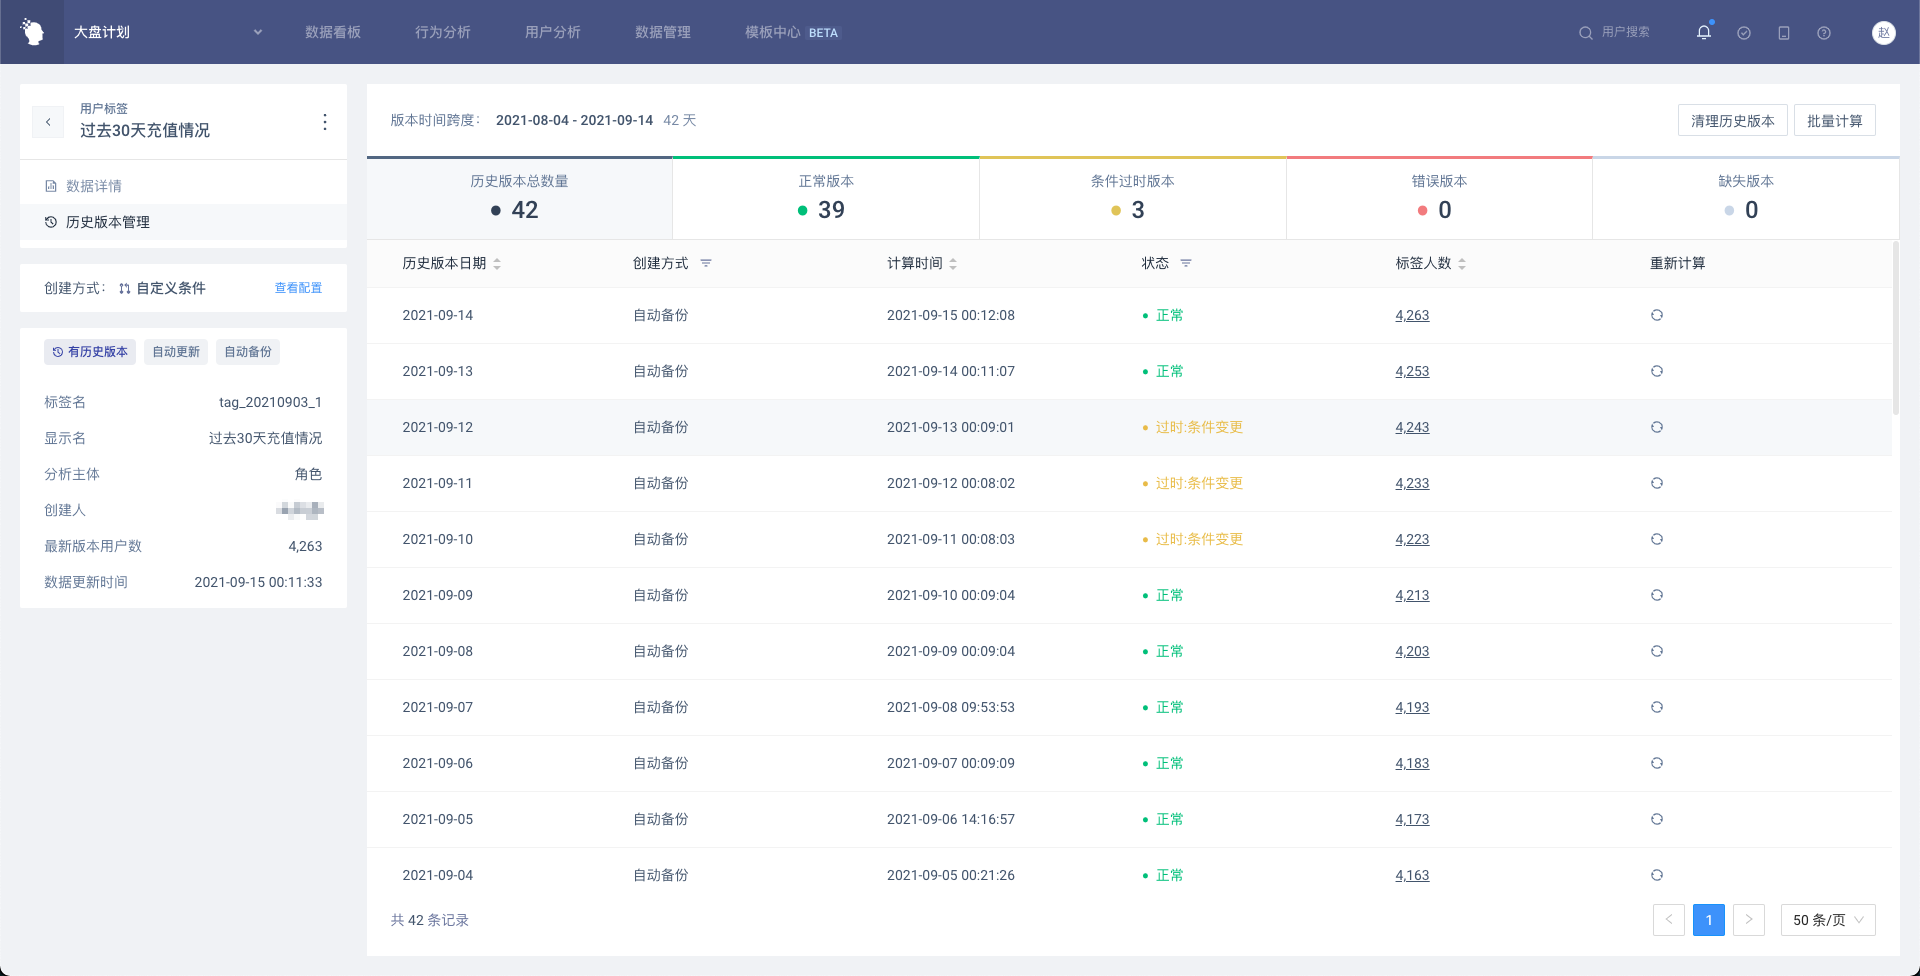
- History Version Overview
Display macro data of historical versions, including the time span, the number of days included, the number of versions, and the number of versions with abnormal states, etc.
- List of Historical Versions
Display the historical version information and status of each day within the span, which can be operated in the list.
Version status and description:
- Normal
- Missing: No historical version for this date.
- Outdated (condition change): The tag logic used in this historical version is inconsistent with the current tag logic.
- Outdated (type change): The data type of the tag value for this historical version is inconsistent with the current tag logic.
- Calculation in progress: Calculation in progress, there will be a message notification after the calculation is completed.
- Calculation failed: The calculation was abnormal and the calculation was not successful.
- Queuing status: waiting for calculation.
# V. Best Applications
# 5.1 Obtain Historical Behavioral Indicators
Through the 'index value' label, the index of each user's historical behavior can be calculated, such as the total historical payment amount (i.e. the total Life Time payment amount), the total number of applications started and the total duration, etc. These overall indicators can well stratify users. Whether it is to directly view the distribution of label values in attribute analysis or to use labels for group and filter in analysis models, tag can play a very powerful role.
# 5.2 Obtain the First Act
Through the "first and last feature" tag, the time when each user produces a certain behavior for the first time can be calculated, and the first event identifier can be obtained with virtual attributes (comparing the first time in the tag with the event time, equality is the first time, otherwise it is not the first time). Add more filters to create tags to get more customized first events.
# 5.3 Use History Tags to Accurately Restore the User's State at the time of the Event
The same user may change from 'small R' to 'big R' over time. When group according to the user's payment level, the behavior generated by the user yesterday should be considered as generated by small R, and the behavior generated today should be considered as generated by big R. Therefore, after calculating the 'total recharge amount' label of users in history, the label is taken as a group item, and the desired result can be obtained by viewing the daily data in the way of 'dynamic matching'.
# 5.4 View Daily Return User Performance
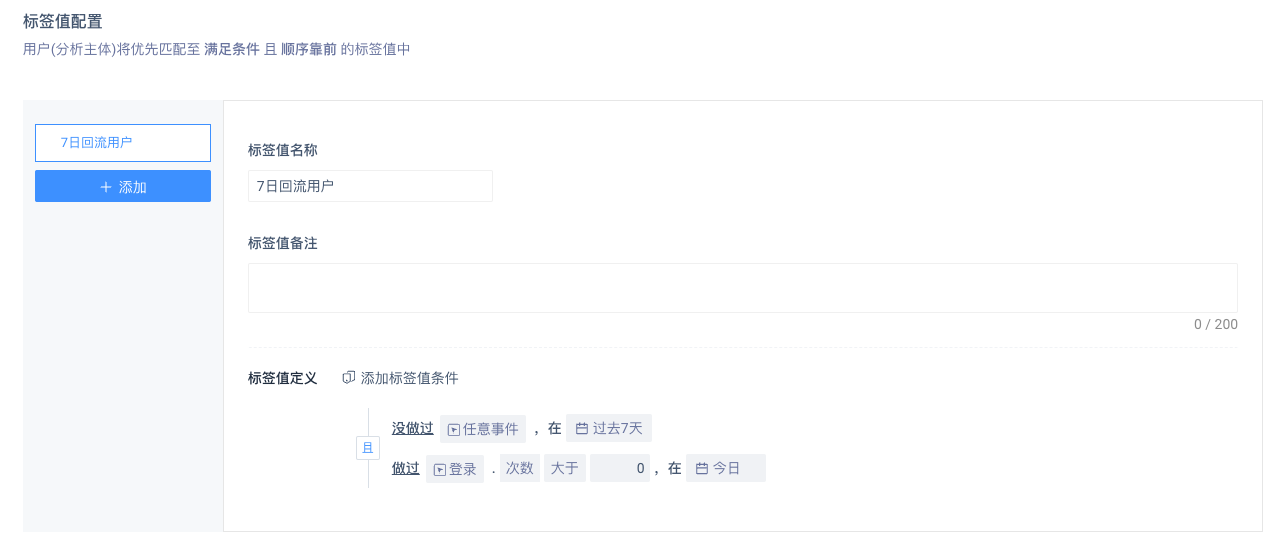
Through the 'Custom Conditions' tab, you can filter out the returned users of the day according to the following conditions:
- Login today
- No events in the last 7 days (i.e. no log-on)
# 5.5 Statistical Accumulated Recharge Amount by Account
When creating a tag, you can use the custom analysis subject as the tag object, and the logic will be adjusted accordingly after switching; In the case of a pay event, create the indicator value tag:
- The analysis period is from January 1 to the present
- The tag value is the sum of the paid amount for the paid event
- The analysis subject is the account (user feature, the preset analysis subject is the role, there can be multiple roles under one account)
The meaning of this logic is to take the sum of the paid amounts of all characters under a single account from January 1 to the present as the accumulated recharge amount of the account ID.
For more explanation of the analysis subject, please refer to the analysis subject.
