# User Behavior Sequence
# I.The Significance of User Behavior Sequence
You can microscopically observe the specific performance of a user that fits certain characteristics. It is convenient to filter attributes and make further analysis on users ' specific behavior distribution, behavior path and behavior characteristic preference in specific time section. To achieve the purpose of improving efficiency and optimizing decision-making.
# II. Location and Applicable Roles of User Behavior Sequence
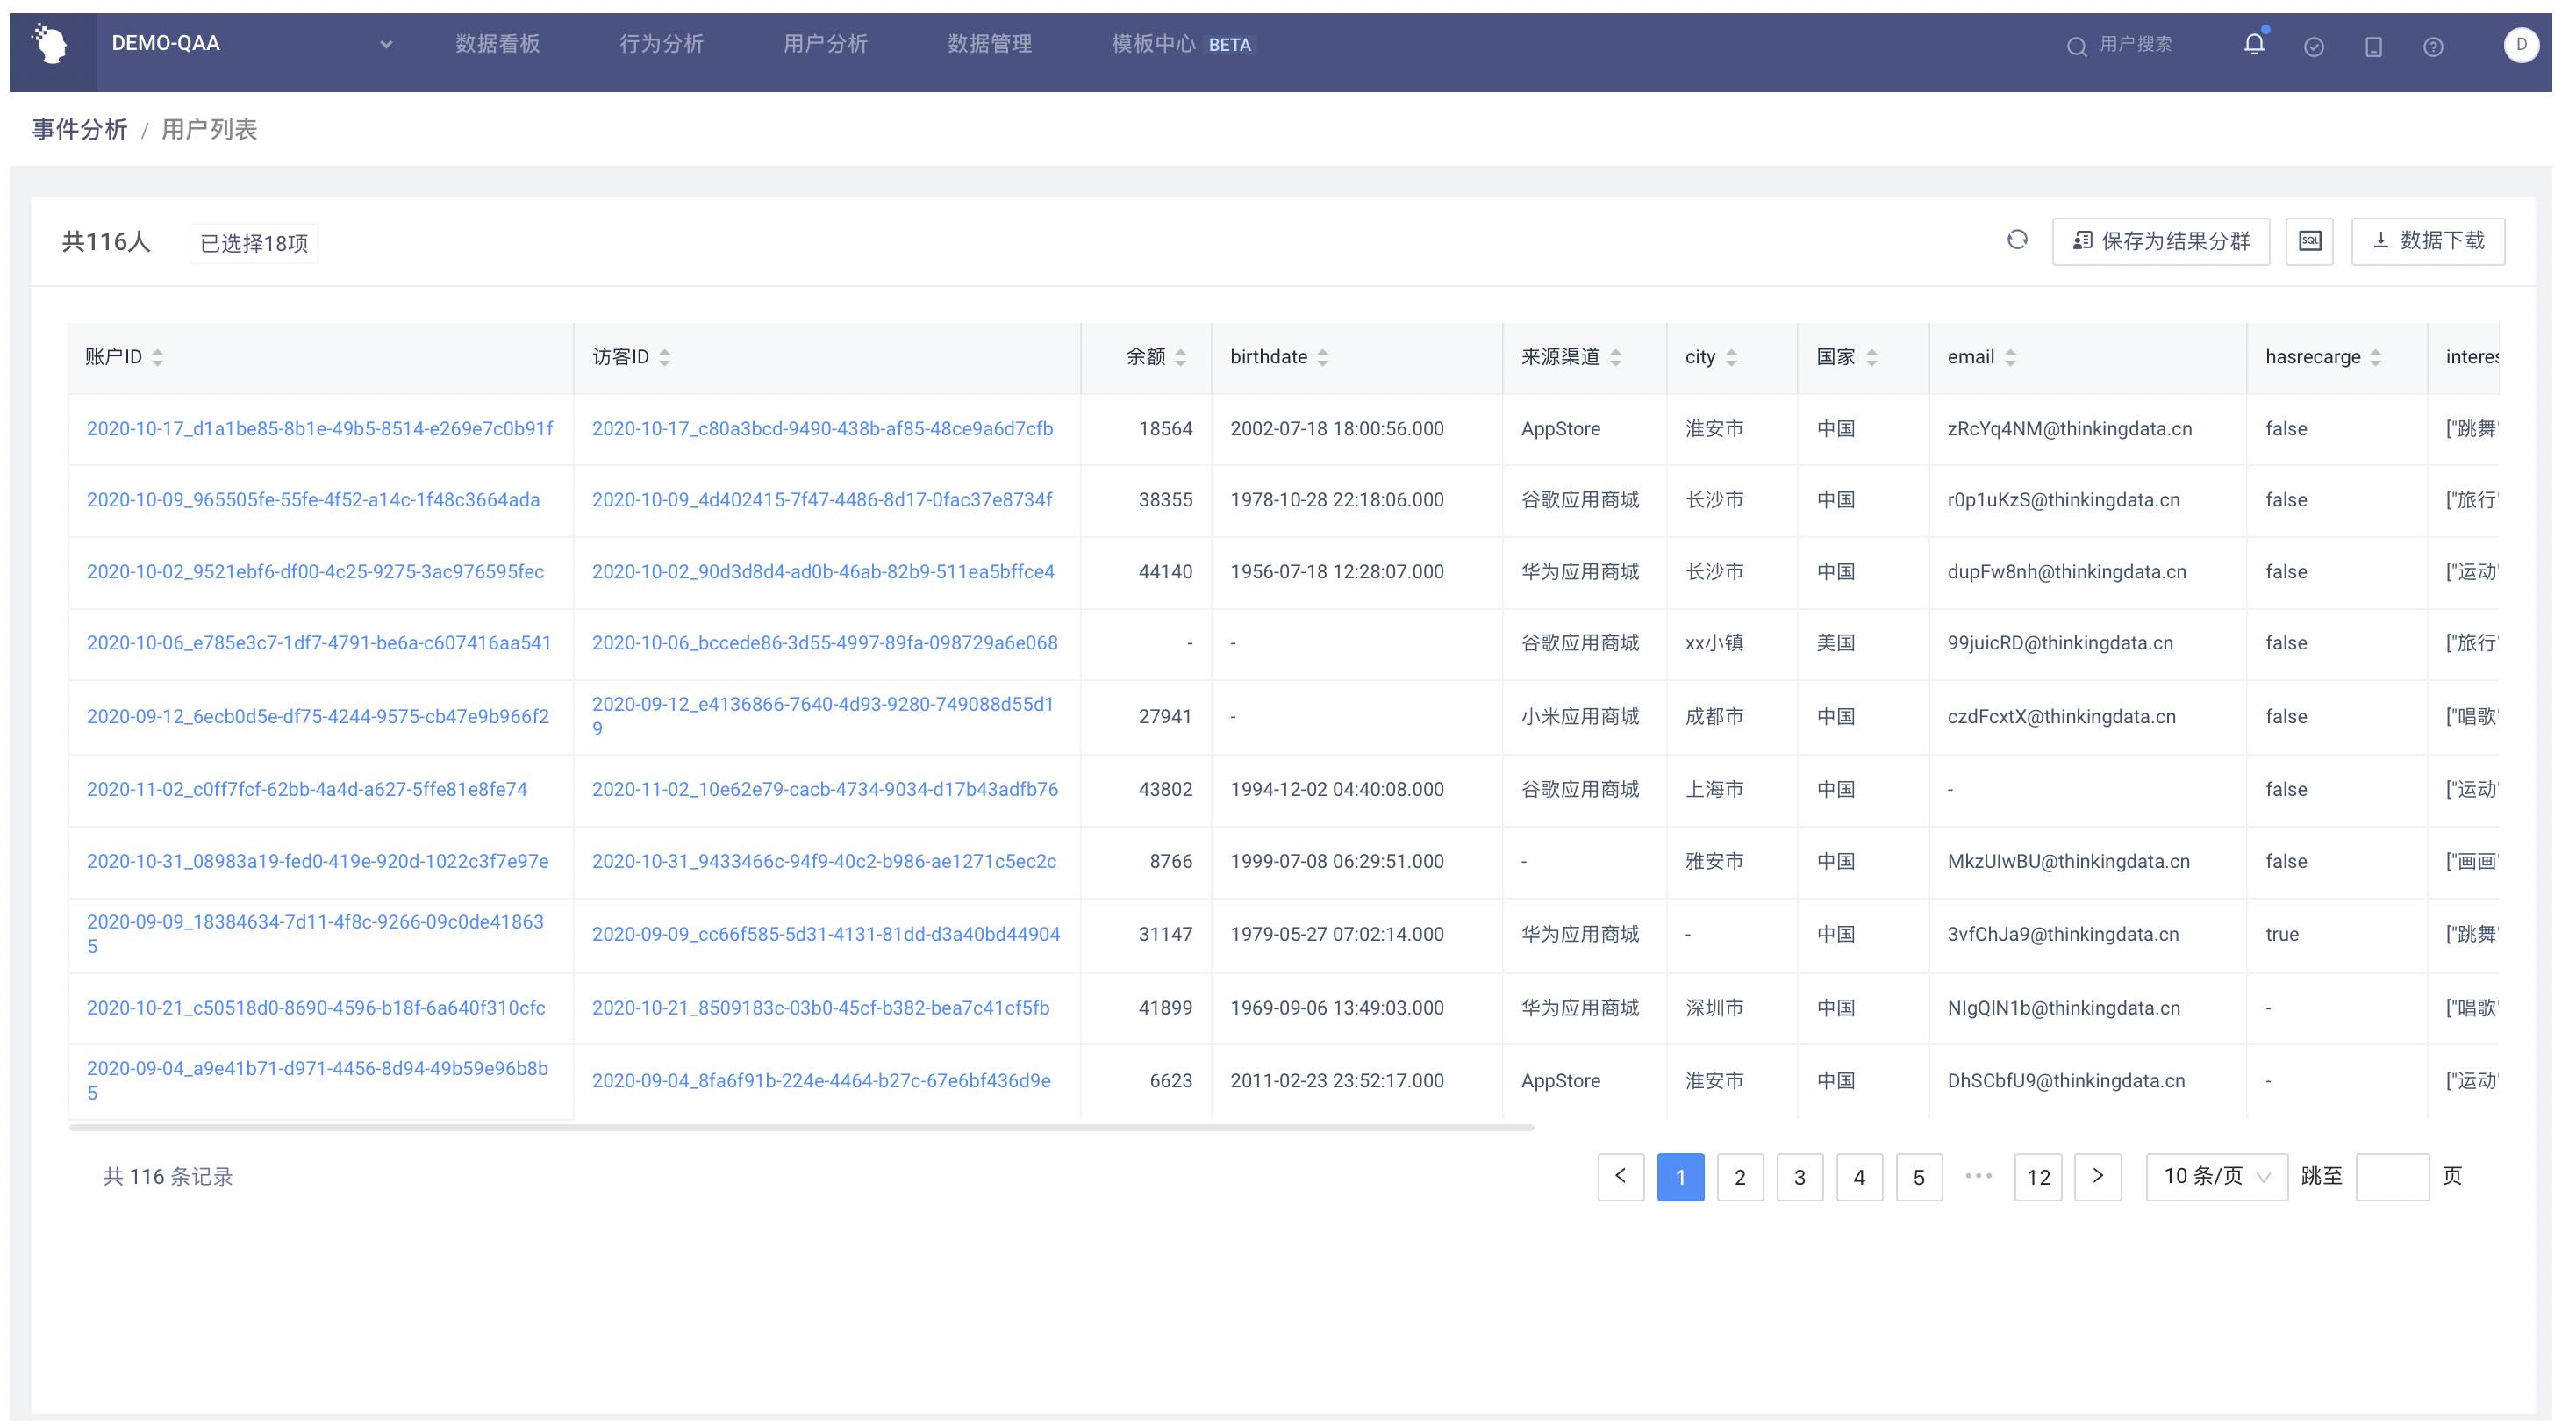
To view the sequence of user behaviors, first you need to click in the calculation results of the model to enter the user list, and then you can enter the sequence of user behaviors of the selected user by clicking on the unique identification ID in the user list. The following are the main entrances:
The analysis dimension in the event analysis model is the ‘User List’ page for ‘Number of Triggered Users’
View the User List page for ‘Number of Retained, Number of Lost’ in the retention analysis model
View User List page for ‘Conversion Number, Loss Numbe’ in Funnel Analysis Model
View the User List page for the number of people in each interval in the Distribution Analysis Model
View the User Details page of 'Node Information' in the Path Analysis Model
View User List page of 'User Groups' and 'User Tags'.
| Major category | Specific content | Company Supervisor | Administrator | Analyst | Ordinary members |
|---|---|---|---|---|---|
| User behavior sequence | Behavior sequence view, add, edit | ● | ● | ▲ | △ |
Permission description:
● Role must have
▲ The role has the permission by default, but can revoke
△ The role is not available by default, but can be authorized
○ Role must not have
# III. Overview of User Behavior Sequence Page
# IV. Usage of User Behavior Sequence
# 4.1 Composition of the User Behavior Sequence Page
# 4.1.1 Default Initial Page
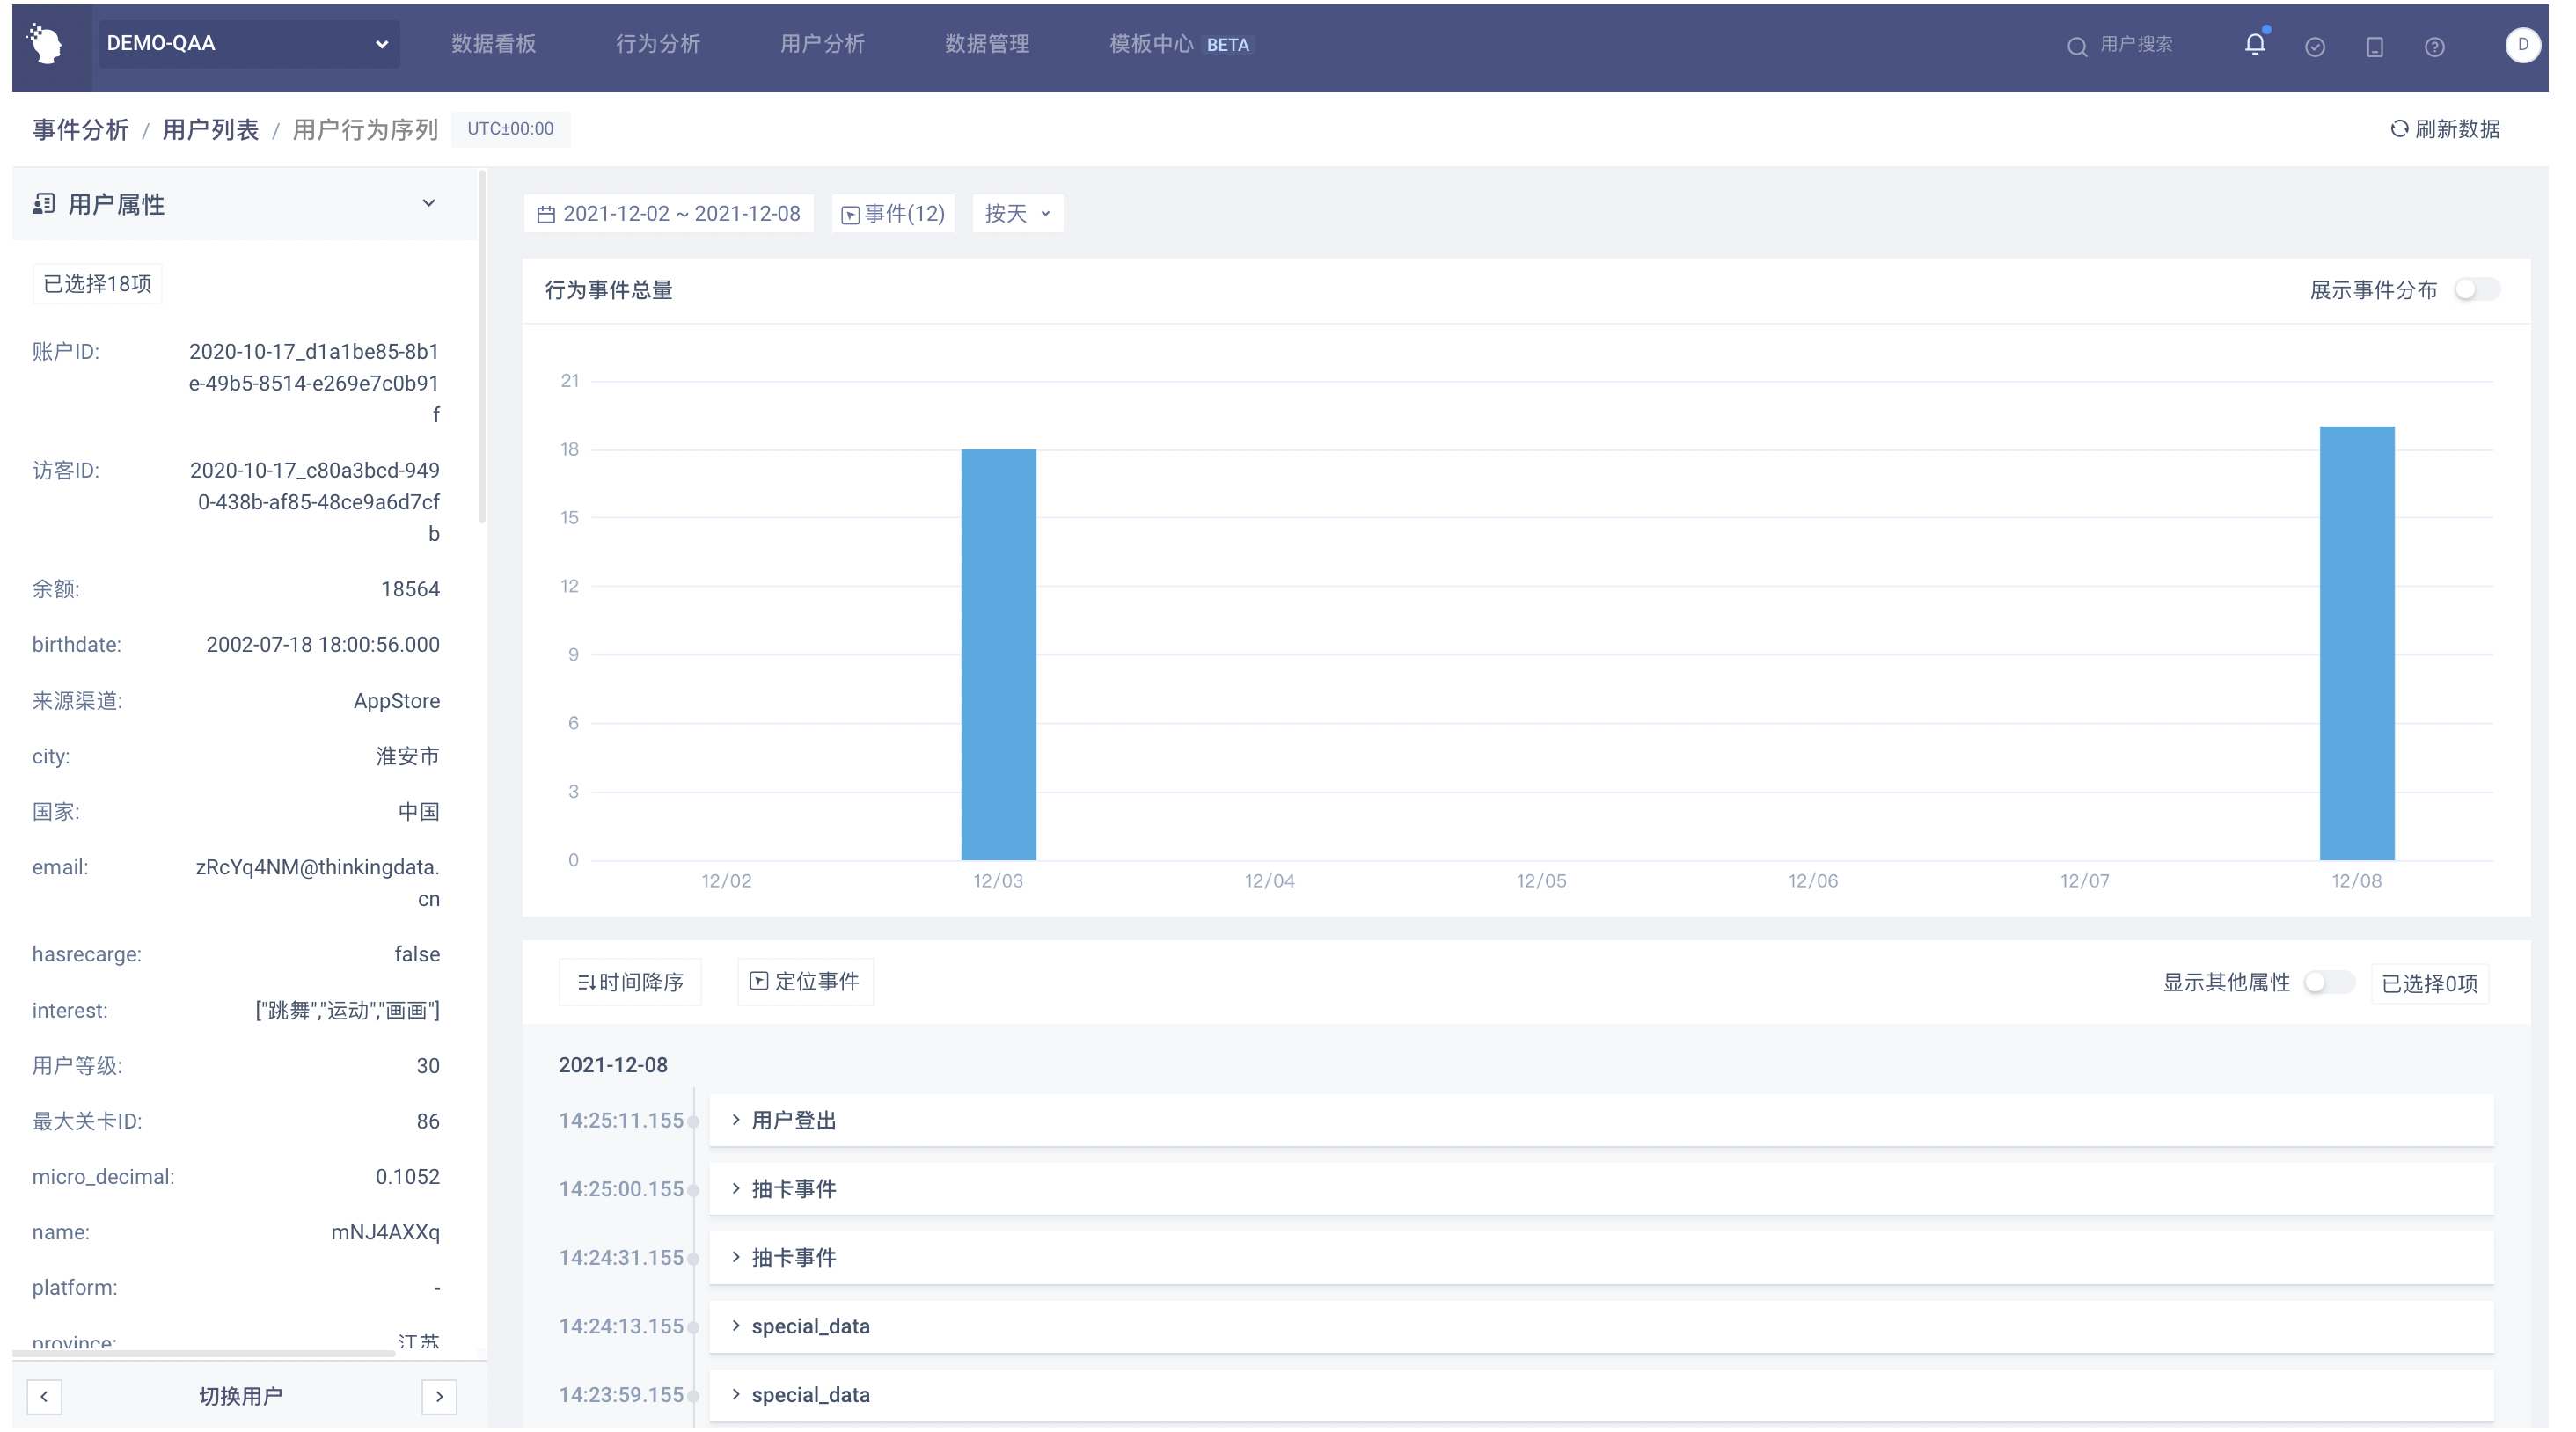
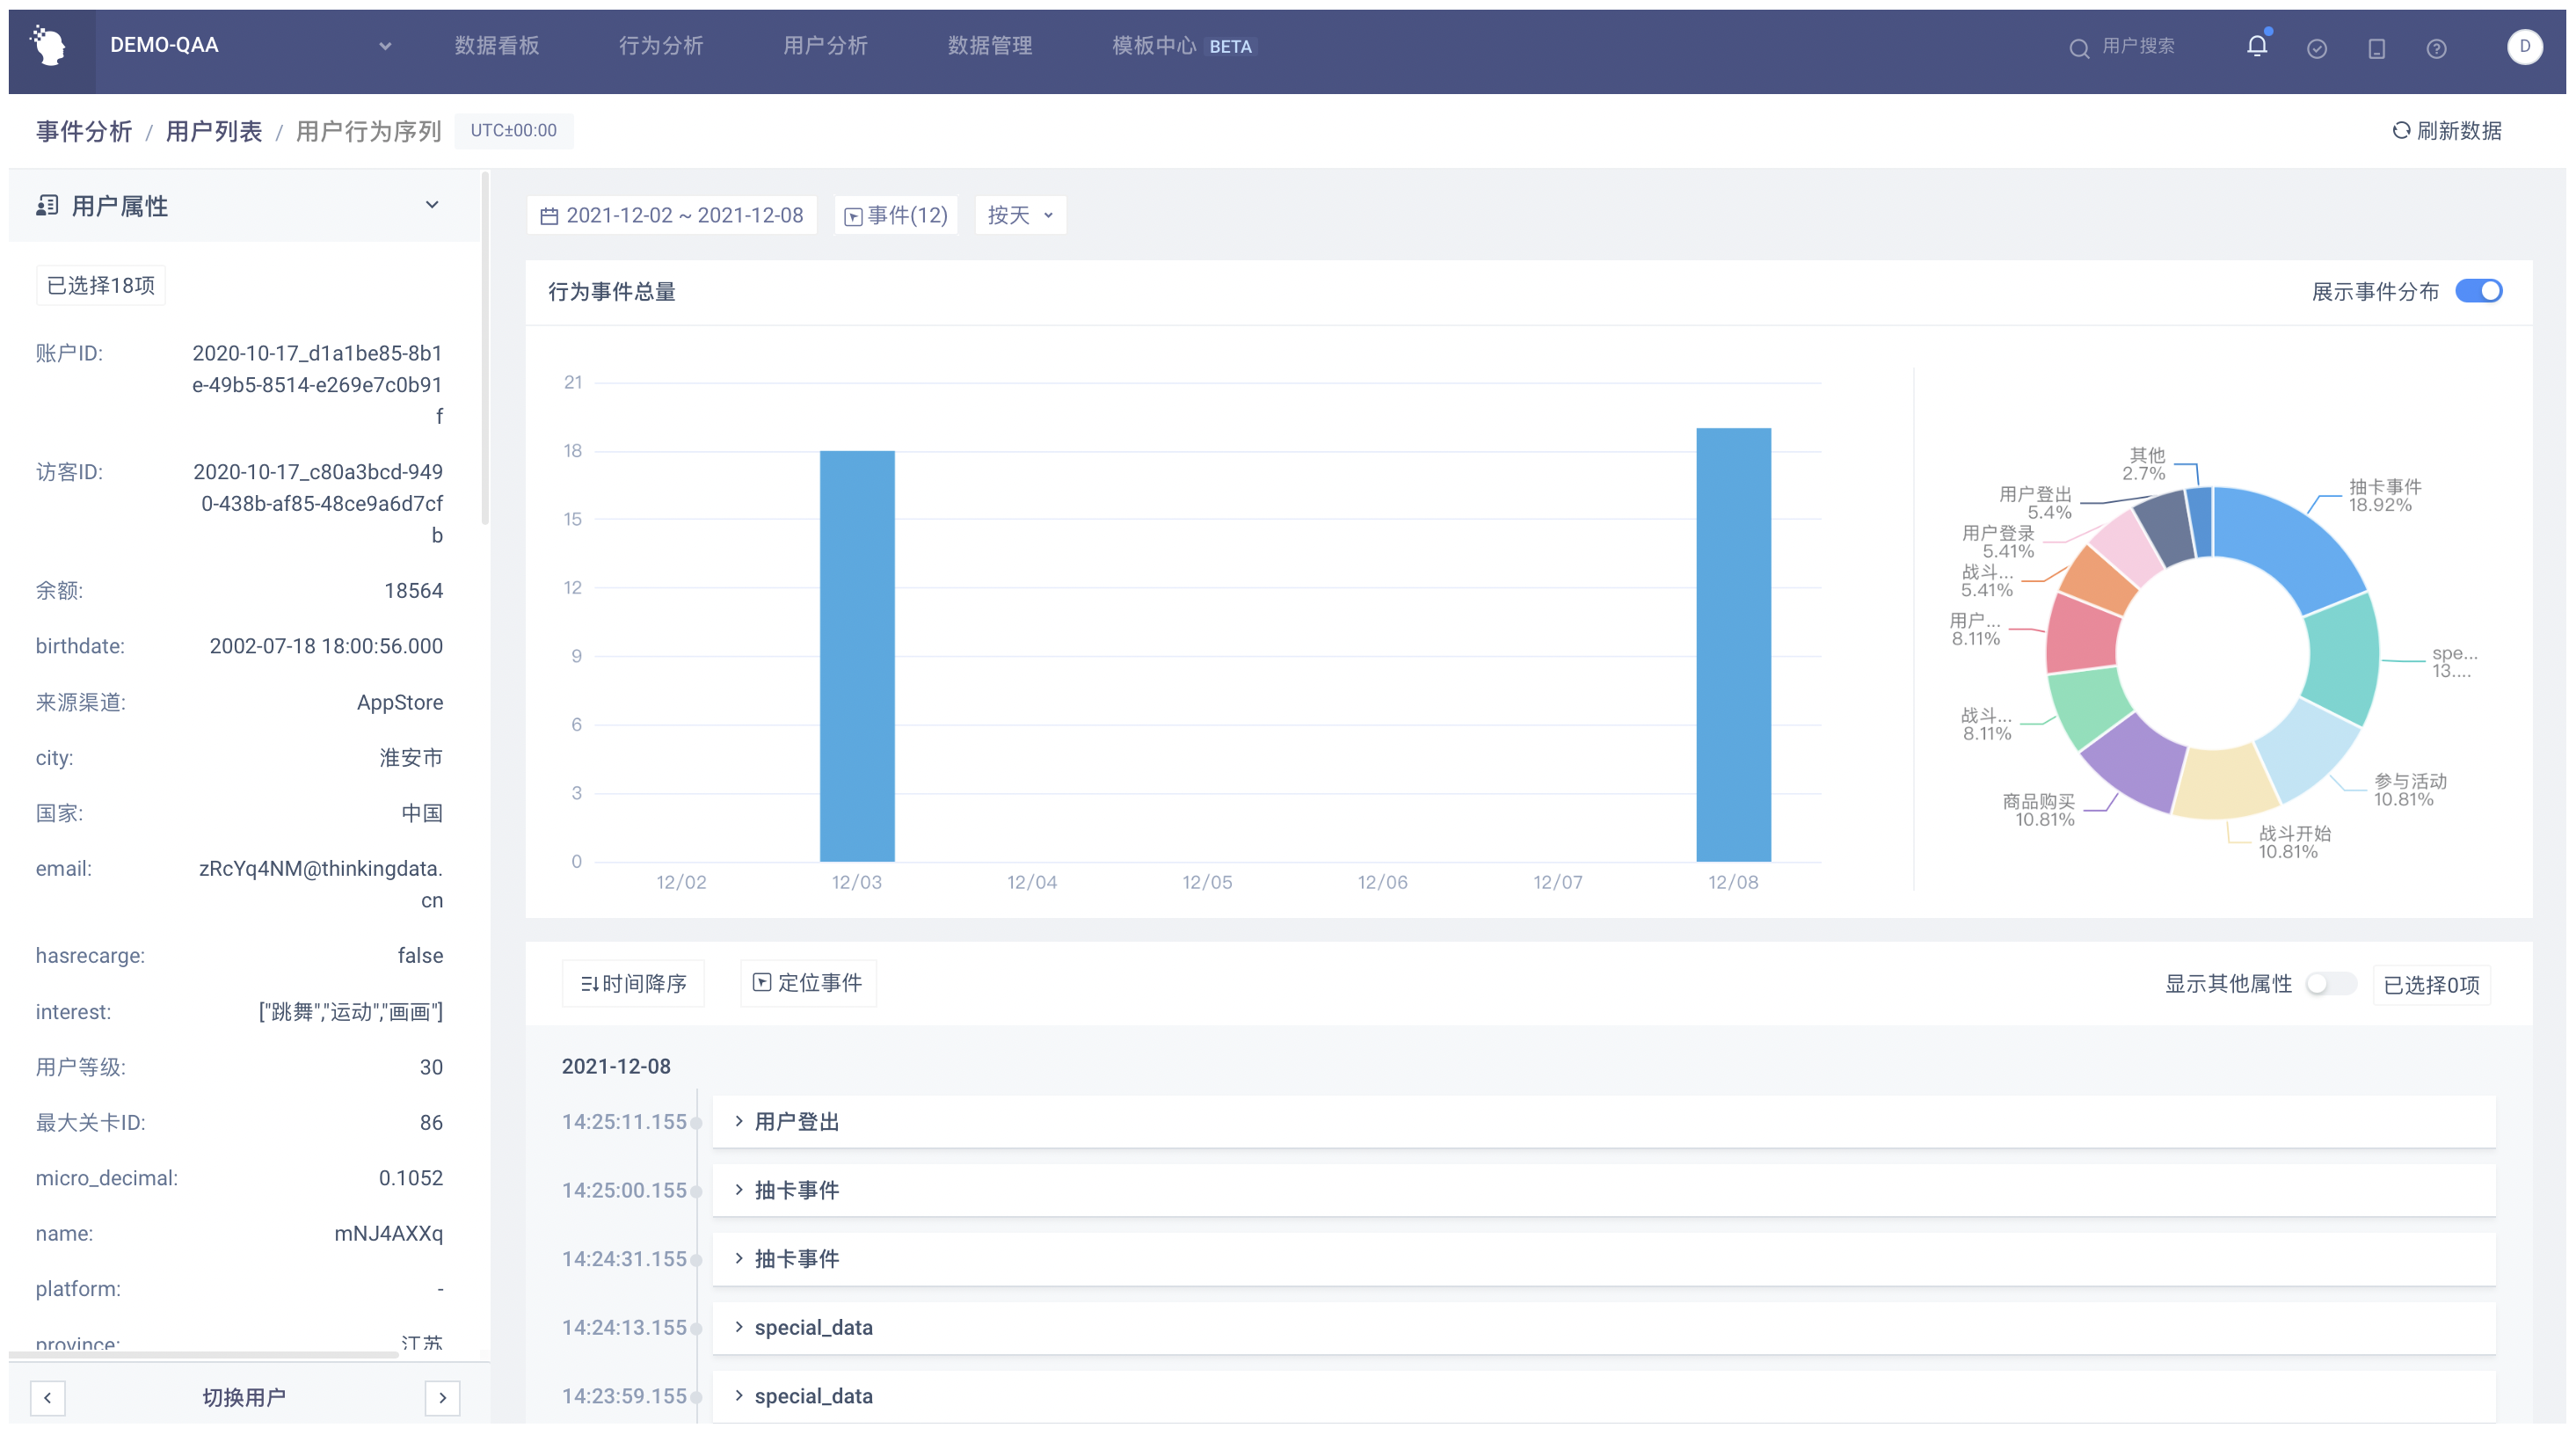
Contains user attributes area, user label area, behavioral statistics area, behavioral sequence details area, user switching area
User Attribute Area: View the user properties of the current user
User Tag Area: To view all the tags of the current user and present them as tag creation
Behavior Statistical Area: You can view how often a current user behaves based on time granularity
Behavior Sequence Detail Area: You can view the current user's specific behavior sequence and event attributes
User switching area: different user information can be switched
# 4.2 Content and Operation of User Feature Area
# 4.2.1 Filter User Features
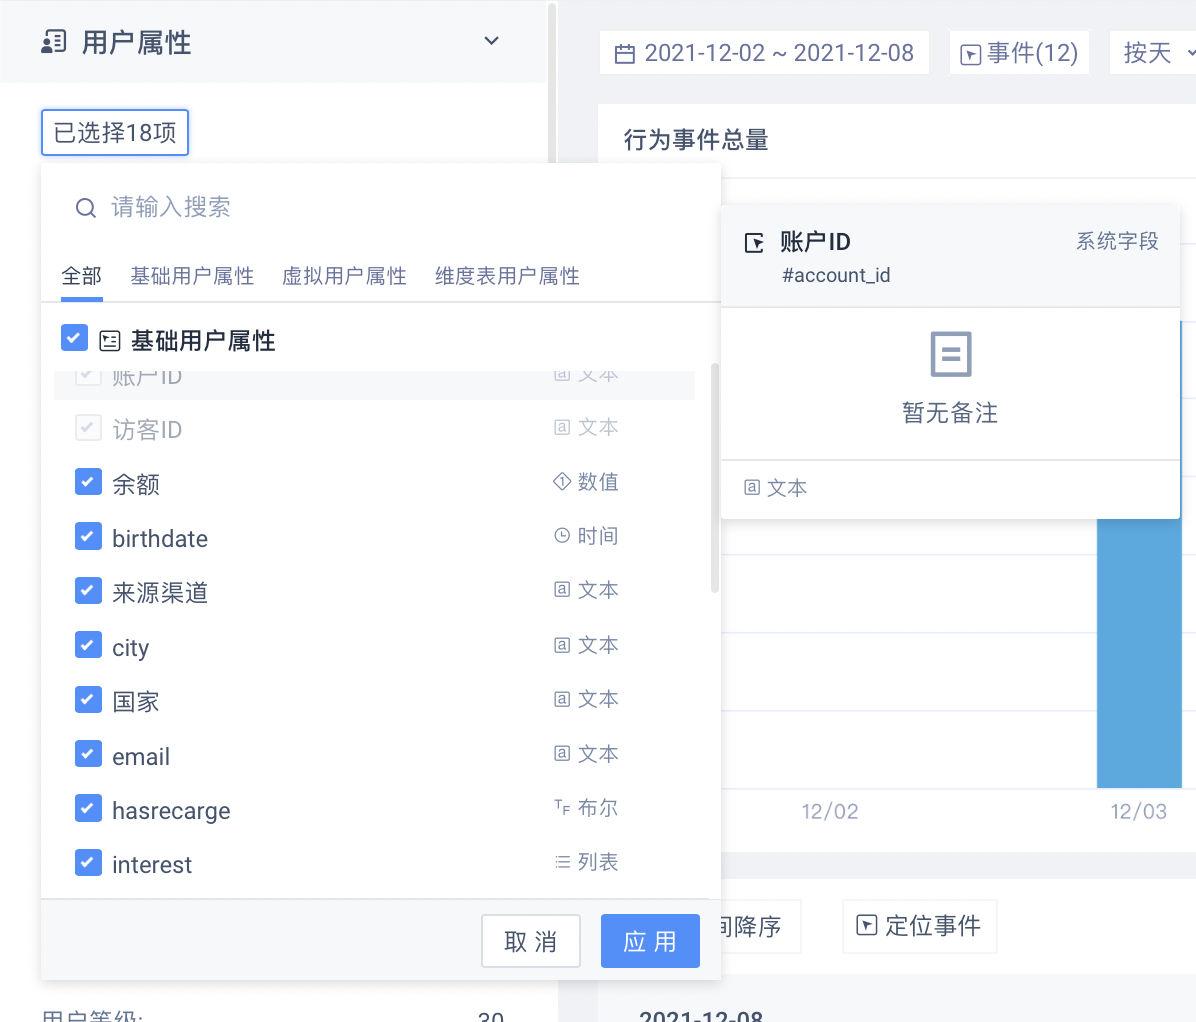
The first time you enter the user behavior sequence of a project, all the basic user features are selected by default, including preset attributes and custom attributes. You need to manually check the virtual attributes and dimension table attributes that meet the requirements.
Through the dropdown menu, you can filter the user features that need to be displayed. After filtering, the display content will be changed and saved as a personal configuration.
# 4.3 Content and Operation of the Behavioral Statistics Area
# 4.3.1 Initial page (Columnar Daily Trend)


By default, you can view a trend map of the number of behavioral events per day for nearly 7 days and switch to the overall behavioral map.
# 4.3.2 Filter Behavior Events
The first time you enter a user behavior sequence for an item, all behavior events are selected by default.
Through the dropdown menu, you can filter behavior events that need to be analyzed. After filtering, the display will be changed and saved as a personal configuration.
# 4.3.3 Set and Impact of Time Selection
By default, the time selection of 'last 7 days' is selected, and the segmentation granularity of the timeline is 'by day'. That is, the trend chart of behavior number in the past 7 days is shown.
Click to select a different date in the histogram. At this time, the date under 'behavior sequence details' is anchored to the corresponding day.
The segmentation granularity of the timeline is 'by day', 'by week' and 'by month' (natural month).
# 4.3.4 Calculation of Trend and Distribution Charts
Chart only computes cases of filtered events
- The trend chart will show the behavior statistics at each time interval
- The distribution map will show the distribution over the entire time interval, showing it by percentage, and providing data tables
# 4.4 Content and Operation of Sequence Details
# 4.4.1 Initial and Event Deployment Pages
The initial date is 'the last date with data in the date selection box' which is equivalent to selecting this date.
Select the analysis interval as 'by day' and only look at the data situation of the world where the selection is located.
Select the analysis interval as 'by week', only the data of each day in the selected week can be seen, and the data of other days in the current week can be supported by scrolling through the roller.
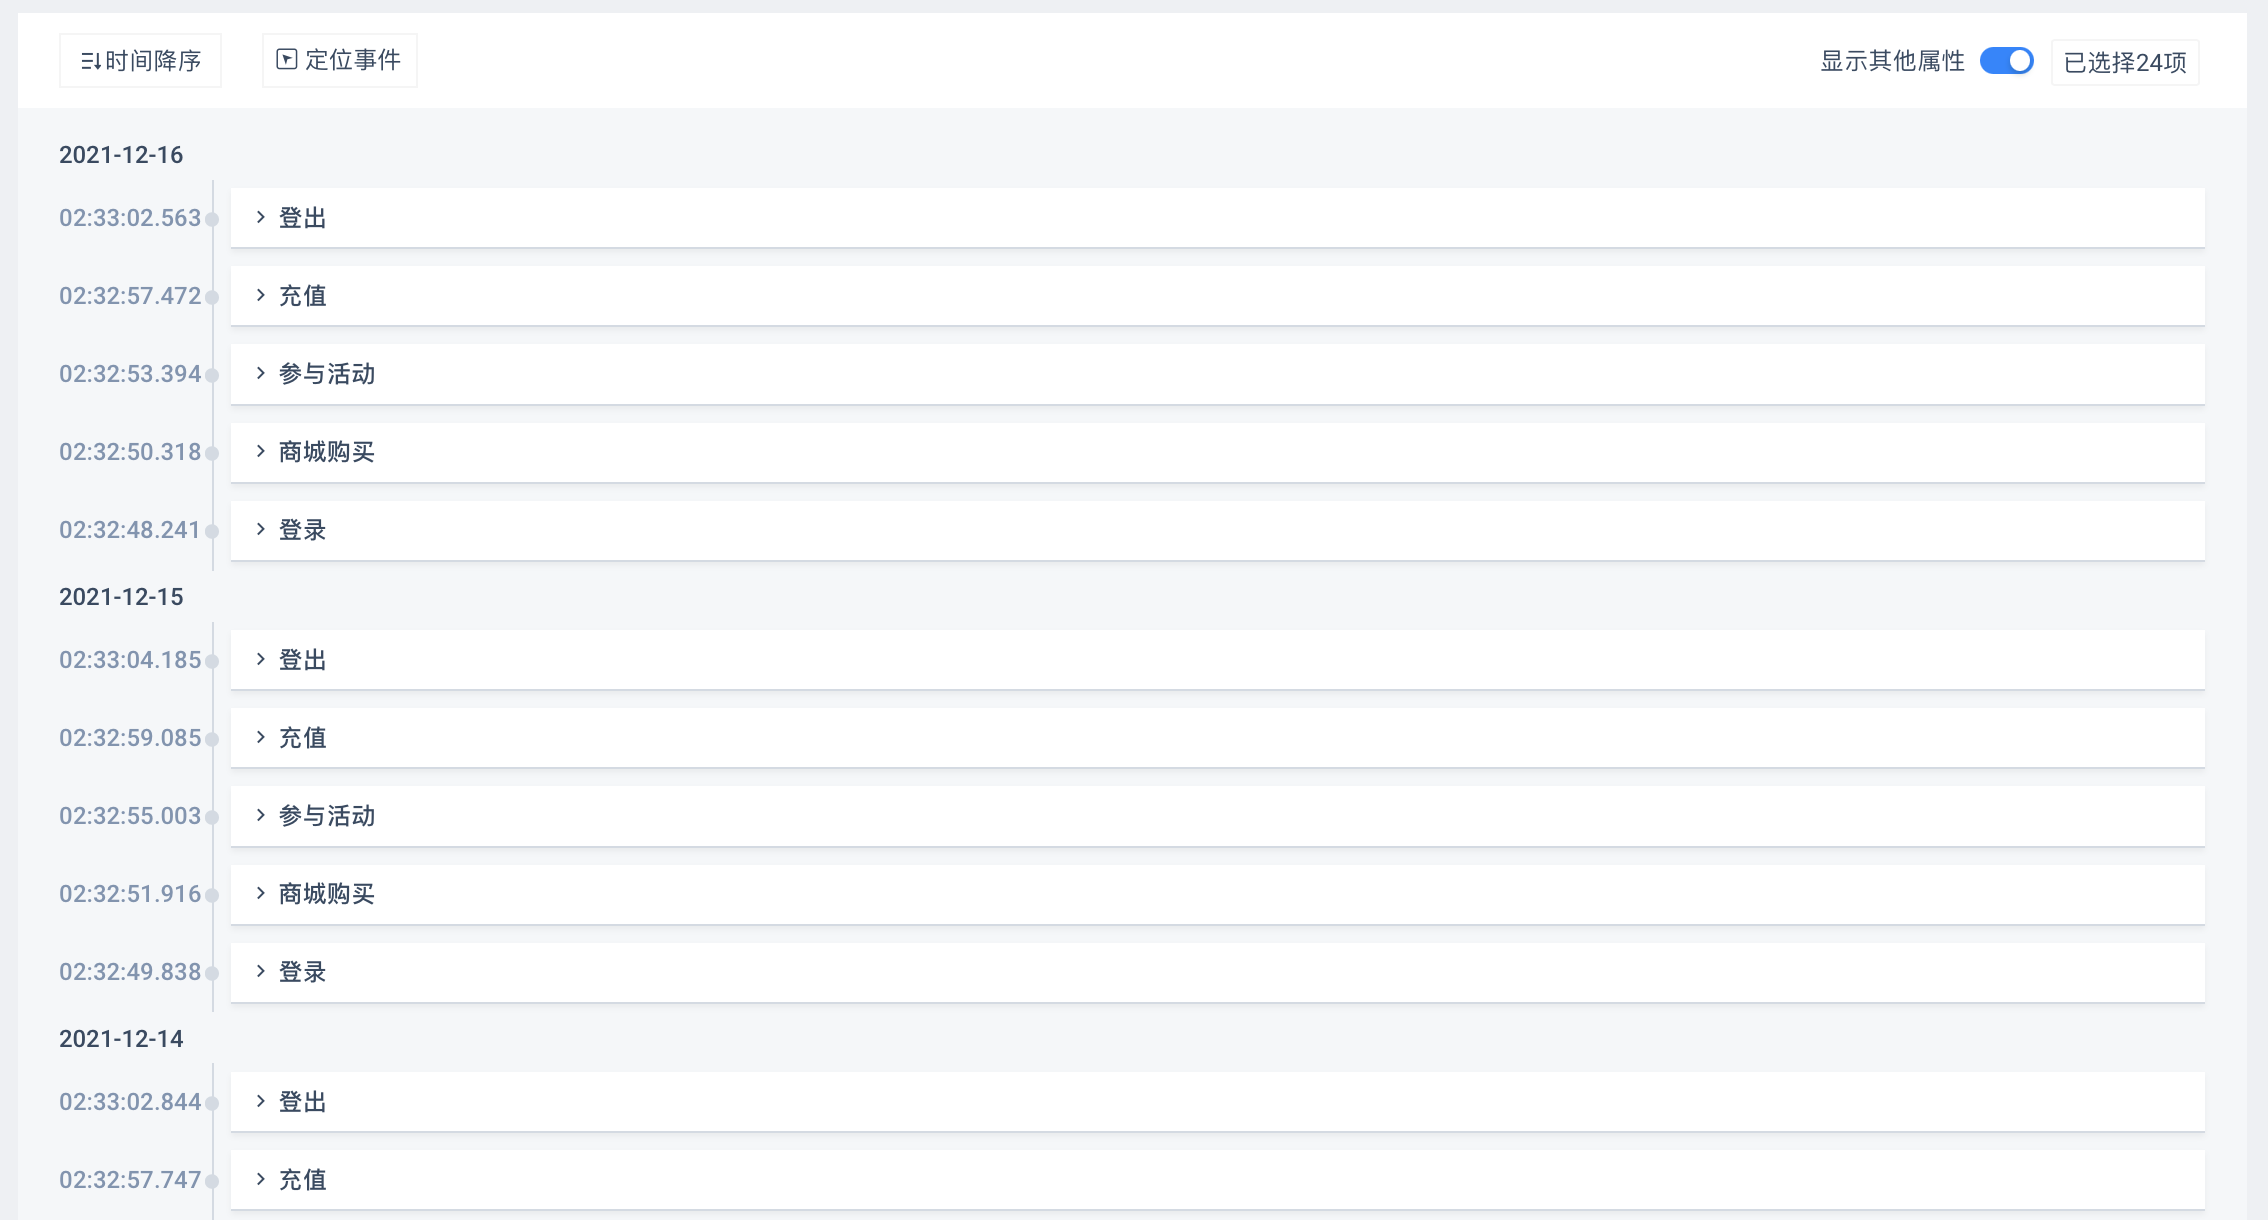
# 4.4.2 Expand Event Details to View Event Attrinutes
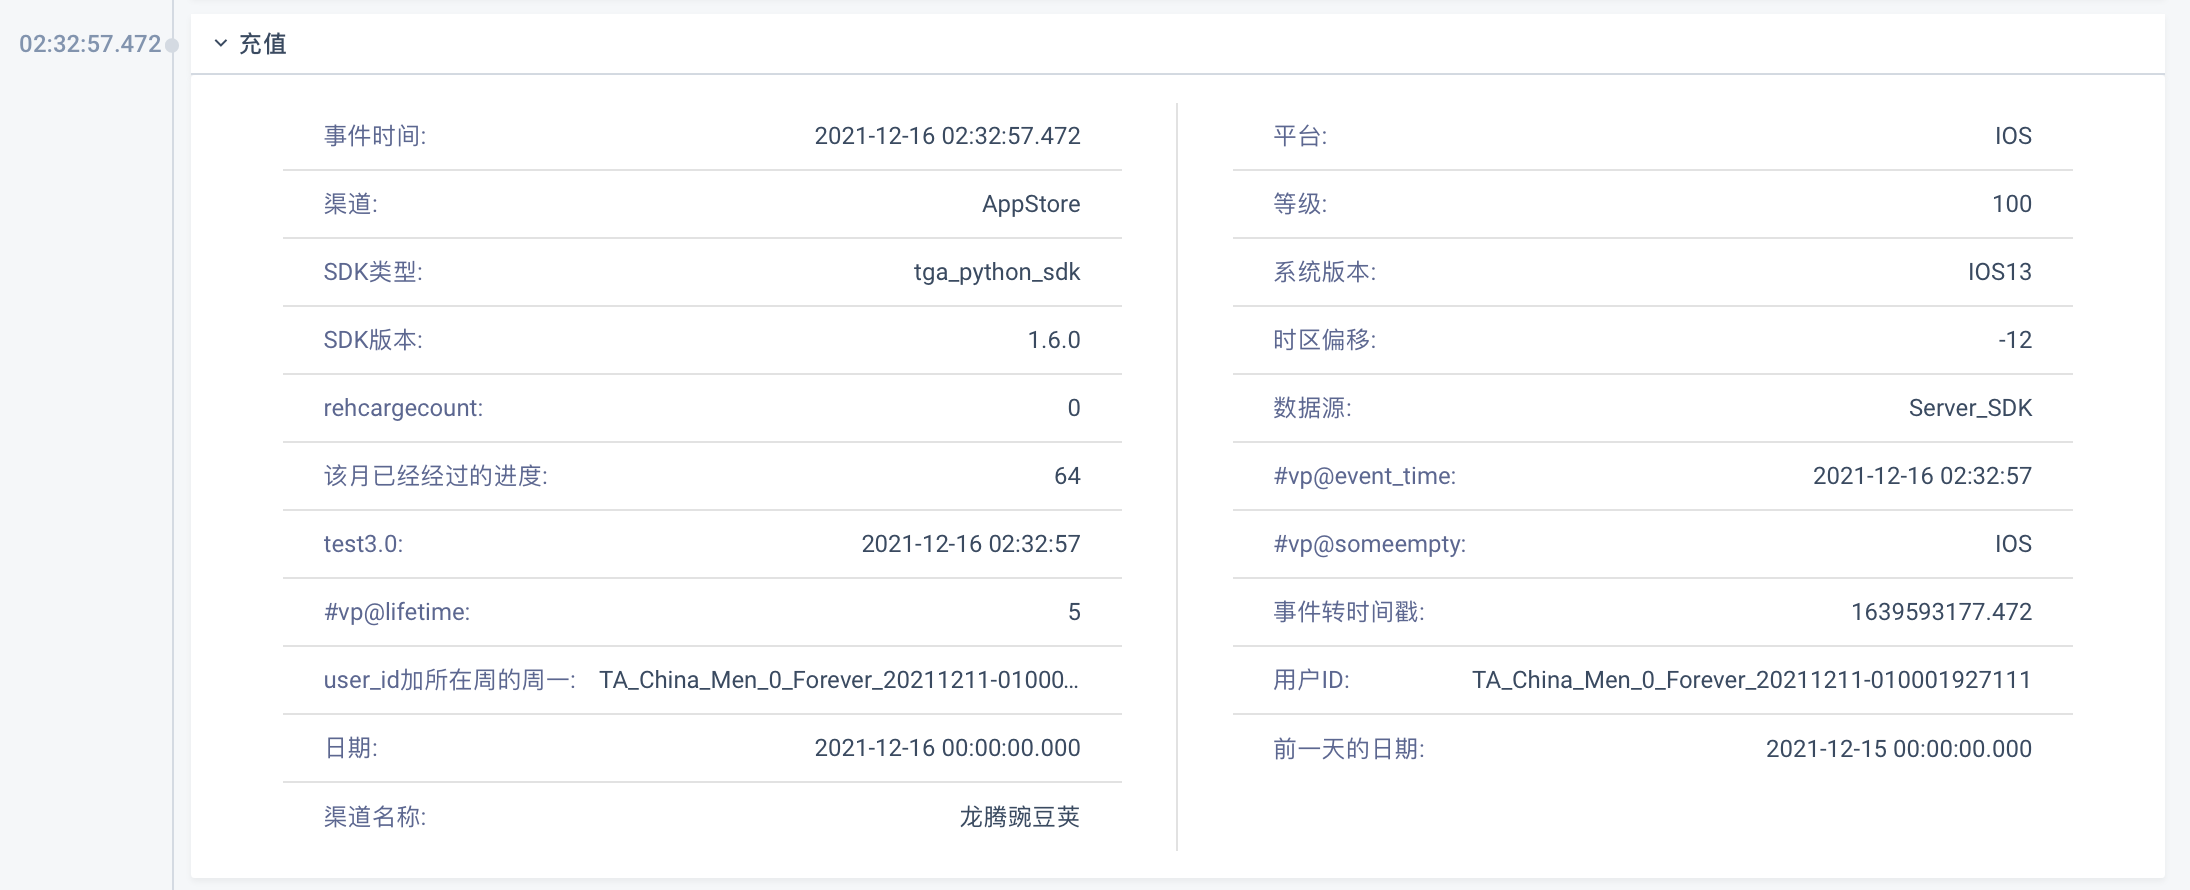
With the 'Expand' icon, all event attributes under that event are expanded and arranged in two columns.
# 4.4.2.1 Select More Attributes
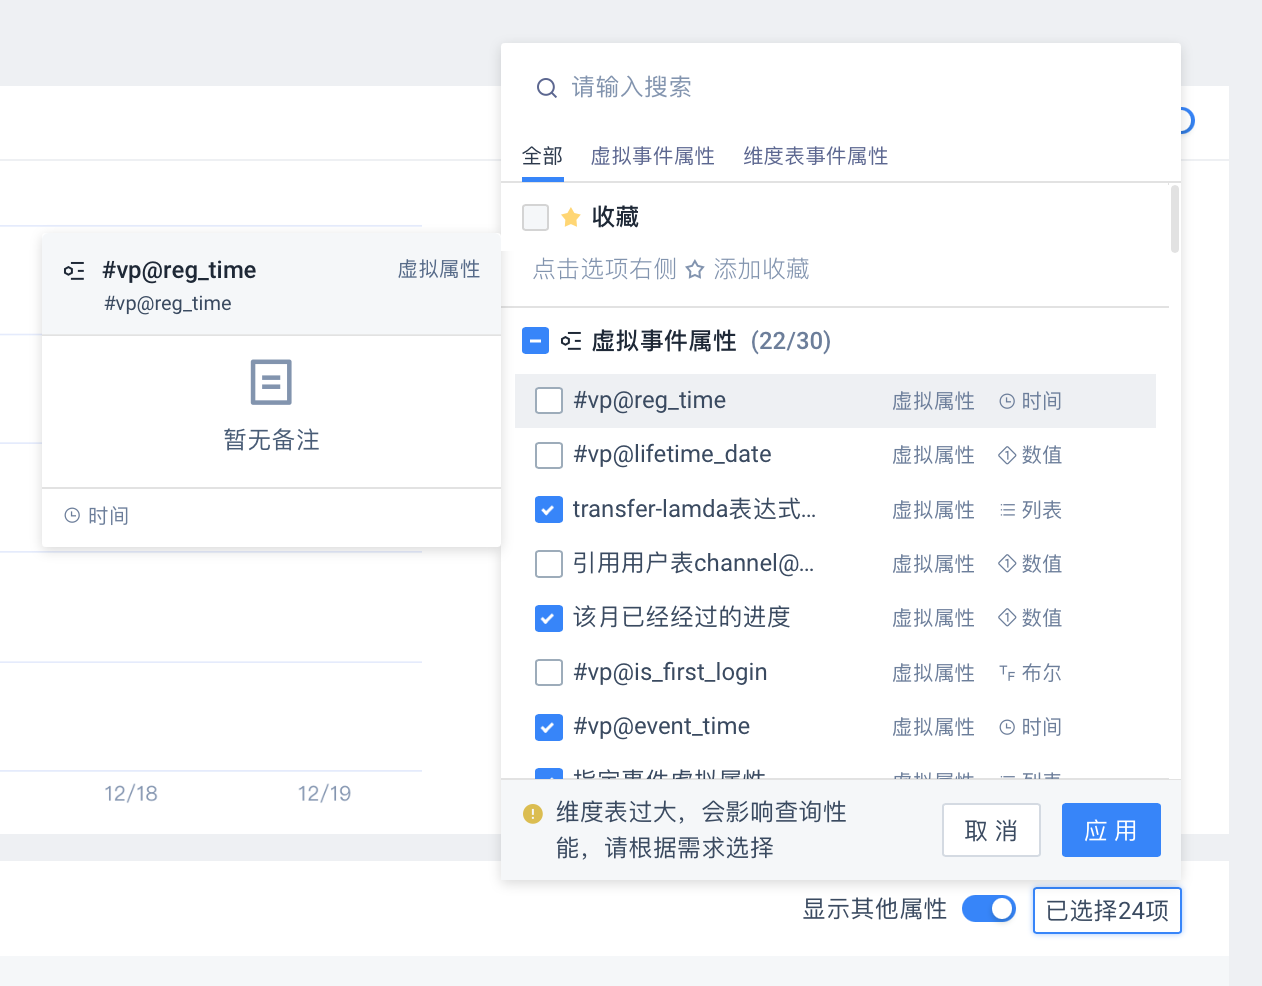
By default, all reporting attributes of the current event are displayed in the sequence of behaviors, including preset and virtual attributes. To view the virtual attributes and dimension table attributes set in the TA system, open Show More Attributes and find the target attributes.
You can select all virtual attributes and dimension table attributes by one button. If there are more than 30 such attributes, the first 30 are checked by default. Selected virtual attributes and dimension table attributes appear in the corresponding event details.
# 4.4.3 Set Attribute Explicit
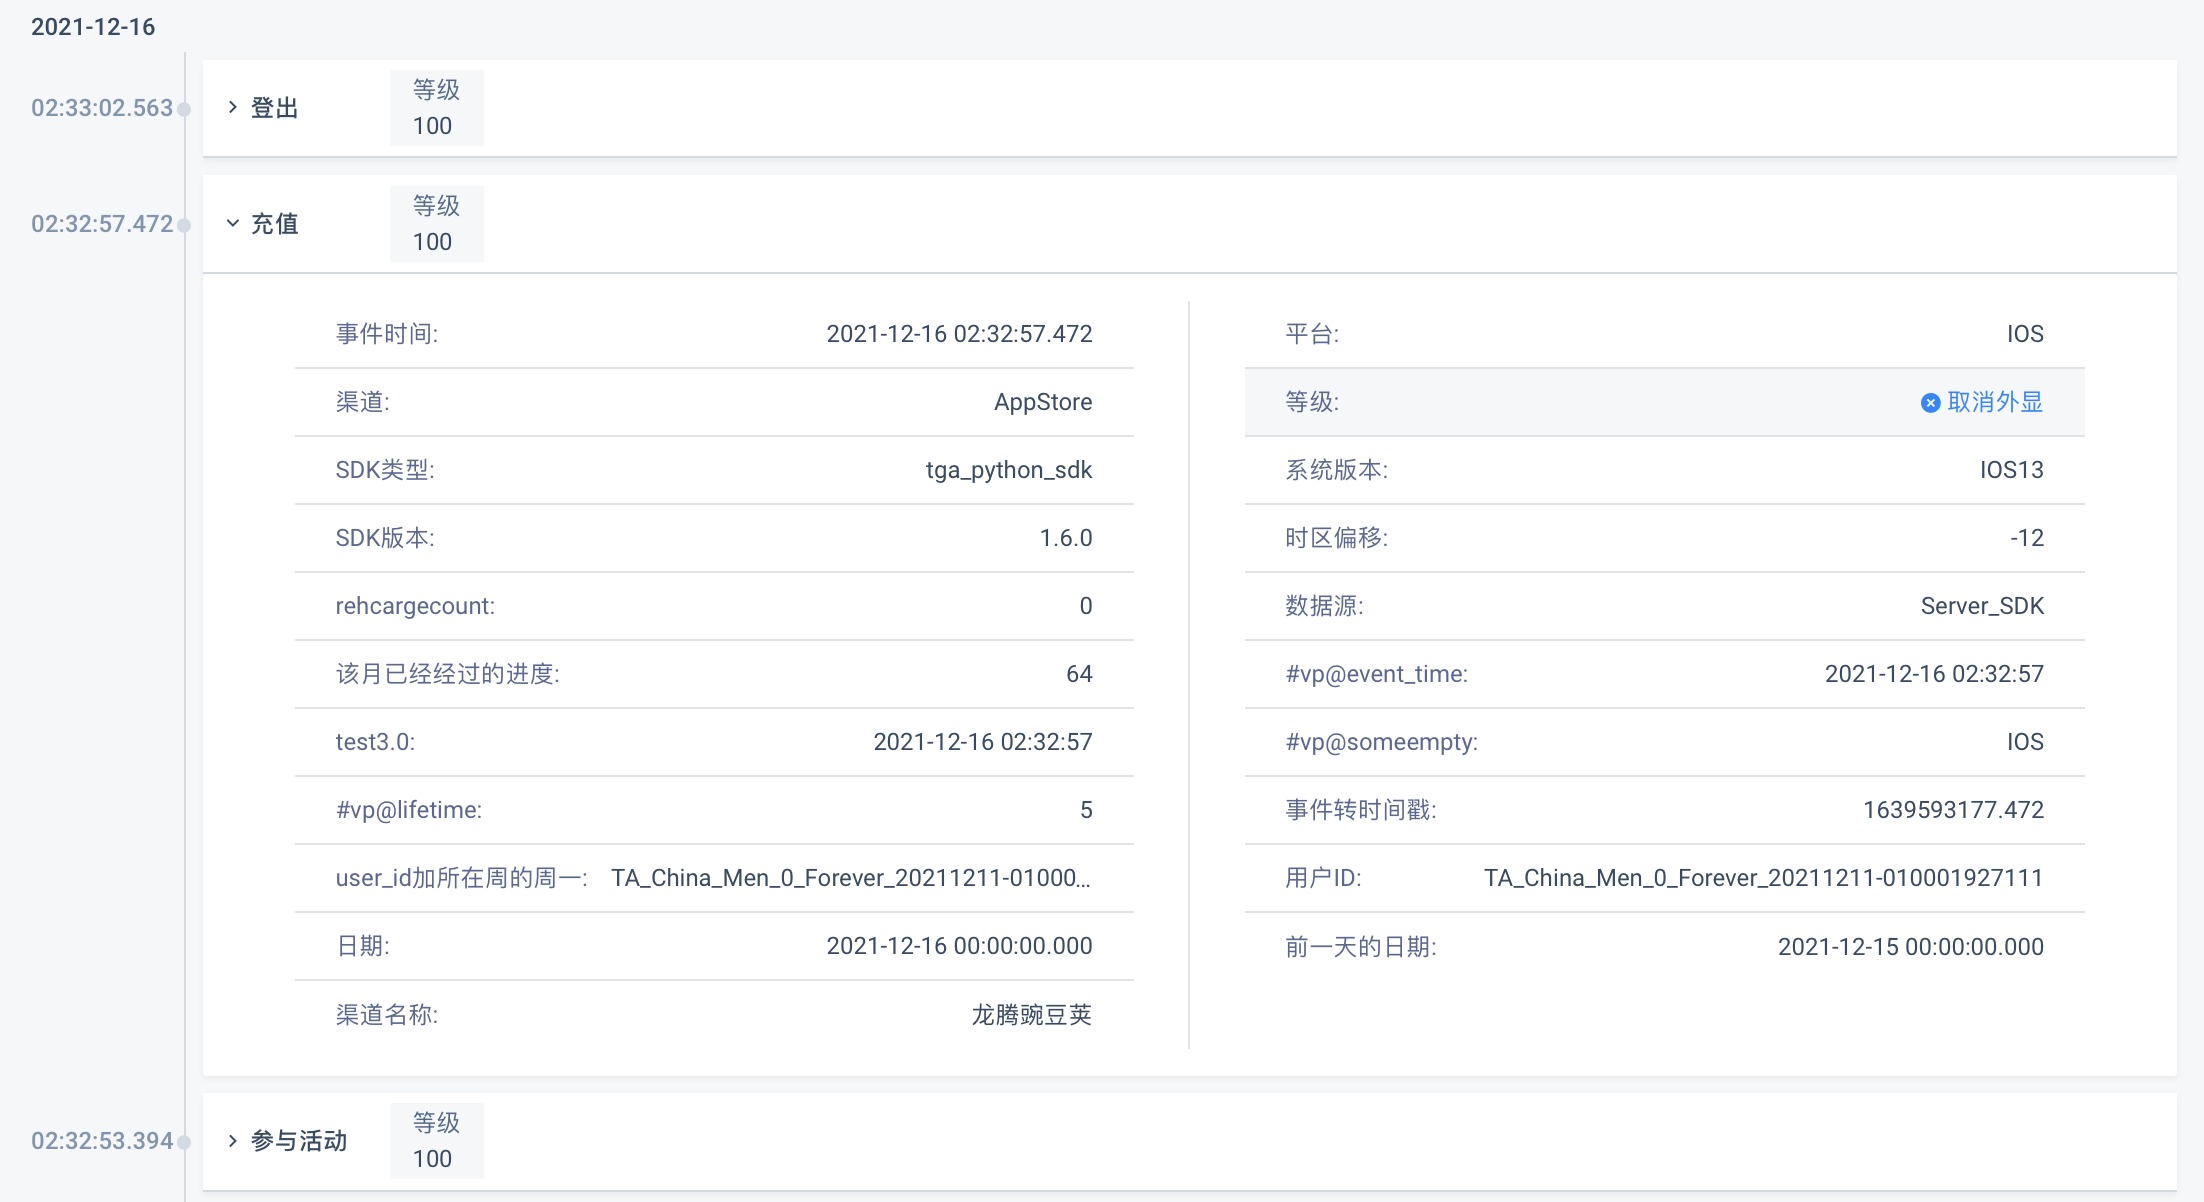
- After expanding event details, you can set an event attribute to an explicit attribute by hovering over it with the mouse, and then you can view the value of the attribute after the event name without expanding event details. Explicit attributes can be used to view how the same attribute changes in different events.
- Hovering the attribute again cancels its appearance.
- Explicit attributes act on all events that have them, and events without them will not see them.
- To cancel an explicit attribute, either click Cancel at the explicit location after the event name or click 'Cancel' at the event details from that attribute.
# 4.4.4 Locate Events and Check Behaviors Before and After

The time series will display all the events of the user within the event range. If you only want to see the results of a certain event, you can select 'Locate Event'.
When further filtering of positioning events is needed, select 'Attribute Filtering' for more accurate queries.
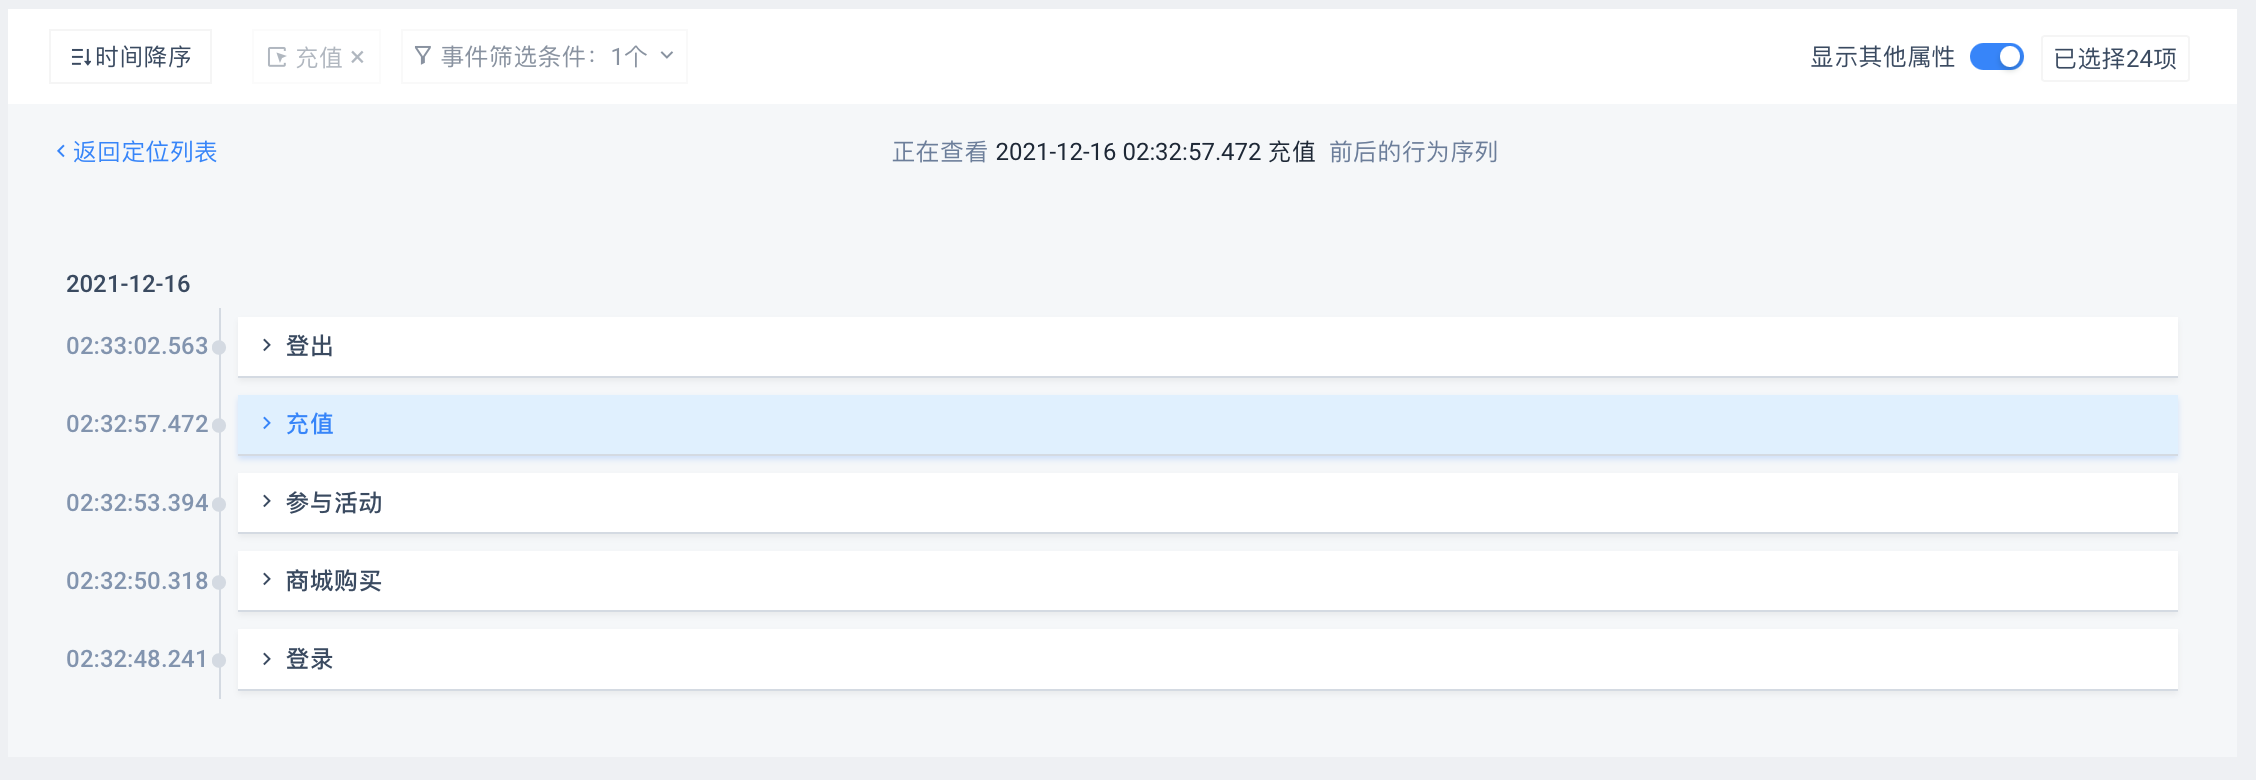
You can view 'Before and After Behavior' to understand the pre-order and post-order events of the event. After viewing, you can return to the list of 'Locating Events'.
# 4.4.5 Operation Related to Switching Date
- You can quickly switch the selected date by clicking on the column of the trend histogram in the 'Behavior Statistics Area'
- When the analysis interval is 'by week"' and 'by month', click on the column to show the data of 'current week' and 'current month', but still split by day.
- Date toggle range is consistent with time check box
- When analyzing intervals of 'by week' and 'by month', you can scroll through the roller to switch between the contents of 'Details of Behavior Sequence' or the date of the switch.
# 4.5 Switch User Operation

Up to 1,000 users in the user list are displayed, and users and corresponding information are switched sequentially by turning pages up and down.
# 4.6 Navigation Return Operation
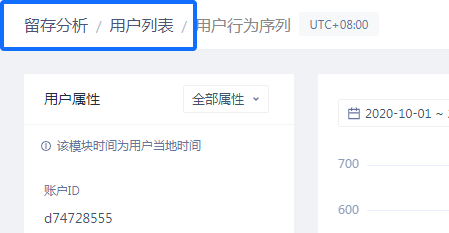
Click on the corresponding module to return to the model condition page or user list page.
# V. Best Applications
# 5.1 Understand User Behaviors at the Micro Level
The sequence of user behaviors is the only analytical model to view detailed user behaviors from the user dimension. Through the sequence of user behaviors, the analyst can understand the user's behaviors from the most micro perspective. Combining with the quantitative analysis results of the analysis model, we can more specifically understand the reasons for the specific behaviors of users and observe which behaviors may have an impact on the specific behaviors, so that the subsequent analysis can be organized.
