# Exploration Module
The exploration module provides the ability to drill down dashboard reports in detail. Through the exploration module, users can add filtering conditions or adjust groupings to any report separately, which is suitable for in-depth analysis of important data or metrics.
# 1.Exploration Module Entrance and Role Permissions
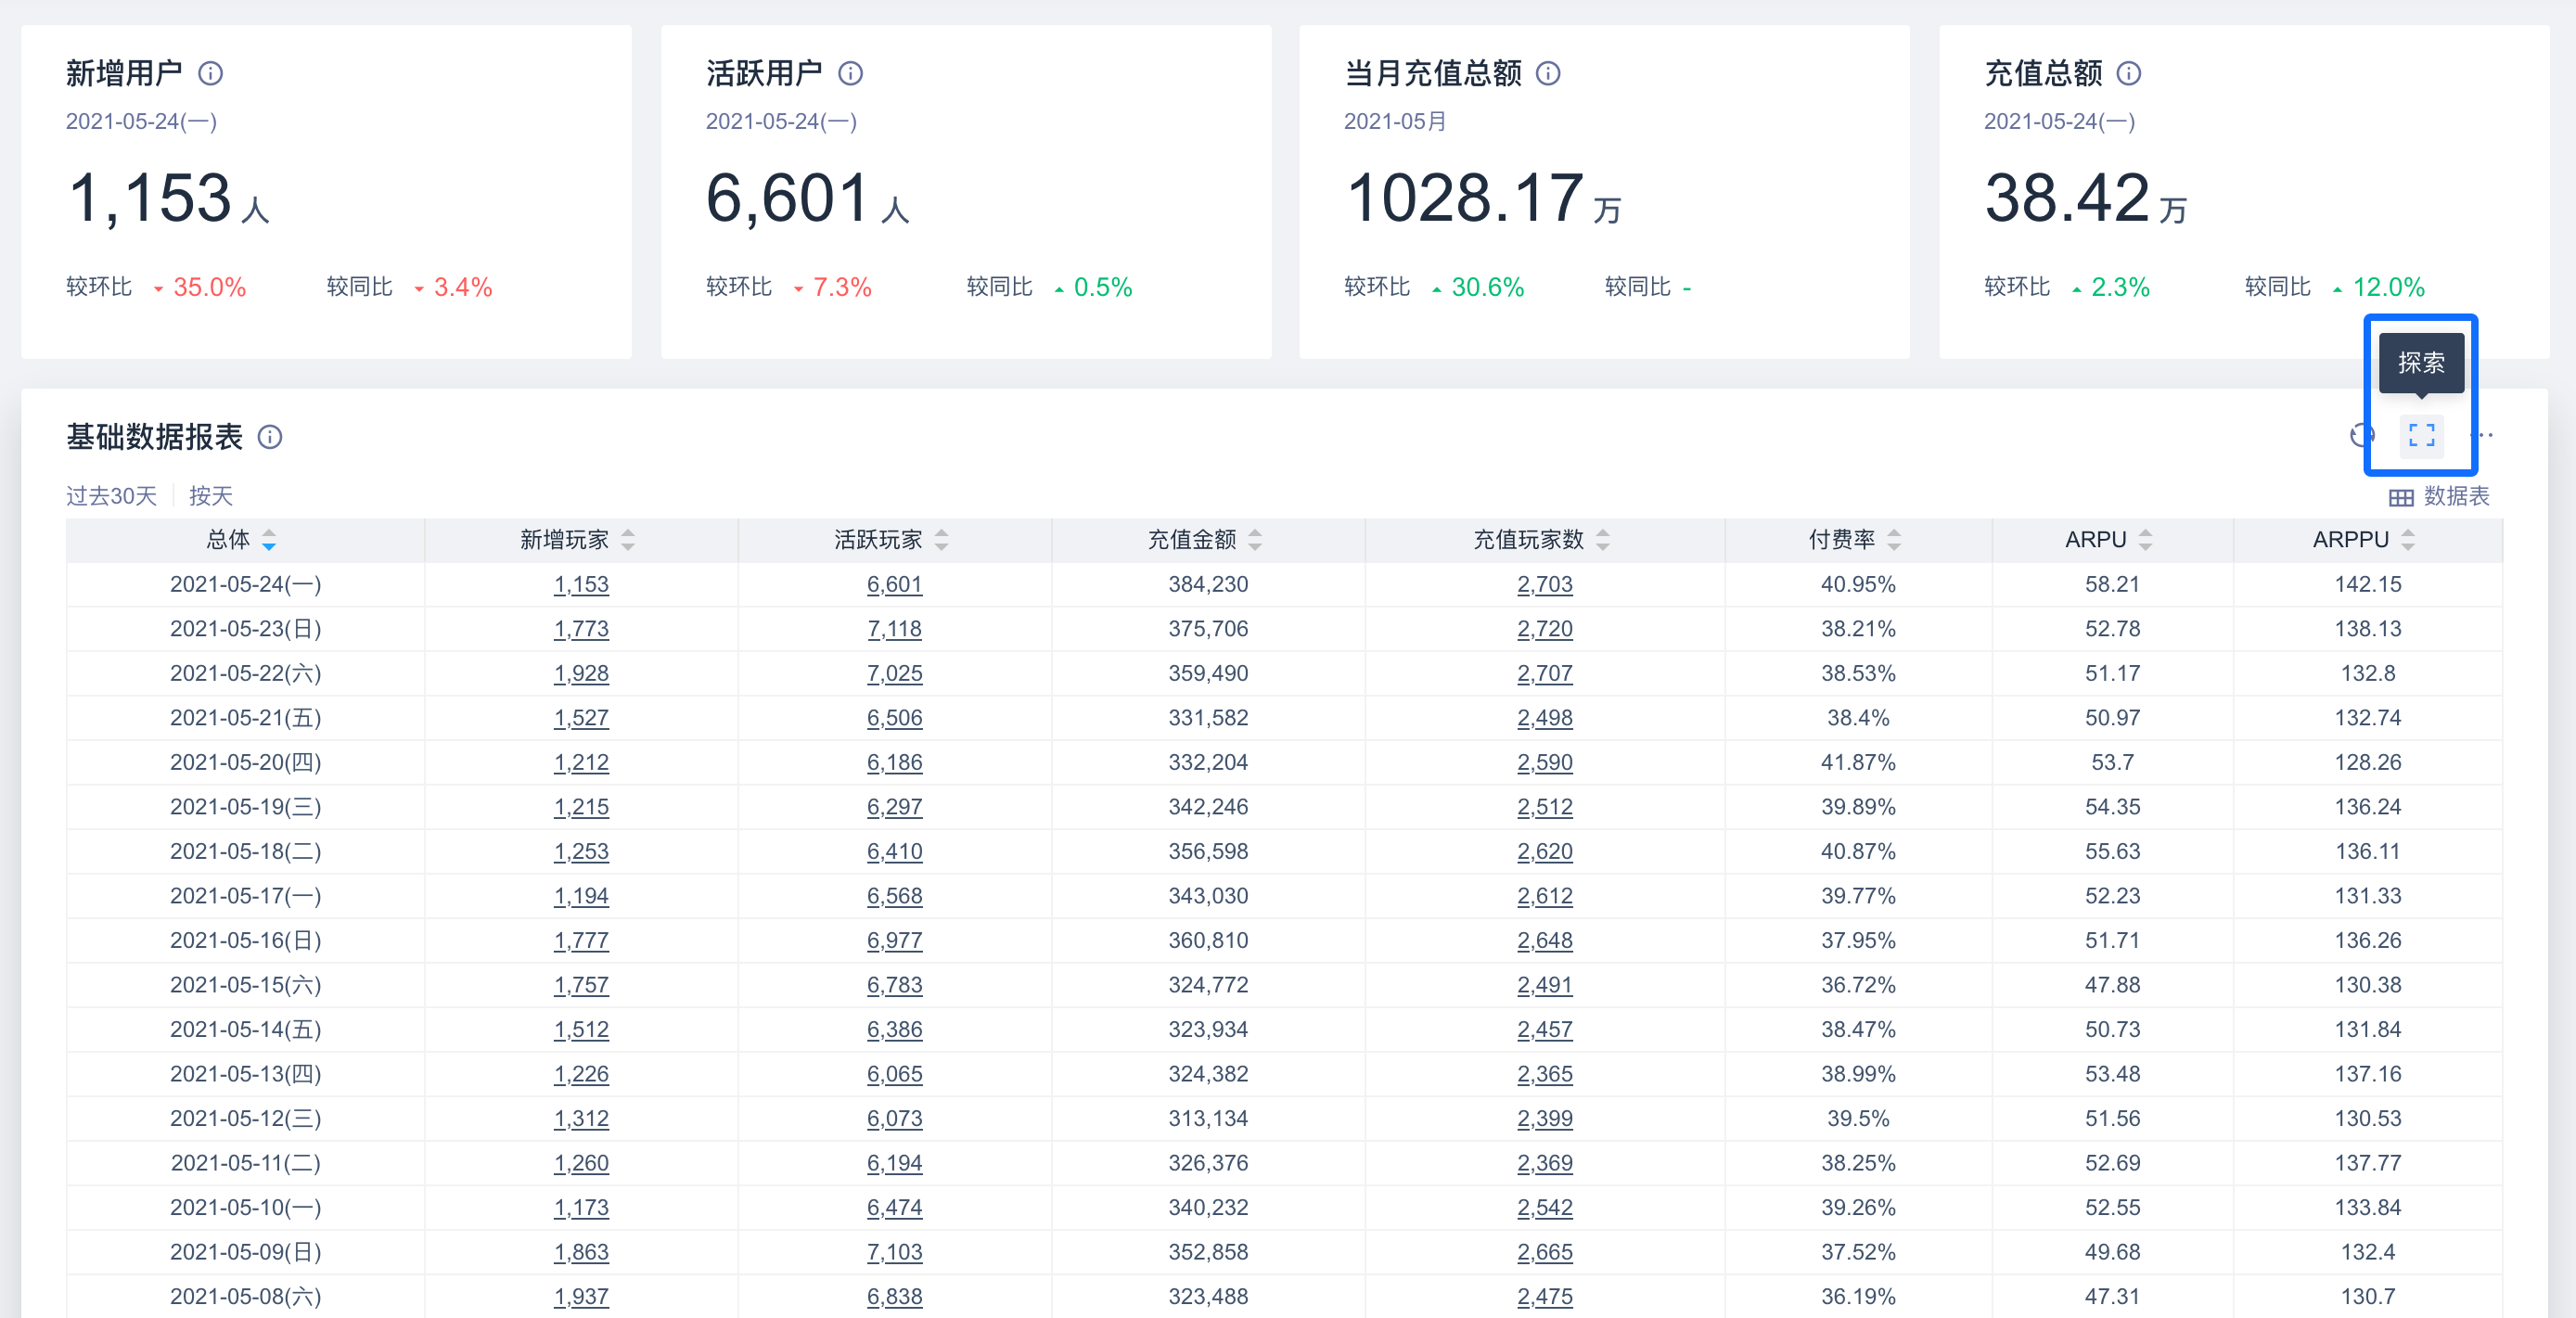
To open the Exploration Module window, hover over the relevant report, and click the "Explore" button in the upper right corner.
By default, all system roles can enter the exploration module.
| Permissions | Super Admin | Admin | Analyst | M ember |
|---|---|---|---|---|
| Use the "Explore Module." | ● | ● | ▲ | ▲ |
Permission description:
● Role must have
▲ The role has the permission by default, but can revoke
△ The role is not available by default, but can be authorized
○ Role must not have
# 2.Feature Introduction
# 2.1 Window layout
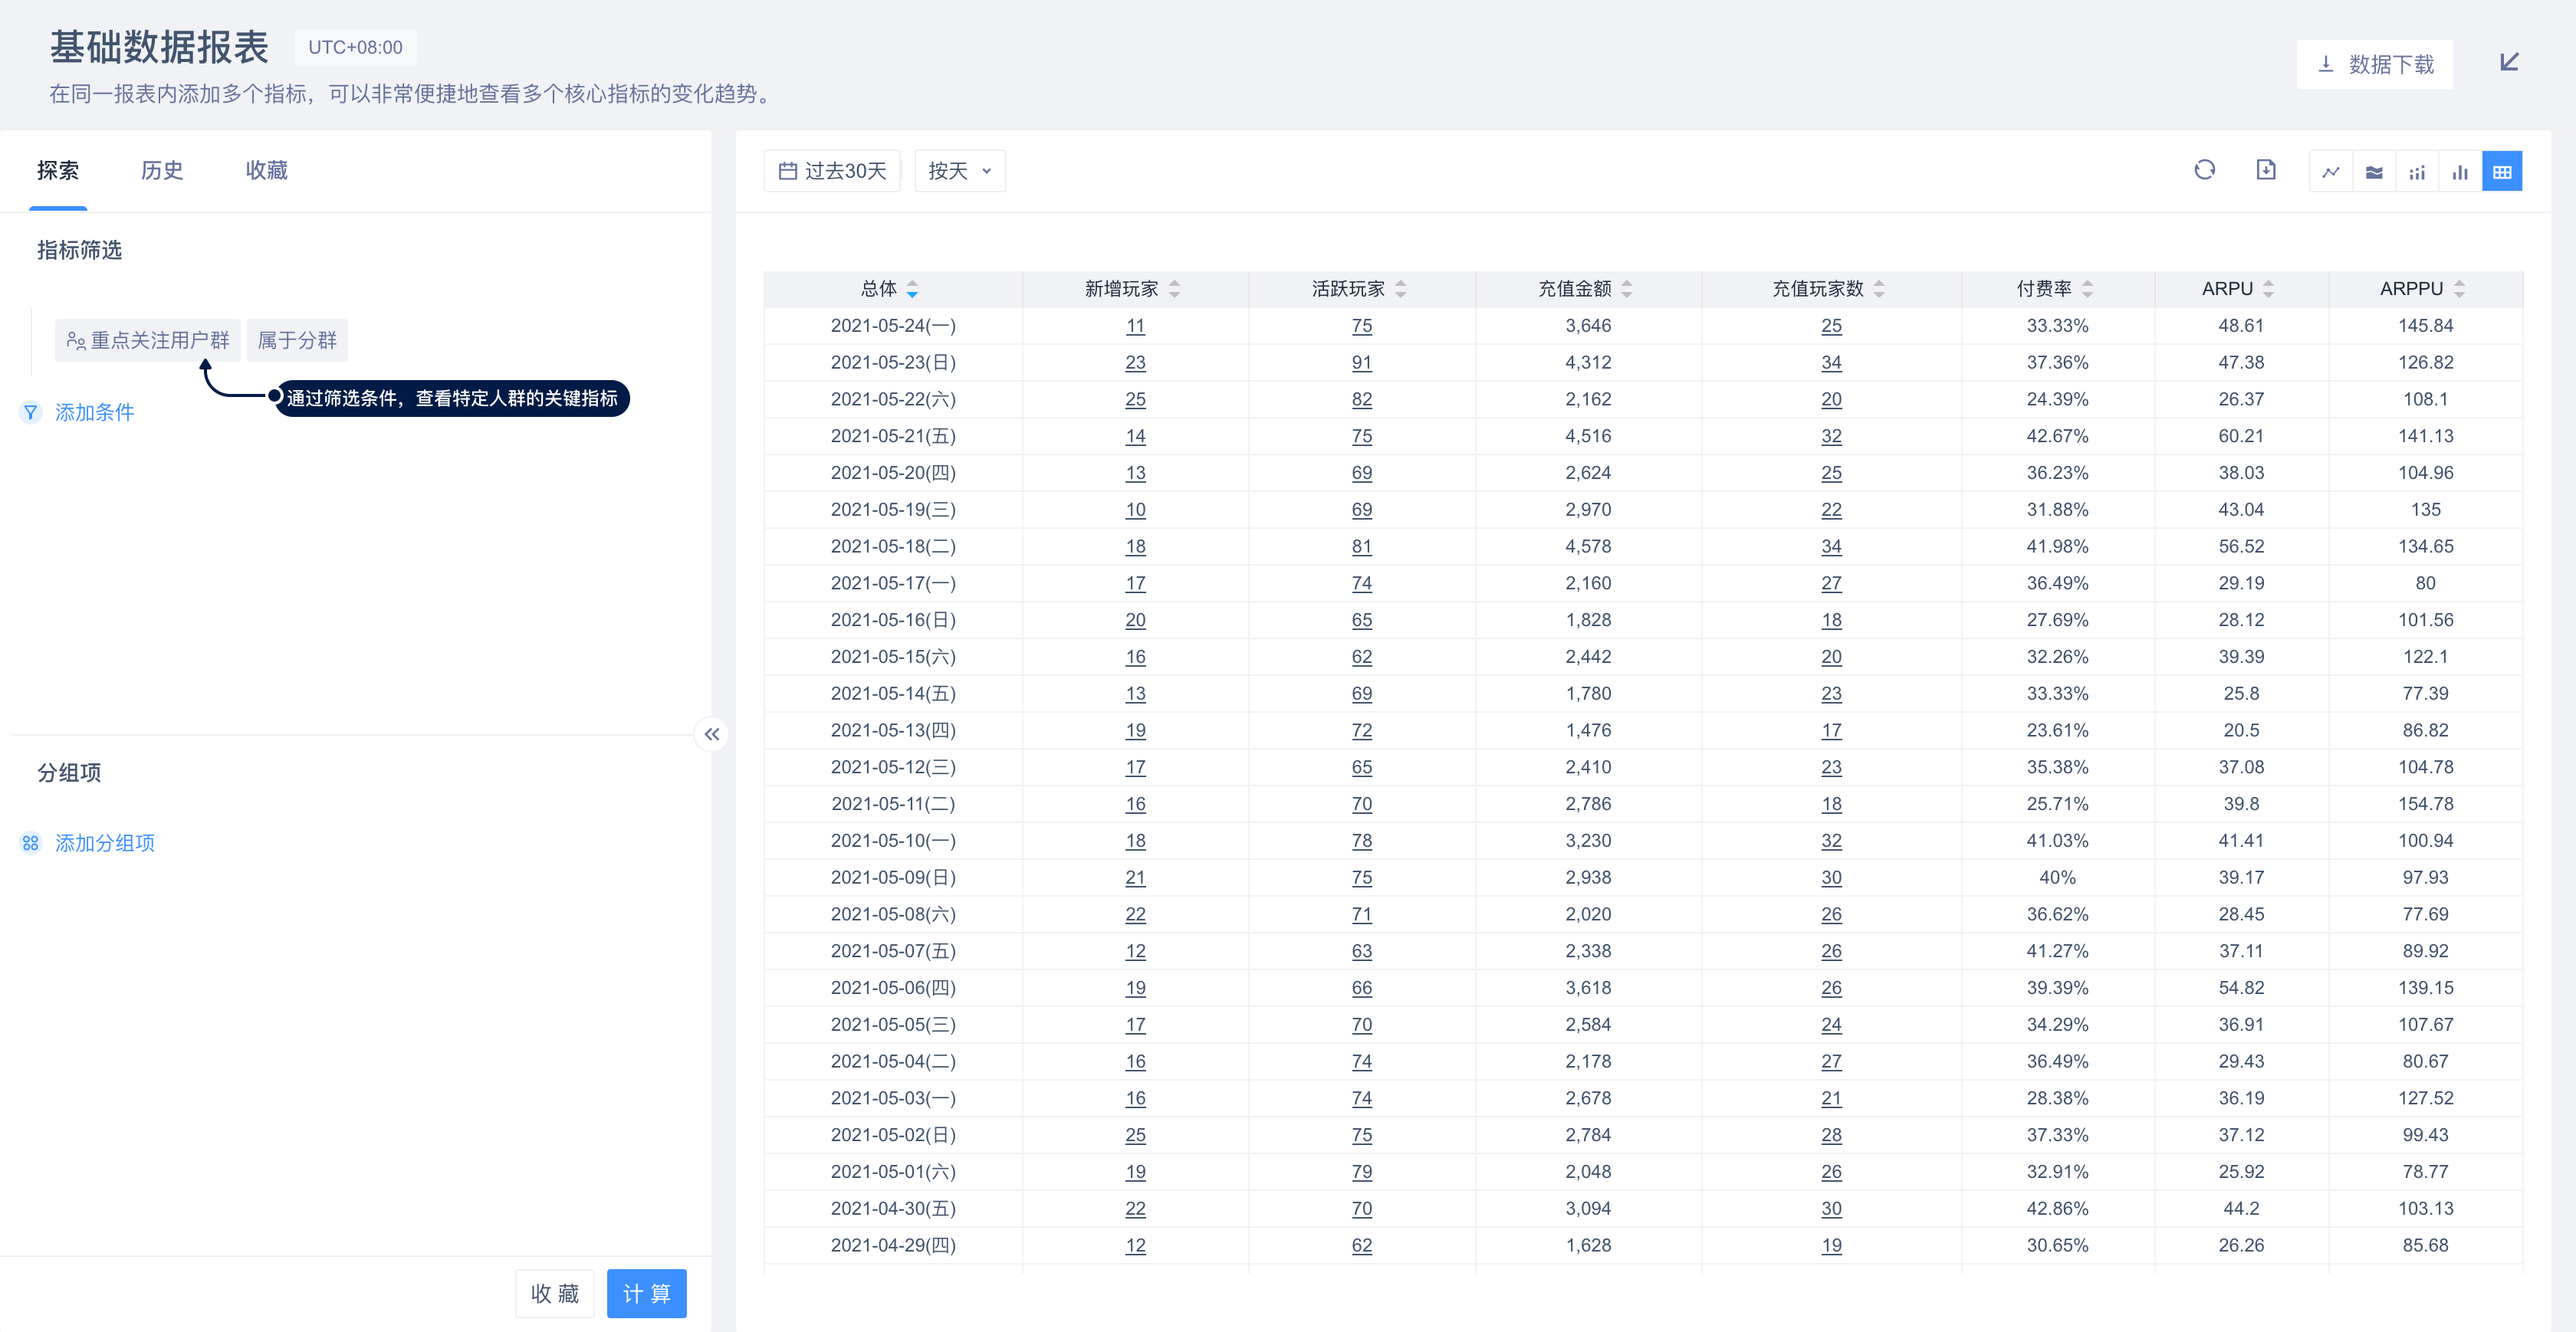
The window of the exploration module is shown in the figure below, which includes the following sections:
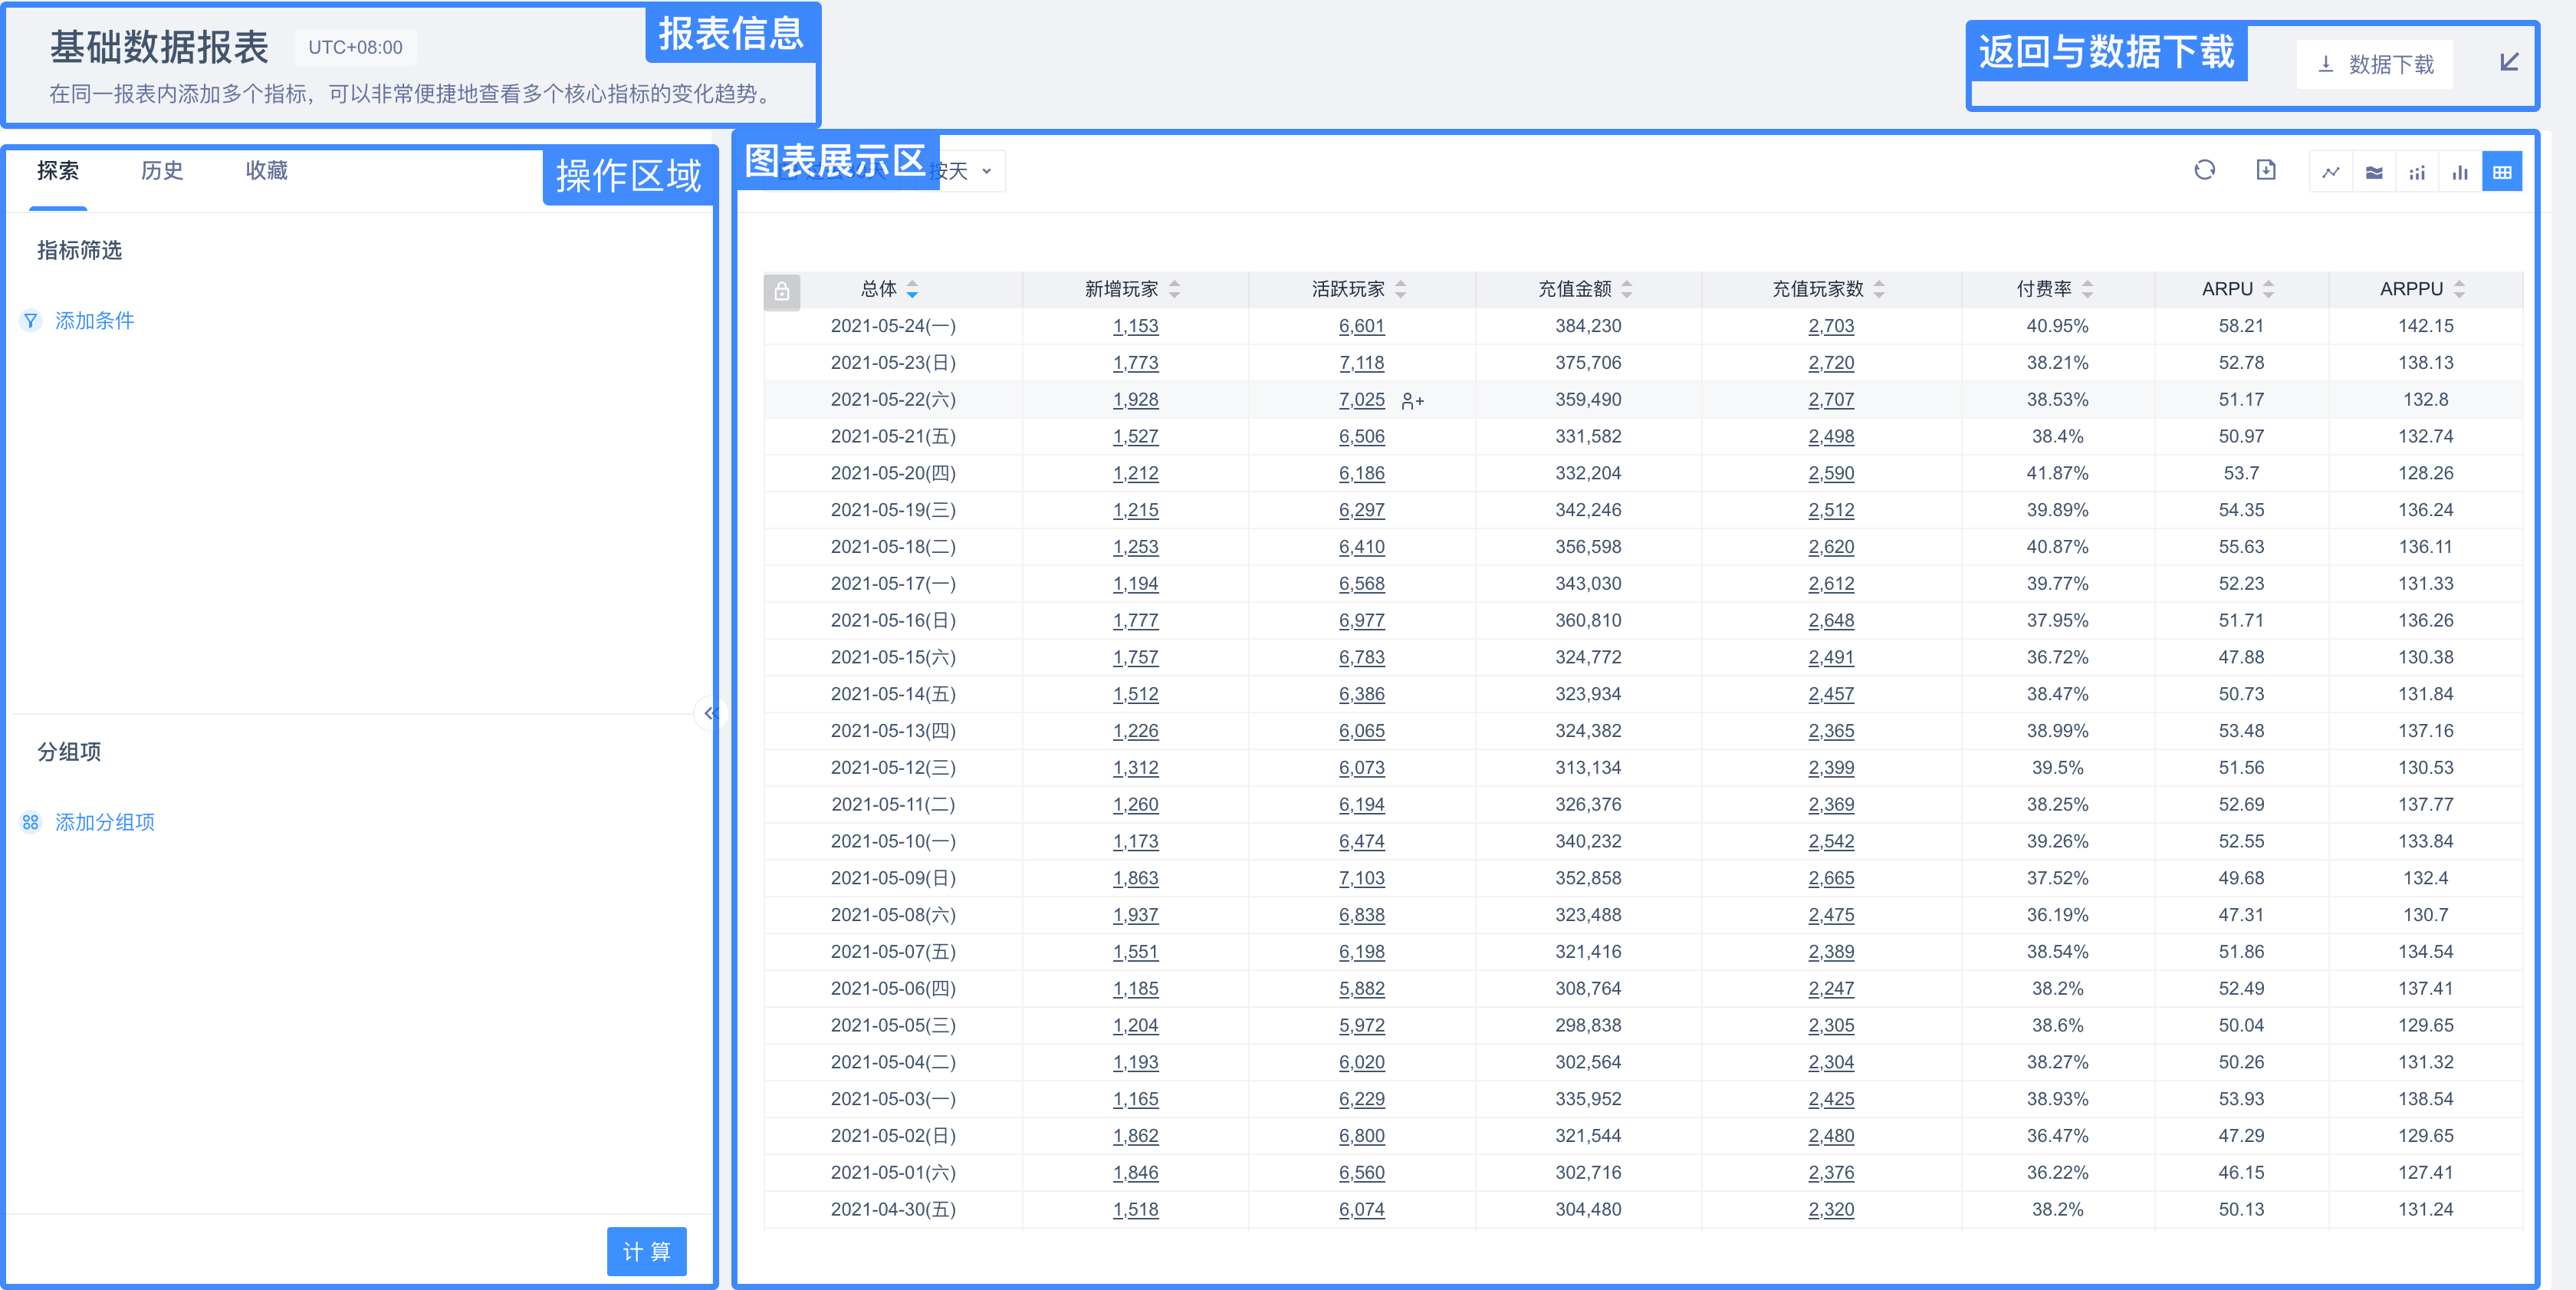
Report Information Area: displays the name and description of the report. If the time zone feature is turned on, the time zone control will appear. The time zone here is consistent with the time zone in the dashboard. If the dashboard does not lock the time zone, you can switch the time zone here.
Configuration area: the most important area in the exploration module, where you can add filters and groupings for in-depth data exploration, you can also switch through the tab to view the query history of the exploration module and save query details.
Chart area: the area where the calculation results are displayed. It also supports the time range selection and chart type change, as well as data refreshing and exporting.
Back button: click the button in the upper right corner of the window to return to the dashboard.
# 2.2 Query Function
The "Query" tab is a place for drill-down analysis of metrics. It supports adding filtering criteria to metrics and modifying groupings.
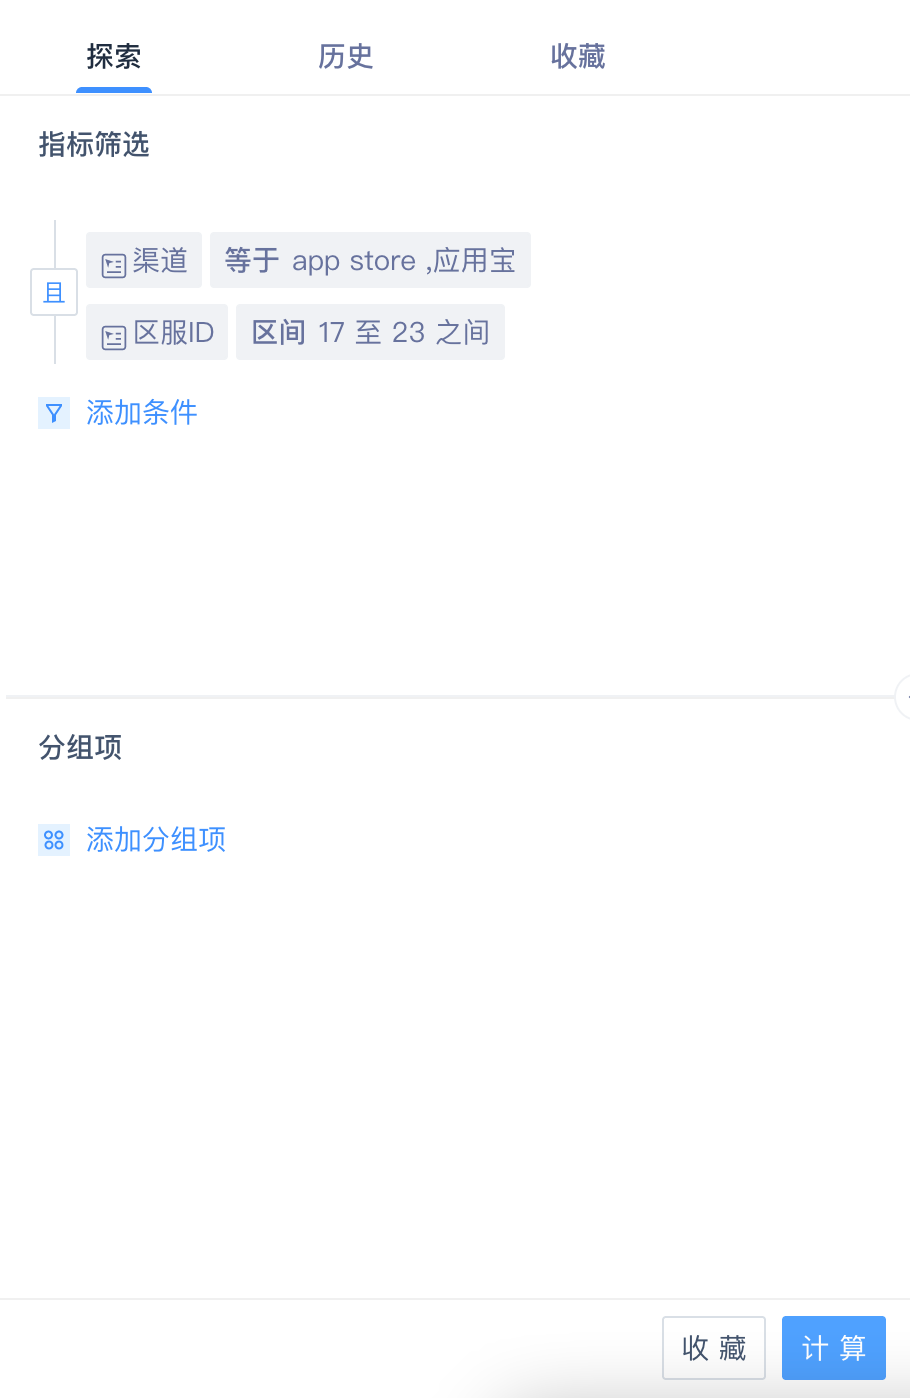
When entering the exploration module, the window first captures the filtering and grouping conditions and from the dashboard. If no filtering was set, the default is no filtering conditions.
Metric filtering and groupings are two main drill-down methods:
- Metric filtering adds an additional filtering** layer** to the original filtering criteria when the report was created.
- Use grouping****s to adjust the original grouping conditions of the report.
All operations in the Exploration Module, such as adding metrics or adjusting groupings, will not modify the settings of the original report**.**
Click the "Calculate" button below to query. The query results will be recorded in the query history. You can click "History" on the tab to view the query history.
# 2.3 Search History
The "History" tab will record the history of the last 20 exploration queries for this report, where you can view previous query conditions or recalculate with previous conditions.
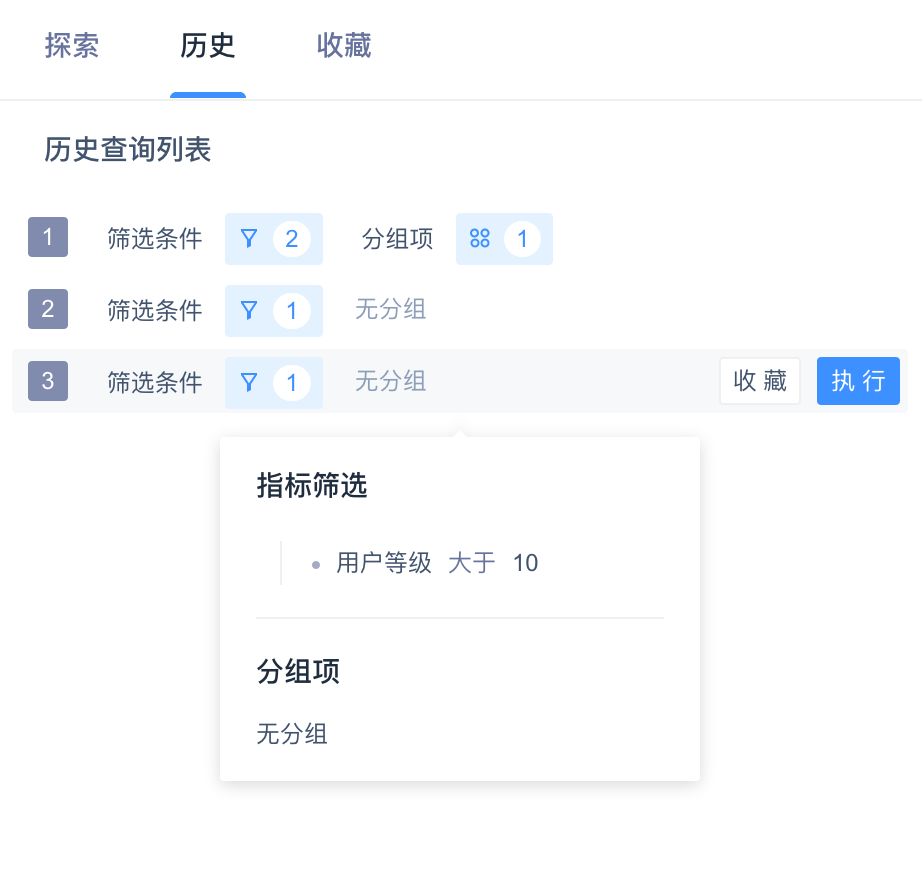
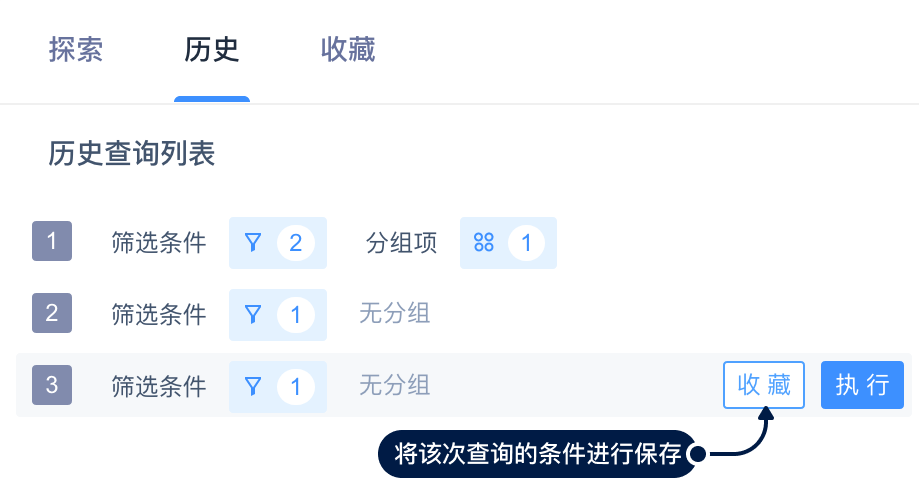
Query history will not be saved for a long time. You can click the "Favorite" button on the right side to save query conditions for later use.
# 2.4 Favorites Query
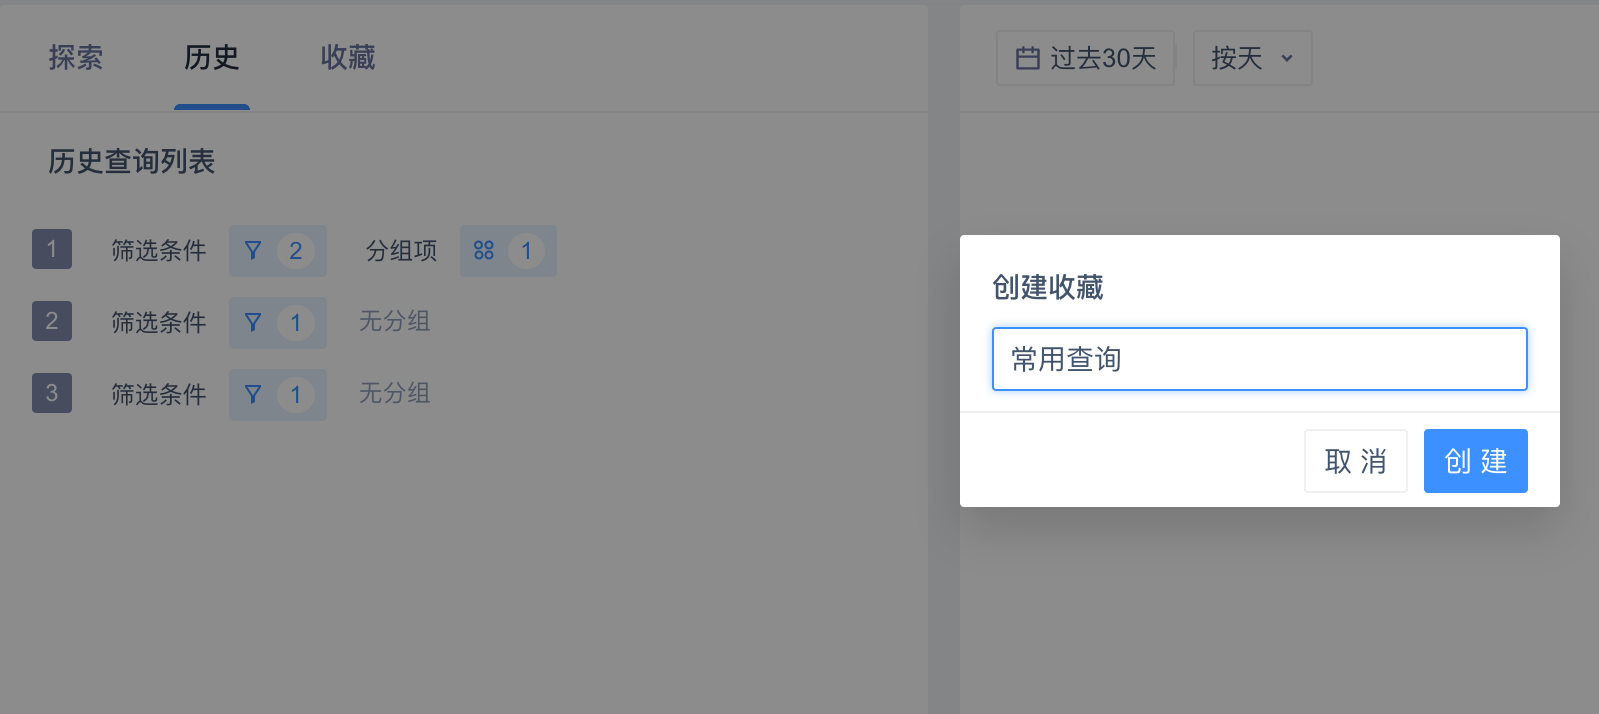
Use "Favorites"** button** to save query conditions for the relevant user; under the "History" tab, click the "Favorites" button on the right side to save it.
Under the "Favorites" tab, you can view the query conditions you saved or redo the calculation. In addition, you can rename or remove the favorites.
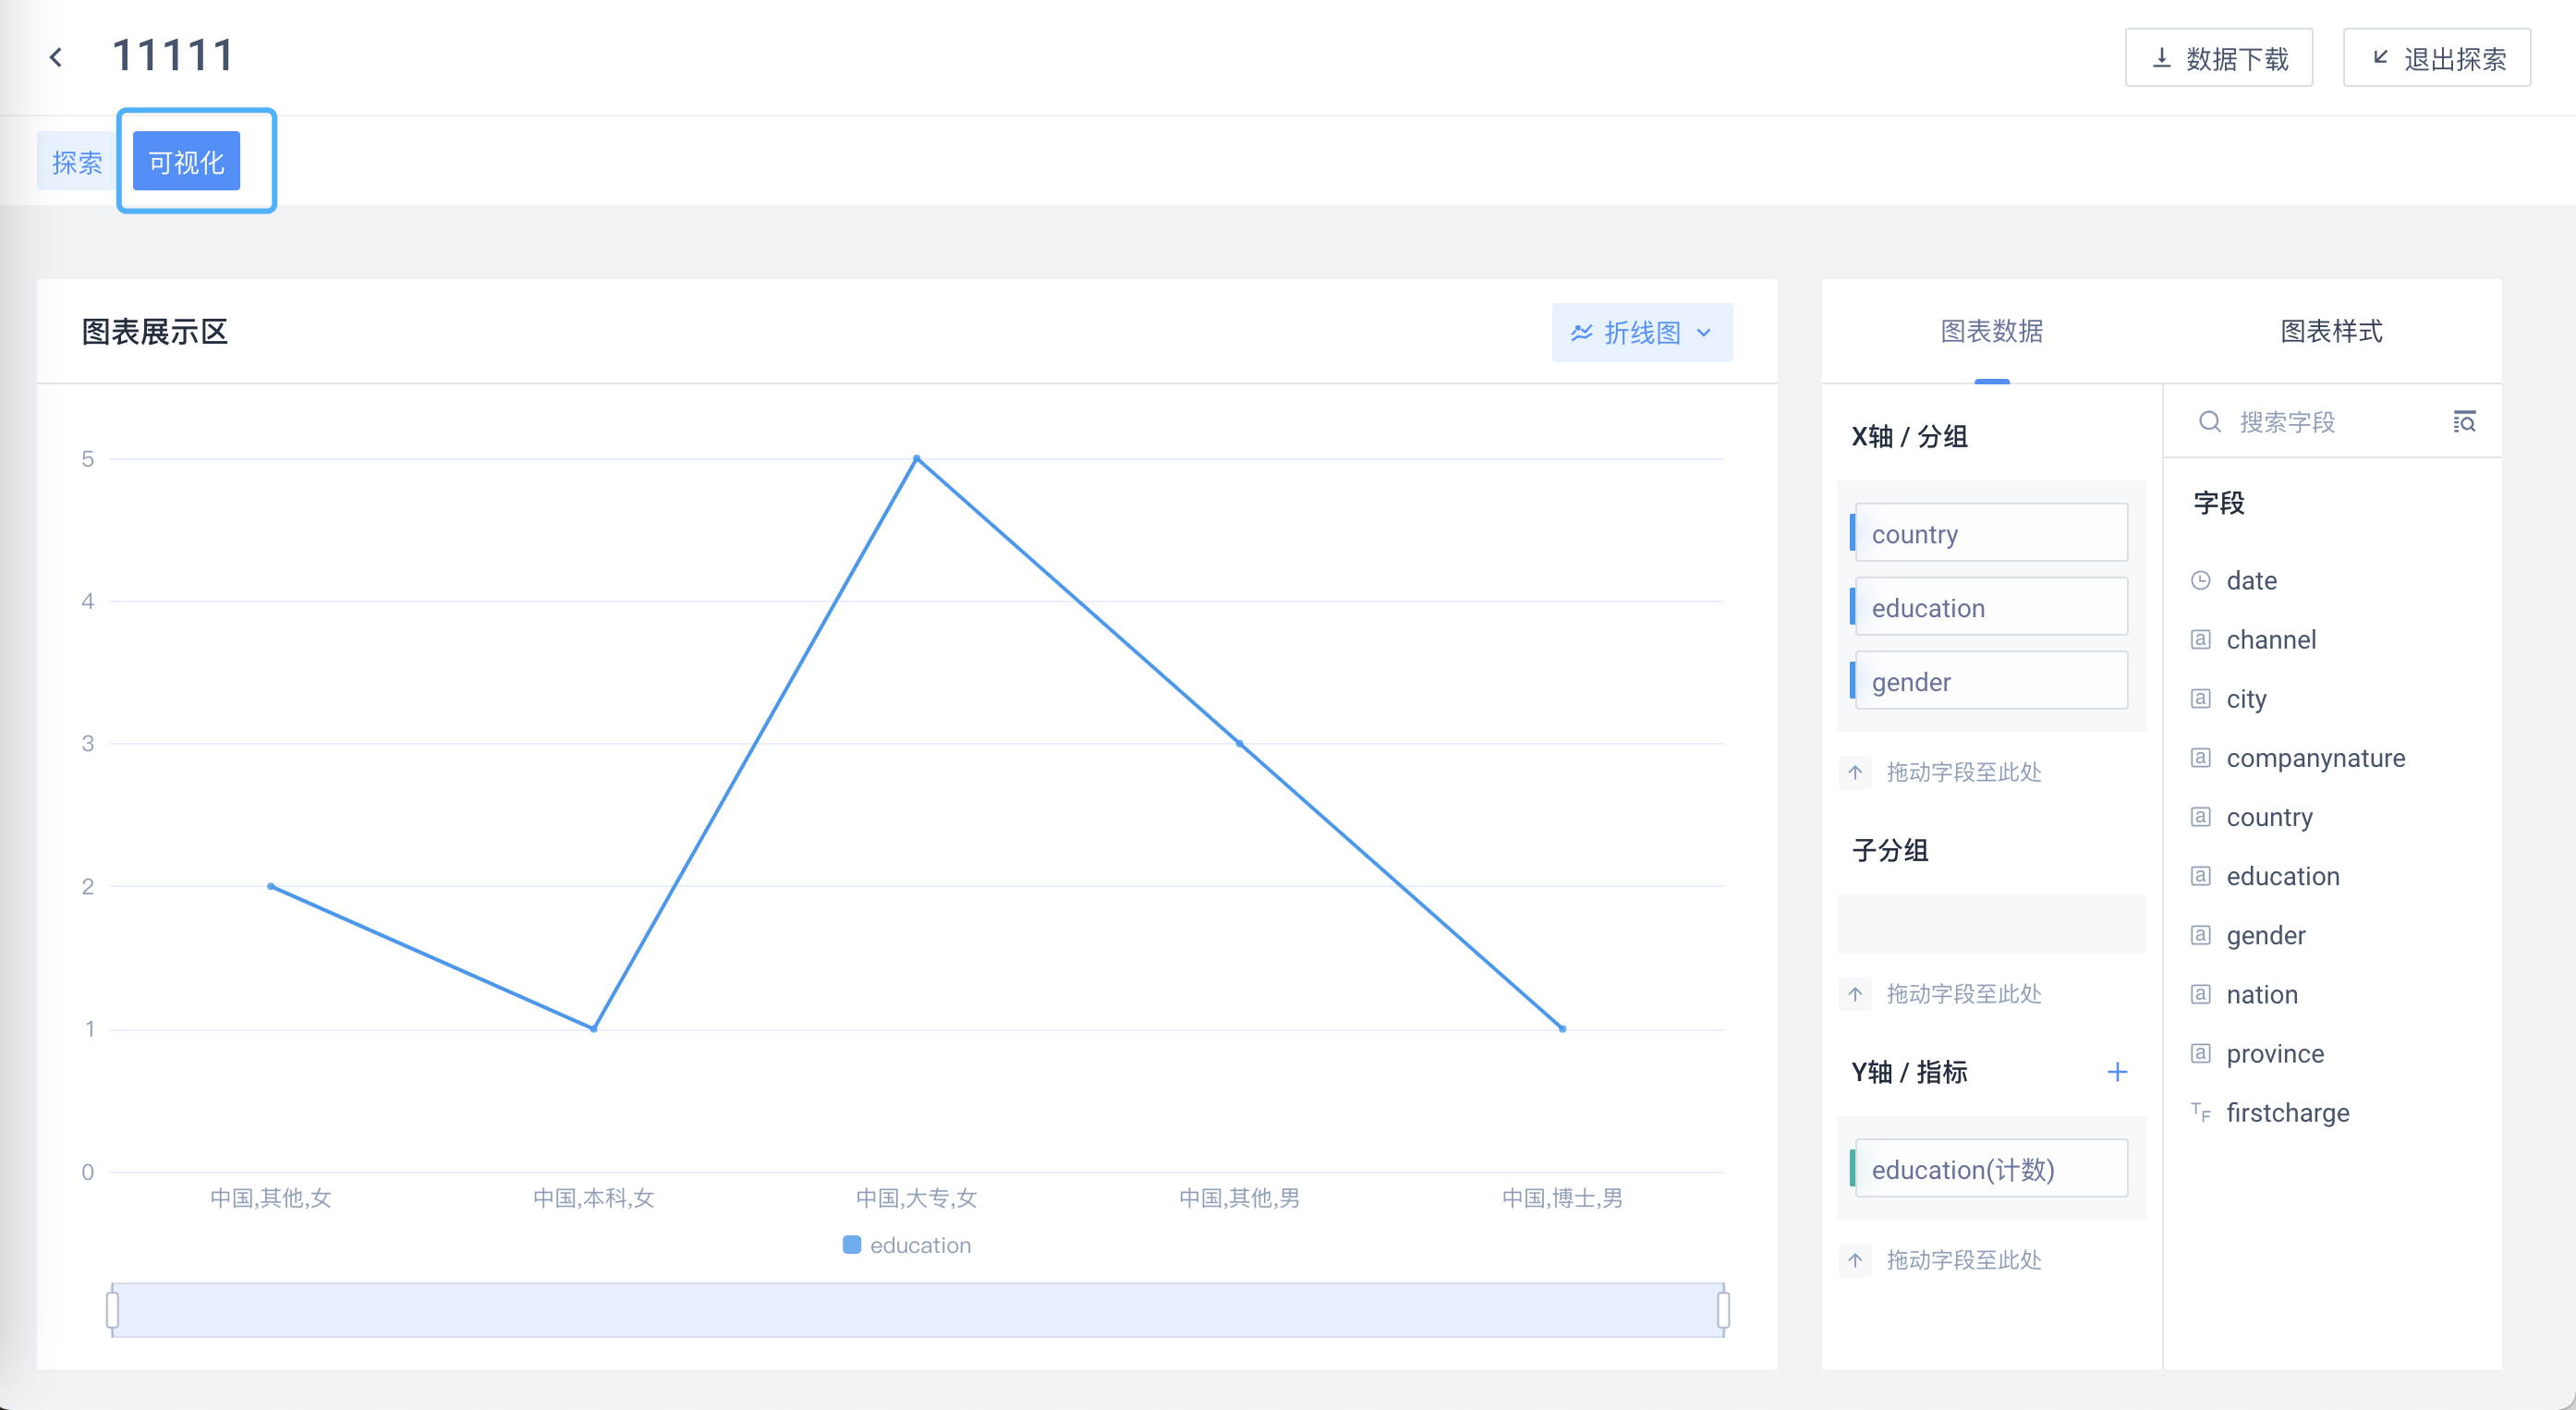
# 2.5 Visualization in Exploration Module
From version 3.3, the platform supports visualization in Exploration Module. You can enter the visual configuration page through the top **"Visualization" **button. For details, please also refer to the visualization module.
# 3.Best Practices
# 3.1 Dashboard-based Analysis of Specific User Groups
Conducting drill-downs, filtering, and groupings in the Exploration Module makes exploring various core metrics for specific user groups easier.
- View key metrics for specific user cohorts based on user groups/tags
# 3.2 Flexible Dimension Changes
In the dashboard building process, dashboards with the same metric in multiple different dimensions were often created, such as multiple DAU reports based on different dimensions such as media source, user region, and device model; it not only requires the creation of a large number of repetitive reports, but also hinders the application of secondary dimensions to a certain extent. Using the Exploration Module, dimensions can be easily adjusted to reduce the dependence on multiple reports with the same metrics. At the same time, users can also use secondary dimensions in the Exploration Module.
- Flexible adjustments of different groupings, multi-dimensional view of core metrics.

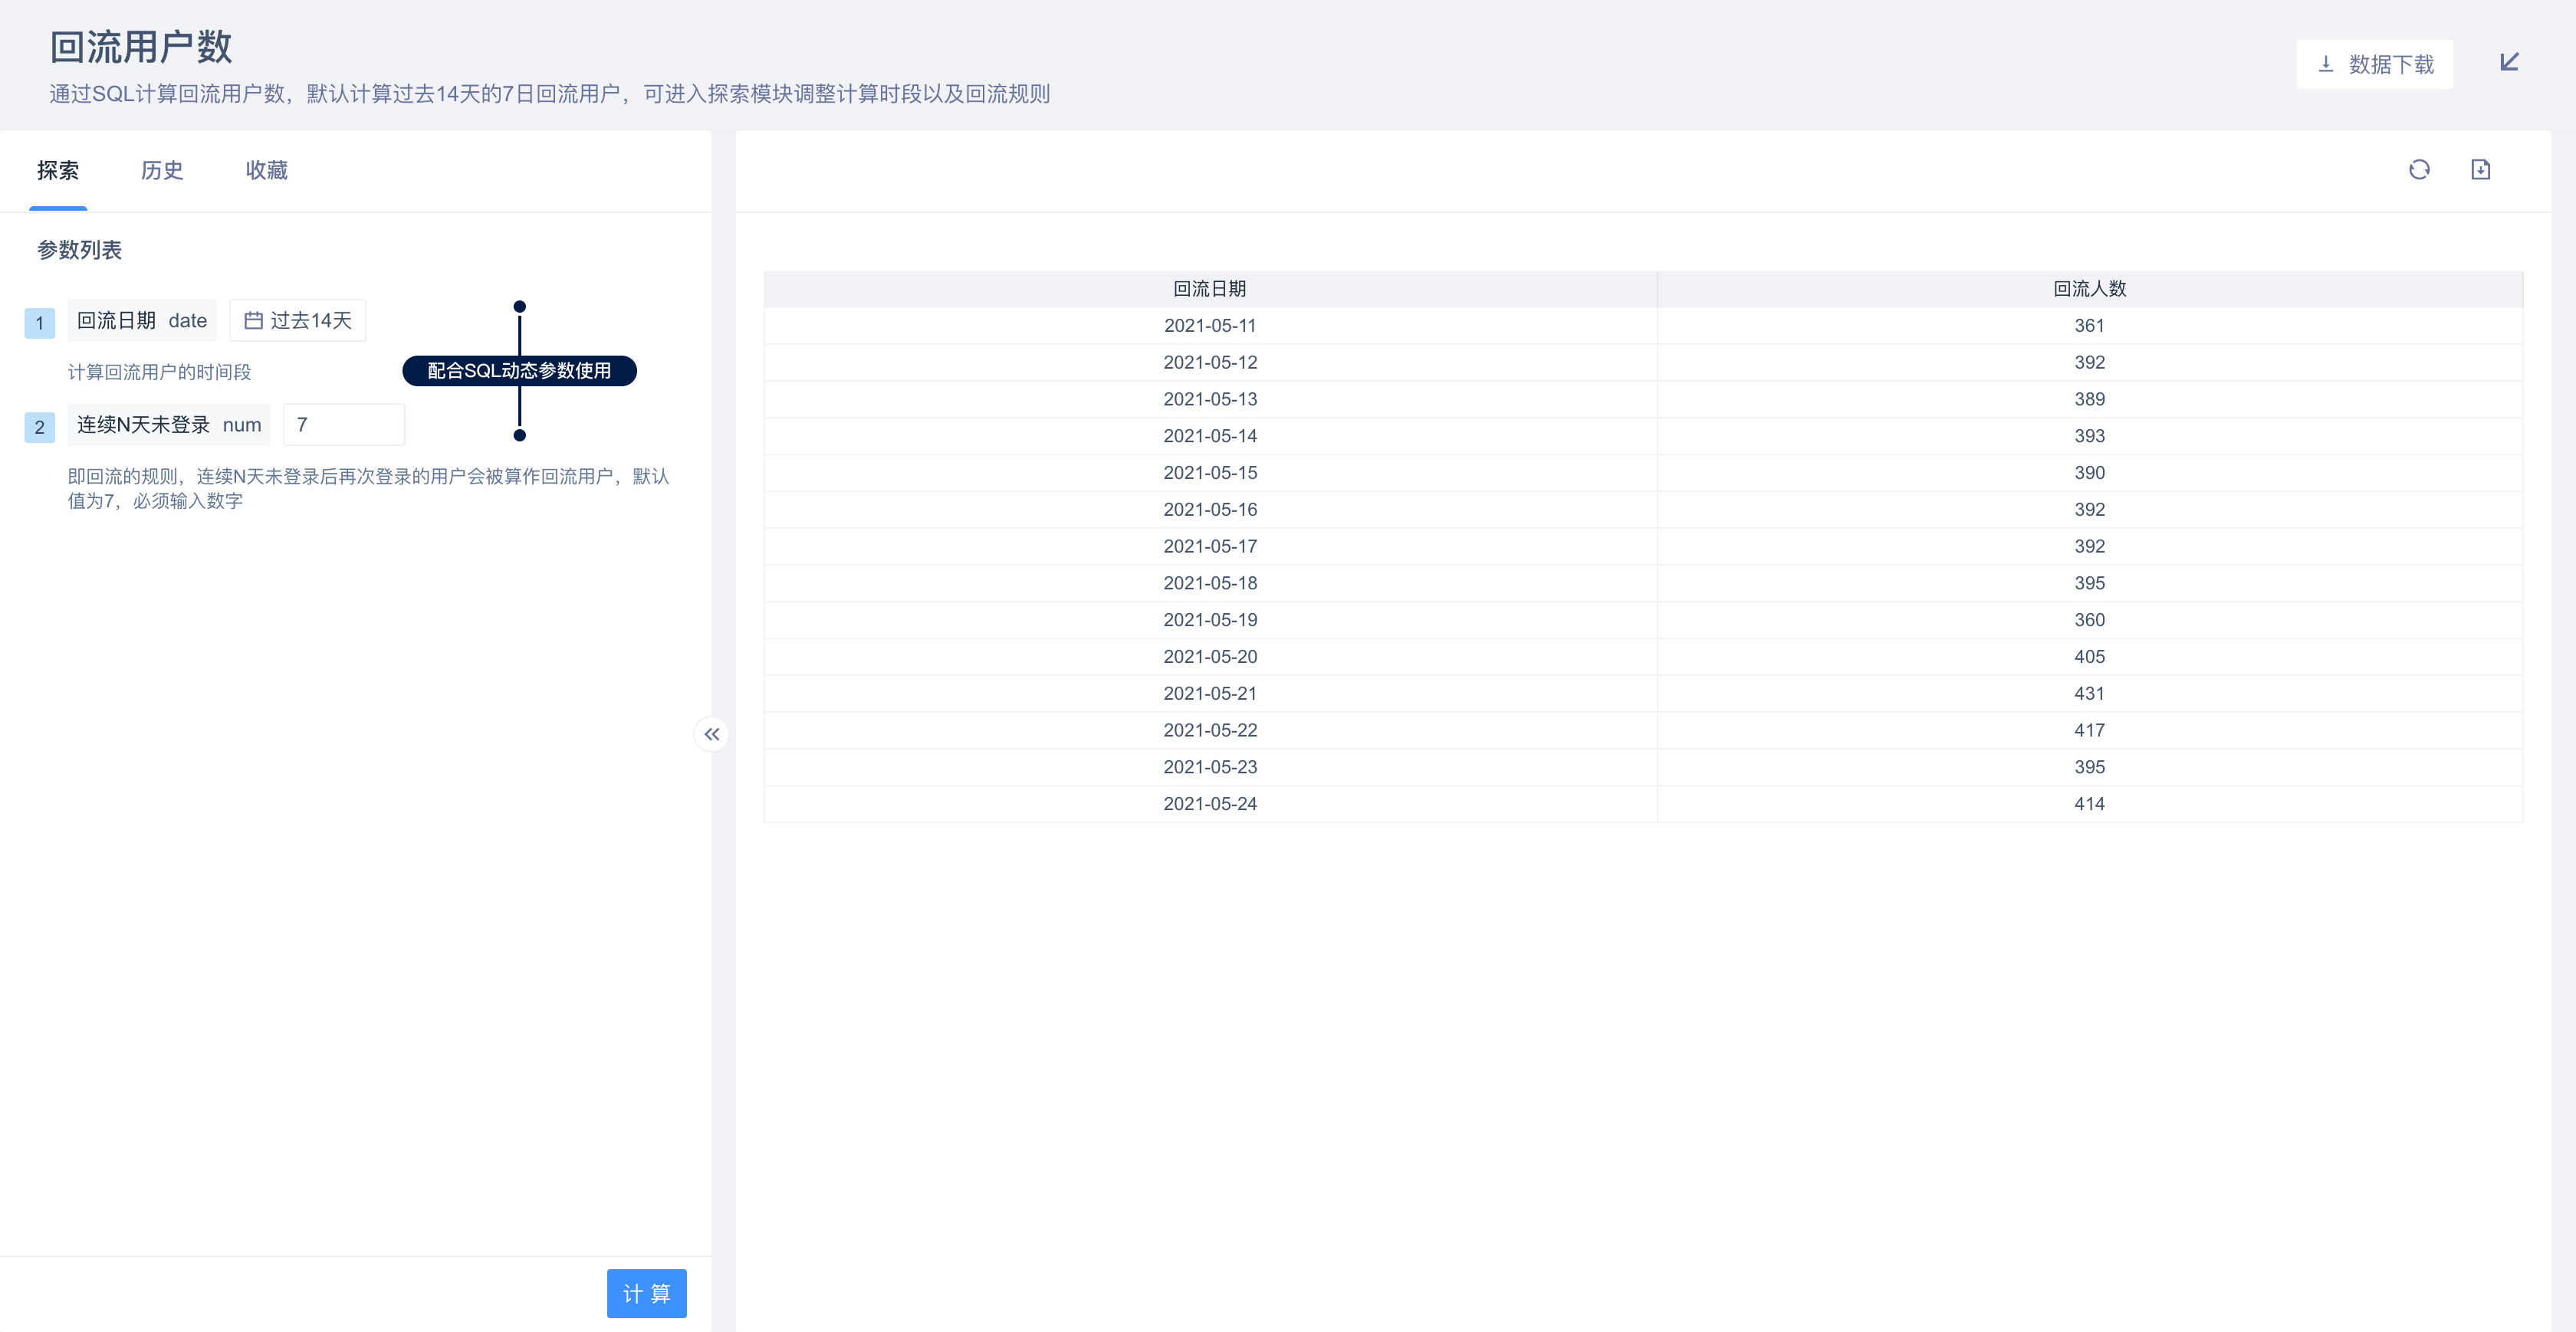
# 3.3 Change Dynamic Parameters for SQL Reports
If you use dynamic parameters in a saved SQL report, you can adjust the values of the dynamic parameters in the Exploration Module. Through this operation, you can adjust the conditions of the query without entering the SQL query page, and you can also allow users who do not have SQL query permissions to adjust the parameters of the SQL query in the Exploration Module.