# Dashboard Building
Congratulations! you have integrated data into Thinking Analytics (TA). Next, you can freely use TA's powerful analysis function to experience flexible and efficient event analysis, retention analysis, funnel analysis and user segmentation, and create and share dashboards. If you have any doubts about the follow-up use, please contact your respective account manager, and we will carefully answer your questions.
This chapter mainly introduces the precautions and common problems in the subsequent use process to help you better use the TA.
# 1.Build Dashbaords
Data dashboards are used to present valuable data that needs daily attention. For operators, good dashboards can help monitor product operation, understand user behavior rules, and quickly identify unexpected problems. Therefore, we recommend that you start editing reports and dashboards immediately after Data Integration is completed.
# 1.1 How to Edit the Report dashboard (need analyst authority or above)
First, we will introduce the meaning of statements and dashboards:
- Reports are saved analysis results which are edited and saved in the analysis module.
- Dashboard is made up of reports and is the final result that can be viewed. Administrators and analysts can add saved reports to the dashboard and share the dashboard with relevant staff after editing.
The process of editing reports and dashboard is described below:
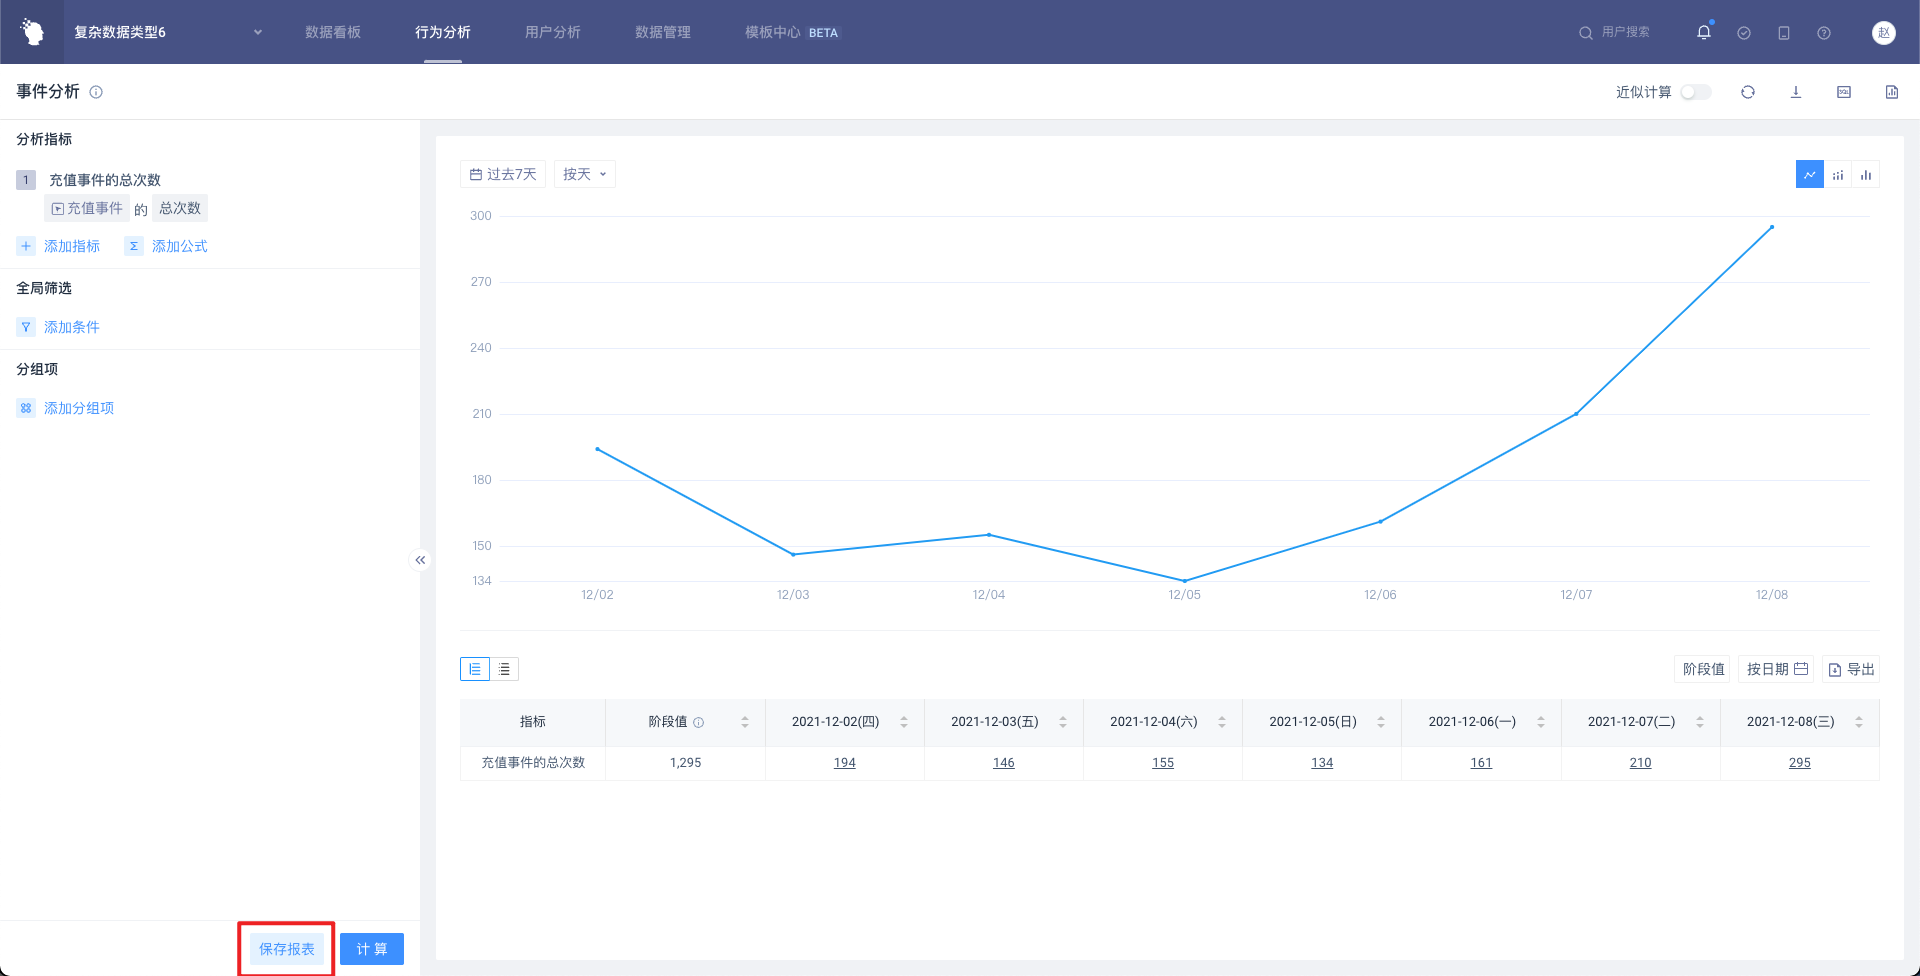
First enter the analysis model, after the calculation, the analysis results can be saved as reports.
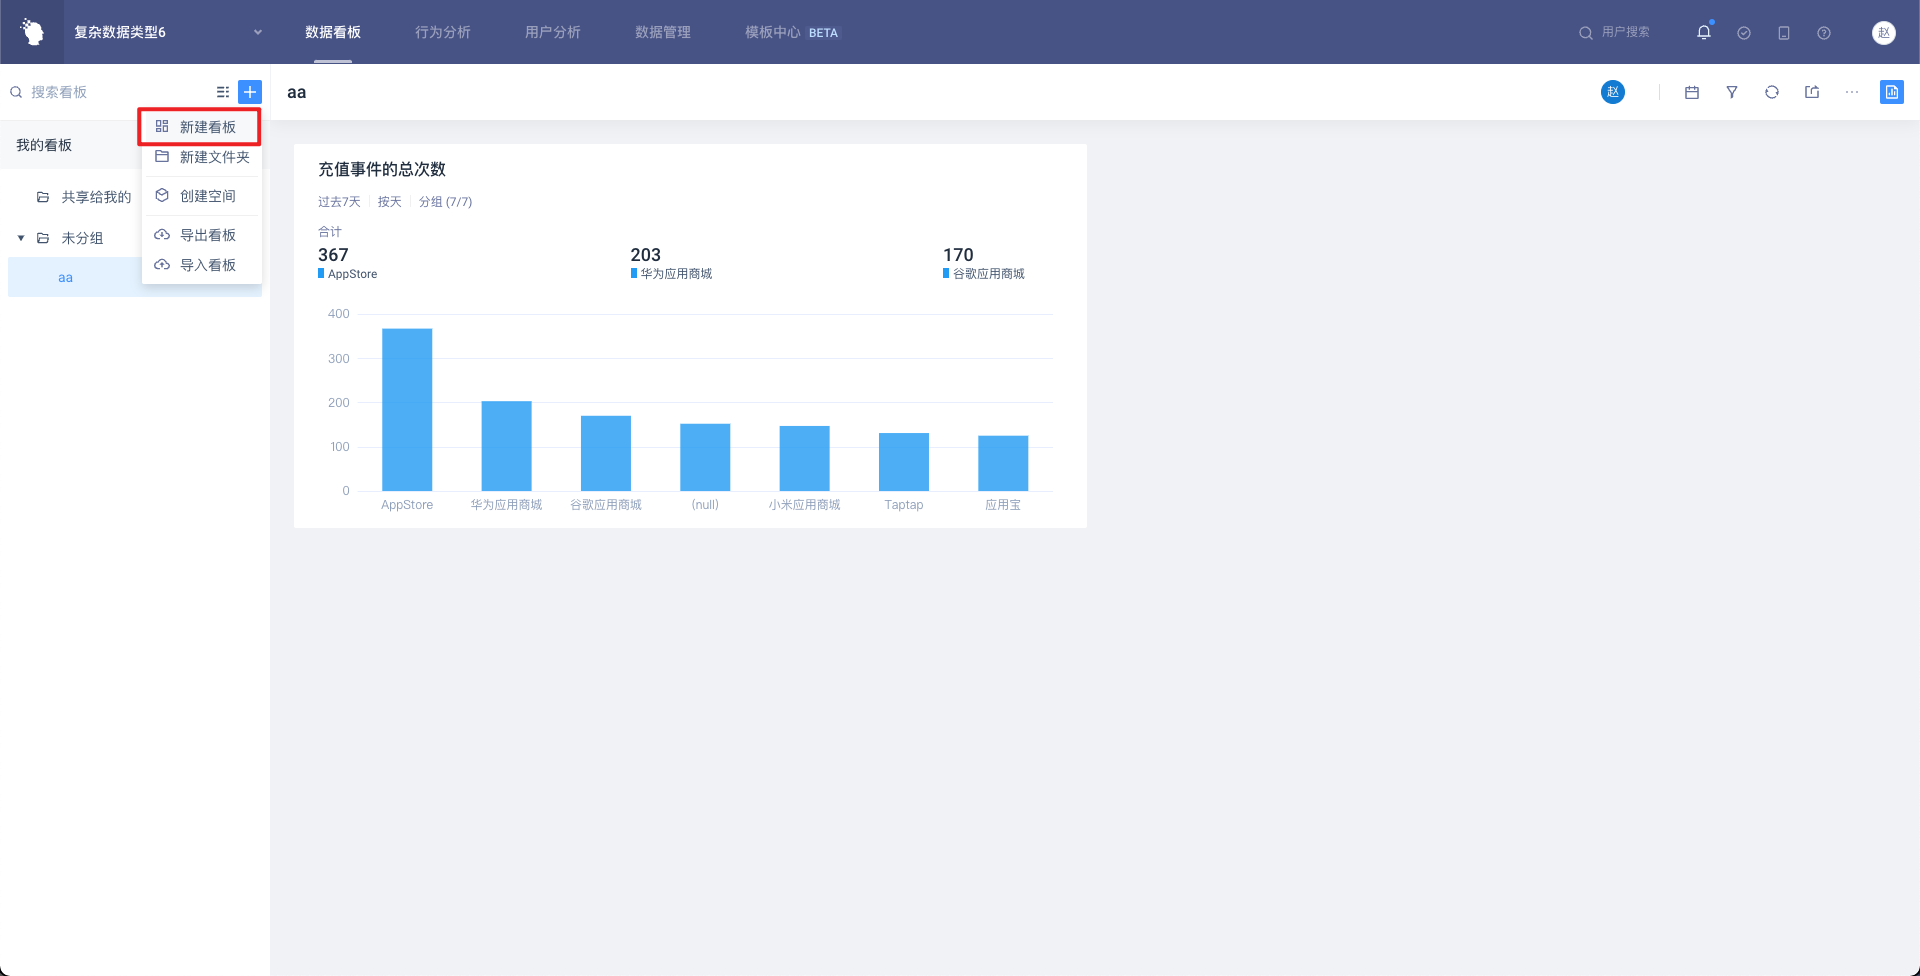
Once the setup report is complete, go back to the Data Dashboard tab and click the New Dashbarod button in the upper left corner to create a new dashboard.
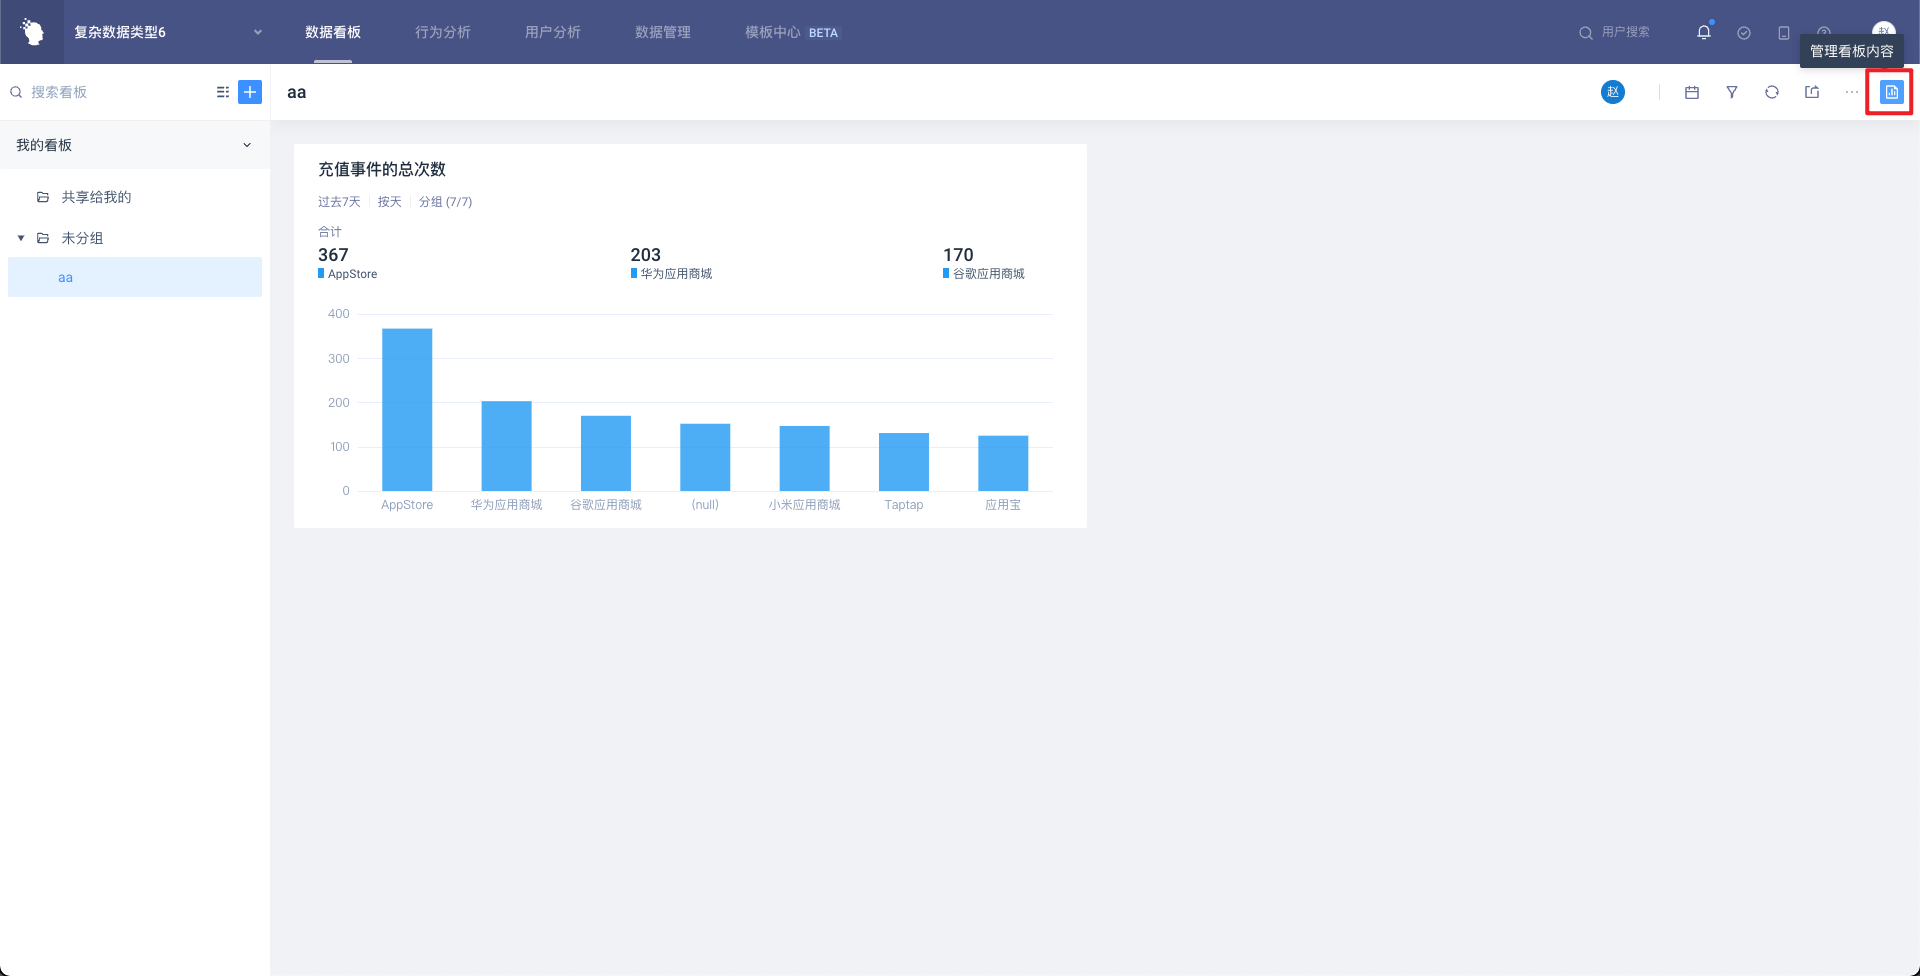
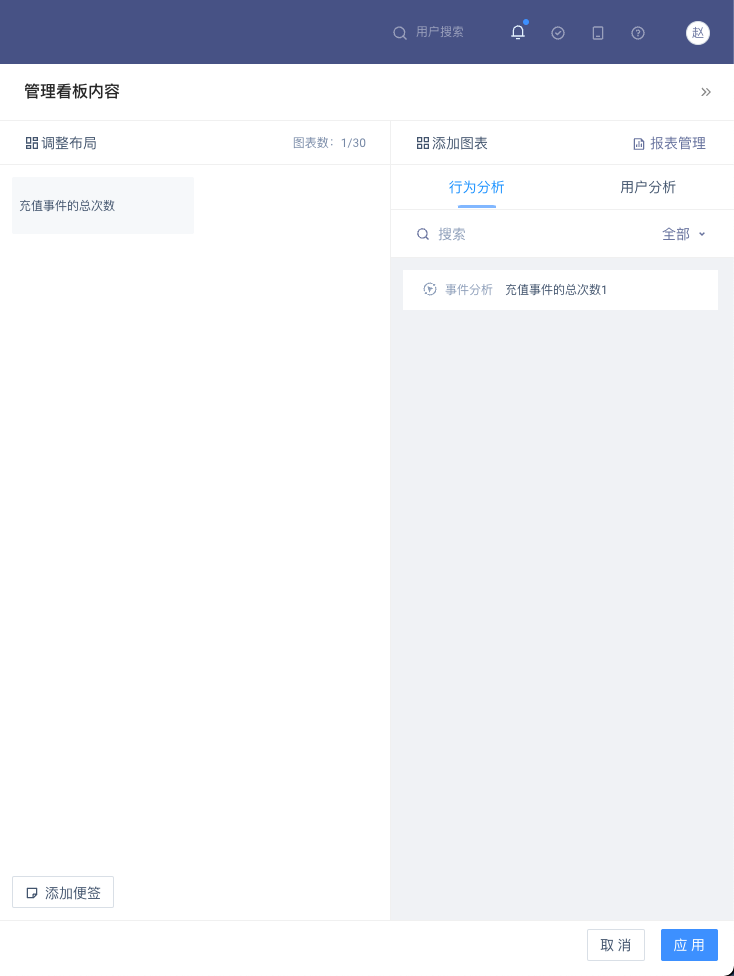
- Enter the dashboard and click the Manage Dashboard Content button in the upper right corner to add the saved report to the dashboard. You can drag the report to the right column, adjust the position of the report in the dashboard, and click the Finish button in the lower right corner to save it after editing.
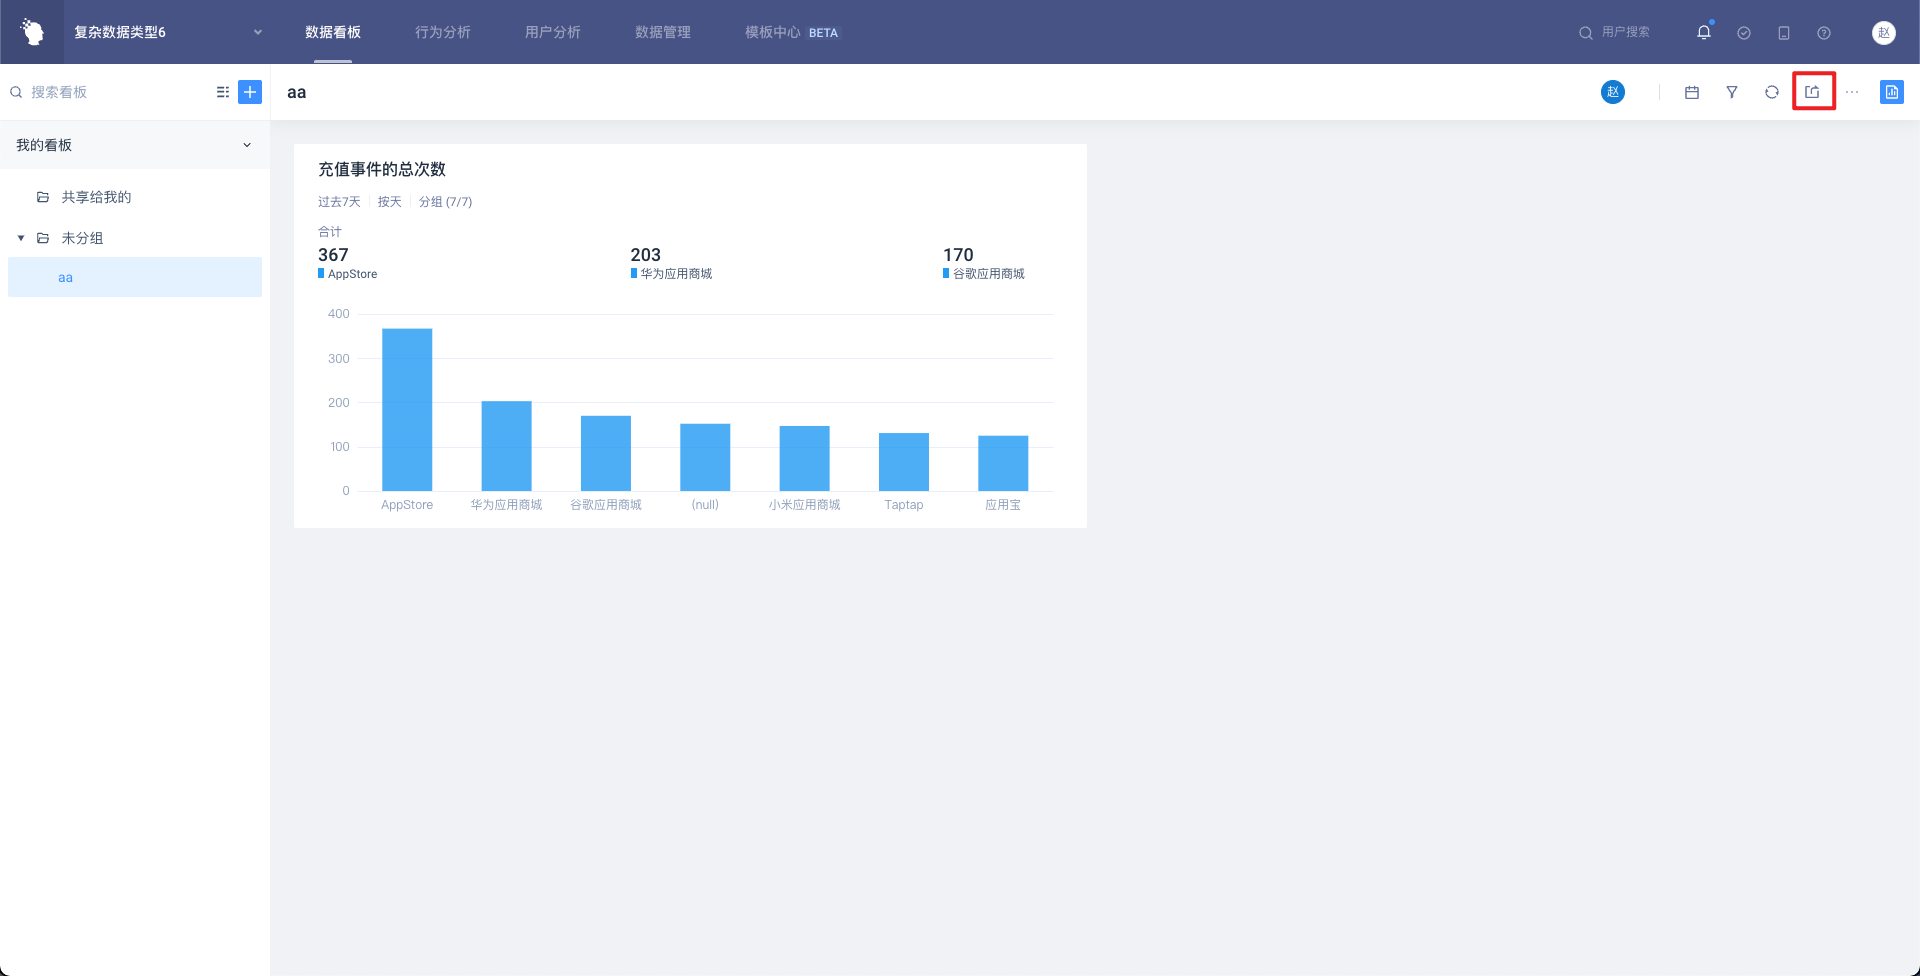
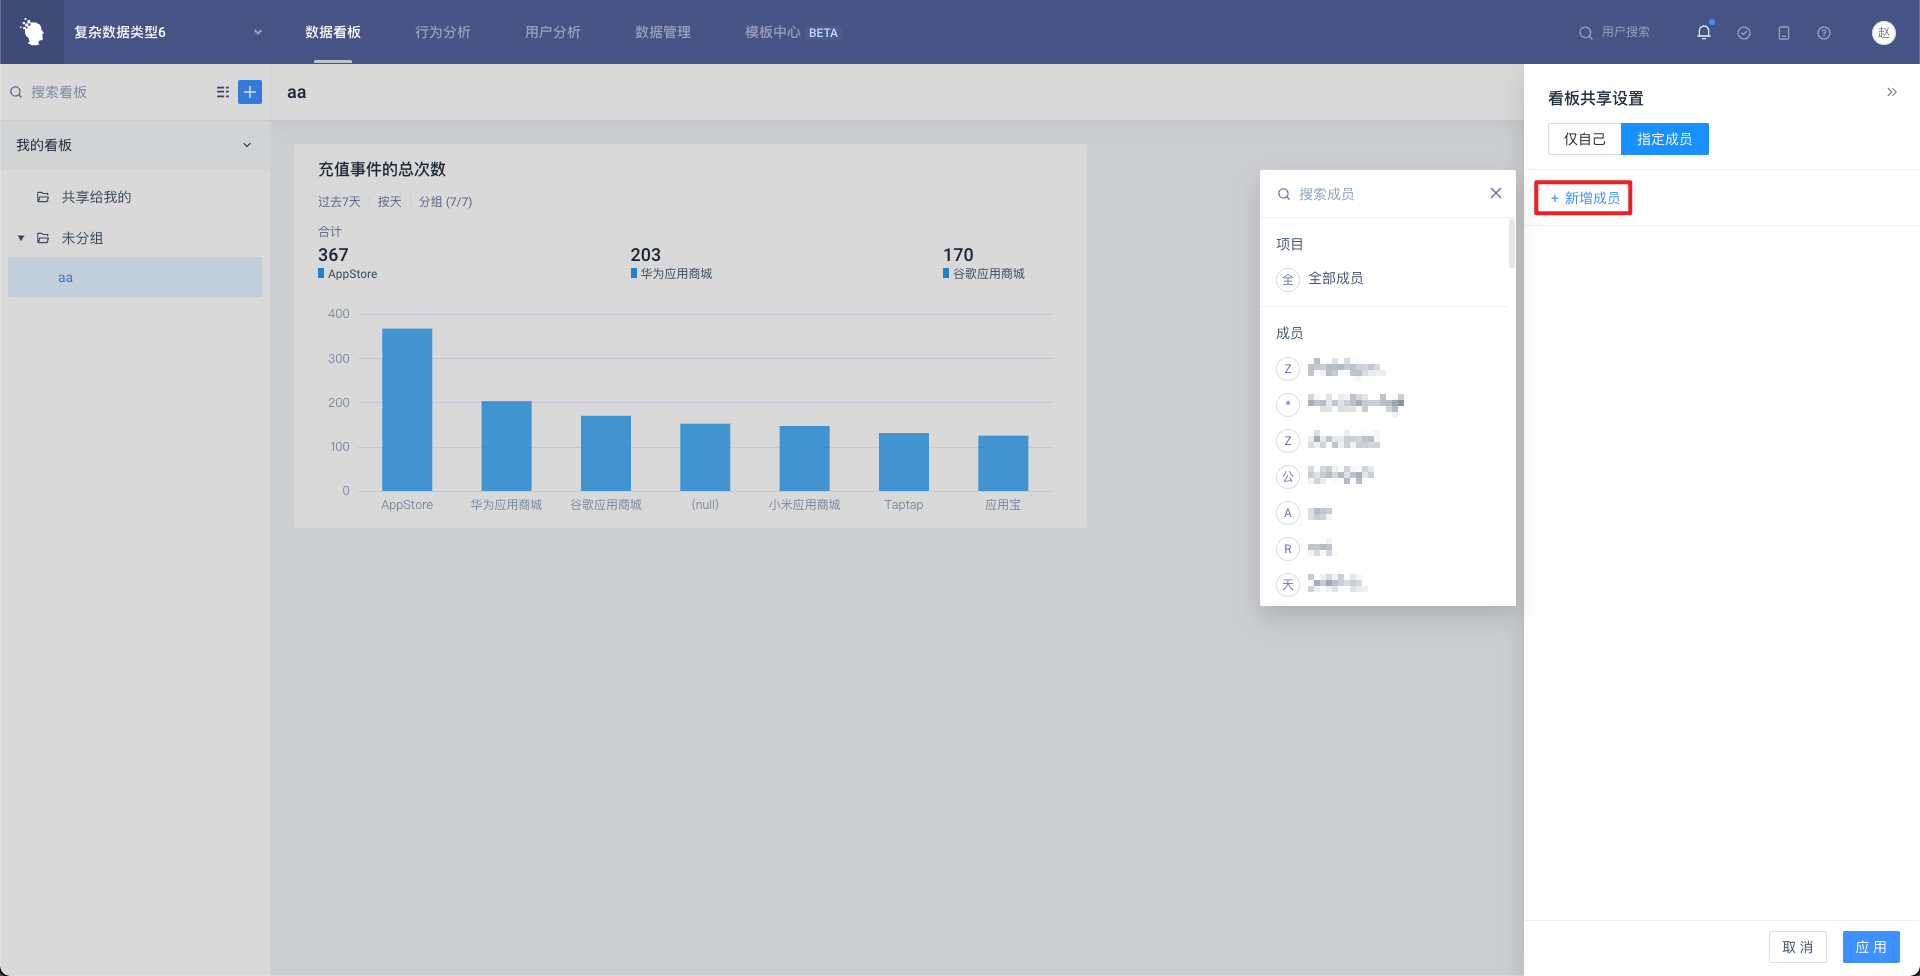
- Finally, click the 'Share' button in the upper right corner and share the dashboard with the relevant users to complete the dashboard editing.
# 1.2 Notes on Dashbaords
a**. The display method of the report table in the dashboard (such as analysis time, analysis object, chart type, etc.) is set by the dashboard creator, and users cannot modify it:**
- The chart type and report size are directly modified in the dashboard.
- The position of the report in the dashboard is set in the editing interface (click the 'Edit' button in the upper right corner).
- For the setting of analysis time, analysis object, and analysis steps of the report, you need to enter the selected report to 'update the report'. You should click 'Start Calculation' first and update the report after the calculation.
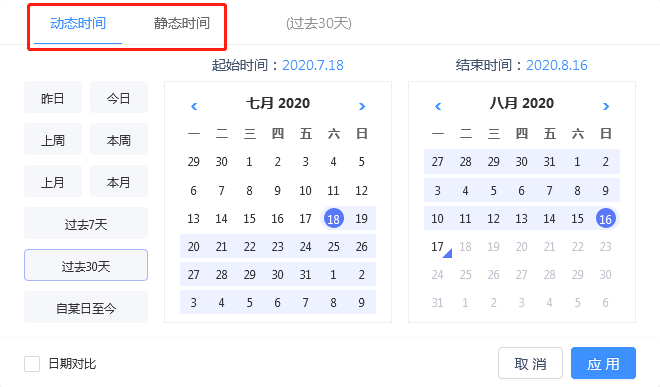
b**. There are two types of time in the report, relative time and absolute time😗*
- The relative time changes with the time of the analysis.
- Once the absolute time is set, it will not change, and the time period at the time of setting will be maintained.
The setting column of relative time and absolute time is shown in the following figure. Please pay more attention when setting:
If you need to change the analysis time of the report, you need the report creator to enter the report (click the report name or 'saved report' in the analysis module to enter), and click 'update report' after adjusting the analysis time.
c. For the shared dashboard, analysts and administrators can enter the report and click 'Save As' to obtain a copy of the report created by themselves. After that, the copy can be modified, edited, or added to the self-built dashboard.
Detailed dashboard and report settings can be found in the data dashboard and report management sections.
# 1.3 Report Dashboard Set Recommendations
- When sharing a dashboard, we need to pay attention to whether the recipient of the dashboard has the right to view the data on the dashboard. They should share the dashboard after they have a clear understanding of the users' needs and rights. If you need to consider data rights, it is best not to randomly set up a wholly visible dashboard.
- Share dashboard setters should not be too many, typically one or two analysts to avoid confusion.
- Our recommended dashboard setup is to first set up a basic dashboard with all the basic metrics and share it with all users, then share the dashboard related to their business according to the users of different positions, and finally provide managers with streamlined core data dashboard.
# 2.Update Data Reporting Plan
As products are updated and iterated, the dimensions and metrics that need to be analyzed will change accordingly. Data Integration Schemes need to be updated continuously. This section mainly describes the process and precautions for updating Data Integration Schemes to help users better iterate Data Integration Schemes.
# 2.1 Add events, Event and User Properties
Adding events, event Properties, and user features are very simple. Only the newly uploaded data is needed. The TA background will automatically process the added events or Properties without setting them in metadata management.
- Add events: call the 'track' interface to upload new events and related Properties, and note that the event name is not duplicated with existing events.
- Add event Properties: add new Properties when uploading the original event, and the TA background will automatically bind the event with the new Properties.
- Add user feature: call the corresponding user feature interface.
After uploading the new data, check whether the new data is received in metadata management, confirm the receipt of the data, and then make metadata settings.
# 2.2 Delete events, Event and User Properties
Deletion events, event properties, and user properties can only be operated in metadata management, only the events and properties that need to be deleted need to be set to hide. You will not see hidden events and properties in the analysis, and hidden events will not be calculated into 'any event'. You can still upload hidden events and properties, but they will not be used in the analysis. When a property is hidden, it can no longer be uploaded and will not cause data anomalies.
Two points need to be noted:
- Events and Properties will only be hidden, configurations will not be deleted, and hidden events and Properties will not be deleted.
- Events are not classified by their Properties but are identified by their name only. That is, as long as the event name is the same, it is regarded as the same event regardless of its Properties; For example, if two data sets with different Properties but the same event name are considered the same event, the event has Properties that are a combination of the Properties of the two data sets, and the default Properties in the data are considered as the upload value of NULL.
If you need to delete data that is already integrated, please contact our team members**.**
# 2.3 Modify Event and User Properties
In the process of using TA, there may be an event property with an incorrect data type that you want to change from string type to numeric type. In this case, we recommend hiding the original Pro property and setting up a new one. It should be noted that the property name can not be the same as the original one.
# 2.4 Update SDK and Data Import Tools
We will continue to update the SDK and data transmission tools. You can find the latest version and update time of each Data Integration tool in the Data Integration doc. Updates are written at the end of the document, and you may choose whether to update or not.
# 2.5 About Product Update
TA will continue to maintain high-speed iteration, continuously introduce new features, and optimize the user experience and system performance, to provide you with better data service.
Users who use our self-hosting solution will also get our free version updates services. You have the option to upgrade your software at any time.
Product update instructions can be viewed here.