# Dashboards and Reports
# 1.Introduction
Dashboard is a collection of reports that include metrics and data visualizations, and Thinking Analytics (TA) supports placing a same chart into multiple dashboards.
You can save analysis results as reports and add them to your dashboard to facilitate monitoring of daily data. You can also place any tag under the item on your dashboard whether or not it was created by you.
In addition to reports, you can also add notes to the dashboard to assist with instructions.
# 2.Dashboard Overview
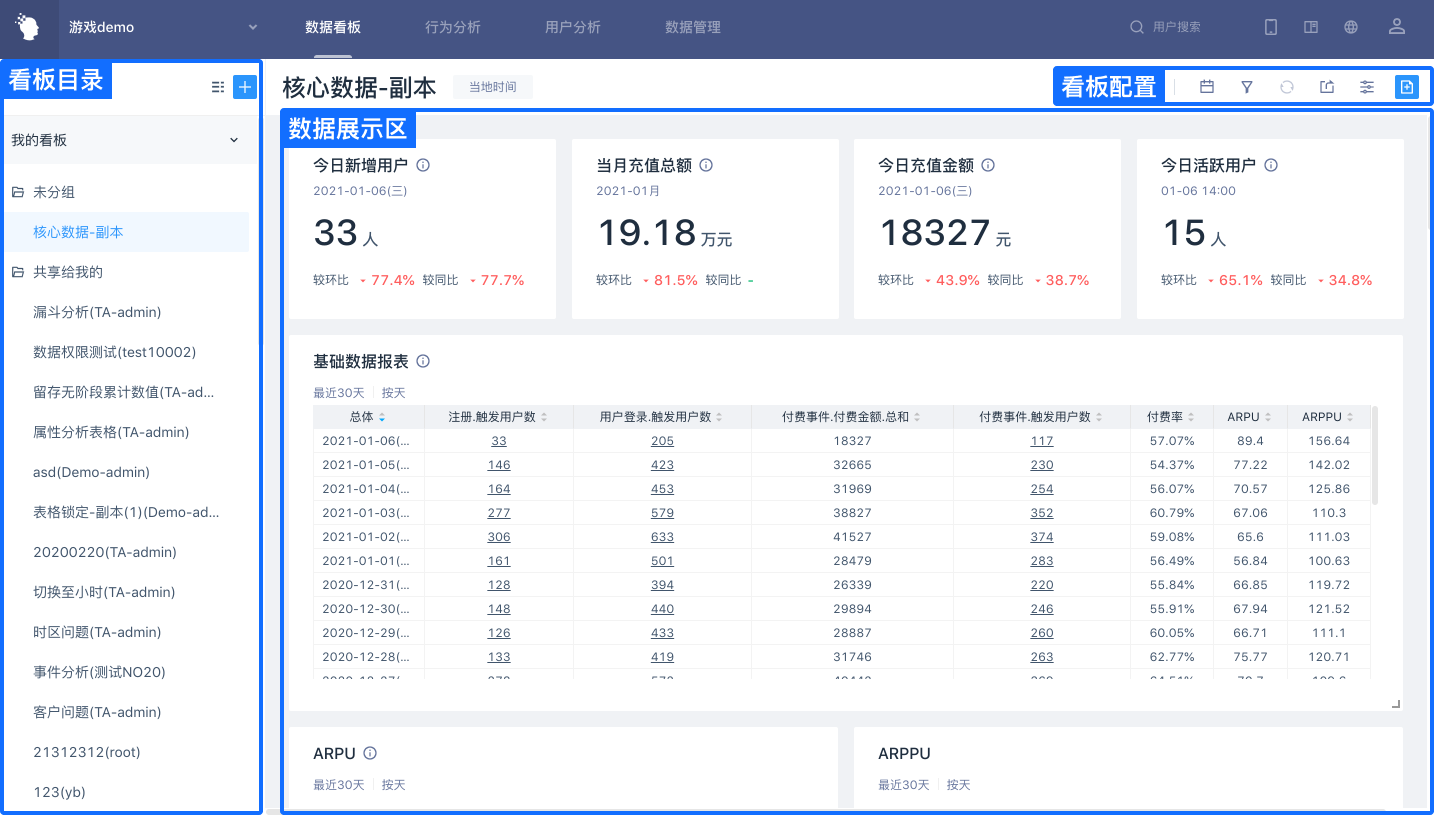
A dashboard consists of three areas: directory, Configuration, and Data display.
- Dashboard Directory: Create dashboard/folders to view self-built dashboard or shared dashboard for team members.
- Dashboard configuration: including adding dashboard content, setting dashboard sharing, adjusting dashboard settings, dashboard refreshing, setting global filtering for dashboard reports, etc.
- Data display: display information for each dashboard chart, support drag-and-drop sorting of dashboard reports, customize sizes and display types of reports.
# 3.My Dashboard Guidelines
# 3.1 Create/Edit Dashboard (Folder)
# 3.1.1 Create
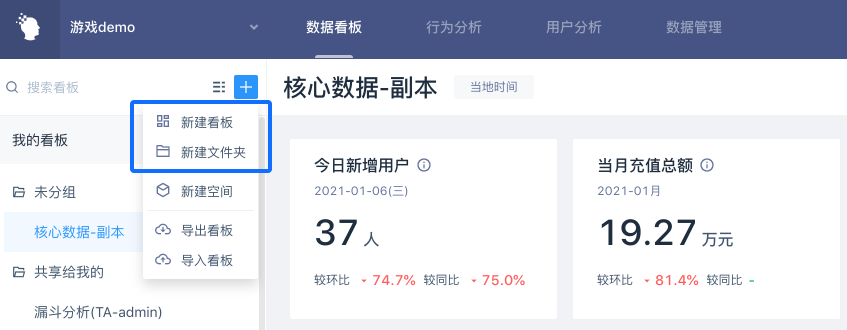
Company supervisors, administrators, analysts or other members with dashboard creation permission can select create dashboard or create folder by clicking on the upper right corner [+] in the left-hand column of the dashboard.
# 3.1.2 Rename
Move the mouse into the self-built dashboard or folder, click [...] and select 'Rename*'* to rename the dashboard or folder.
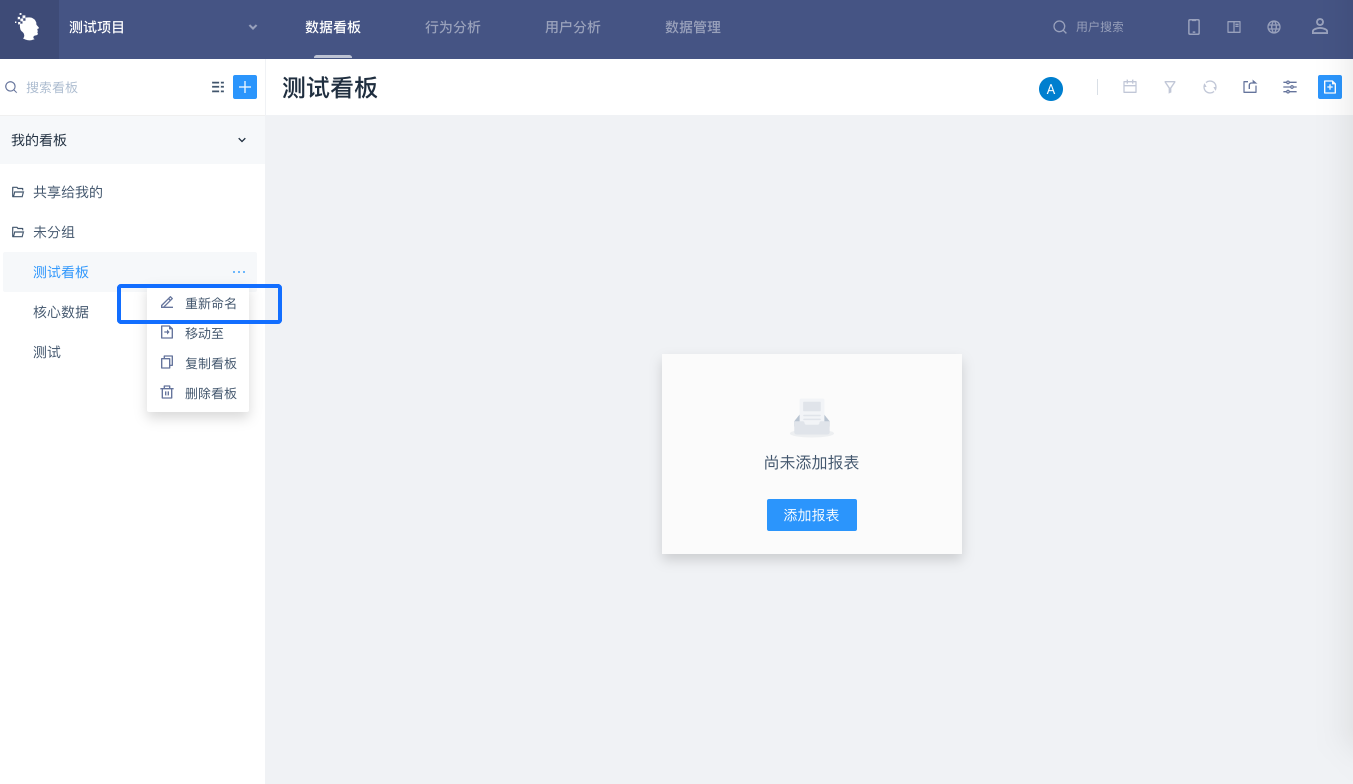
Note: "Ungrouped" folders and "Shared to Me" folders are system preset folders and rename operations are not supported.
# 3.1.3 Delete
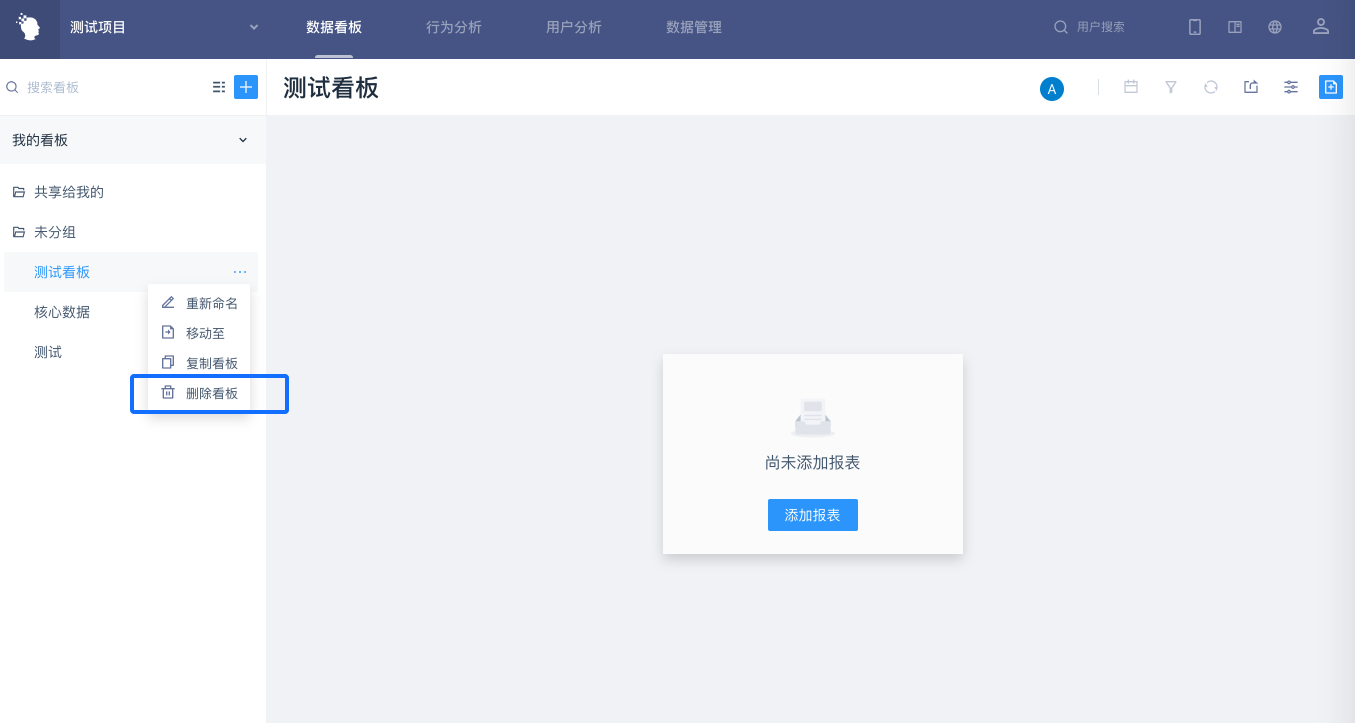
Move the mouse into the self-built dashboard or folder, click [...], and select 'Delete' to delete the dashboard or folder.
The dashboard under the folder will not be deleted with the folder. After selecting delete folder:
- The self-built dashboard will be moved to "Ungrouped" folder.
- The shared dashboard will be moved to the "Shared to Me" folder.
# 3.1.4 Dashboard Movement Sorting
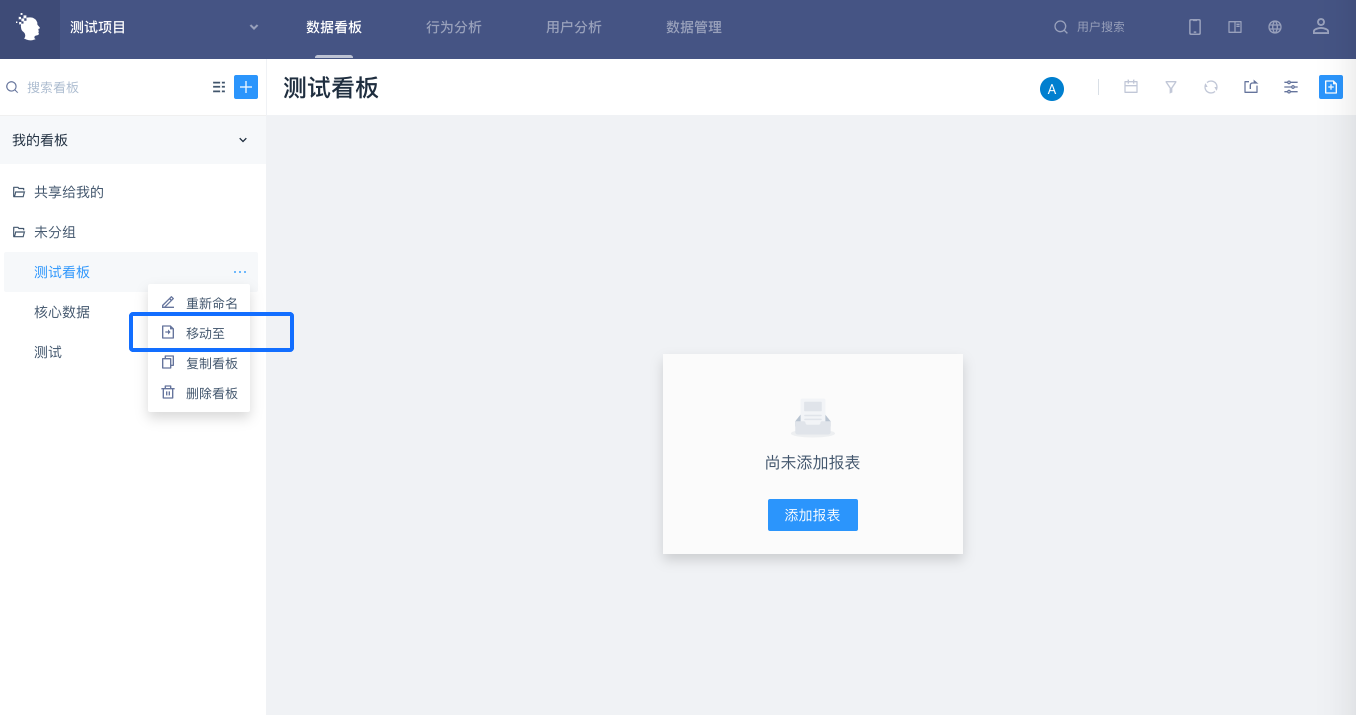
You can choose to drag the dashboard sorting directly, or click on the right side of the dashboard [...] Select 'Move to', where the self-built dashboard cannot be moved to the 'Share to Me' folder.
# 3.2 Manage Dashboard Content
Click the button at the top right of the dashboard, and click [Manage Dashboard Content].
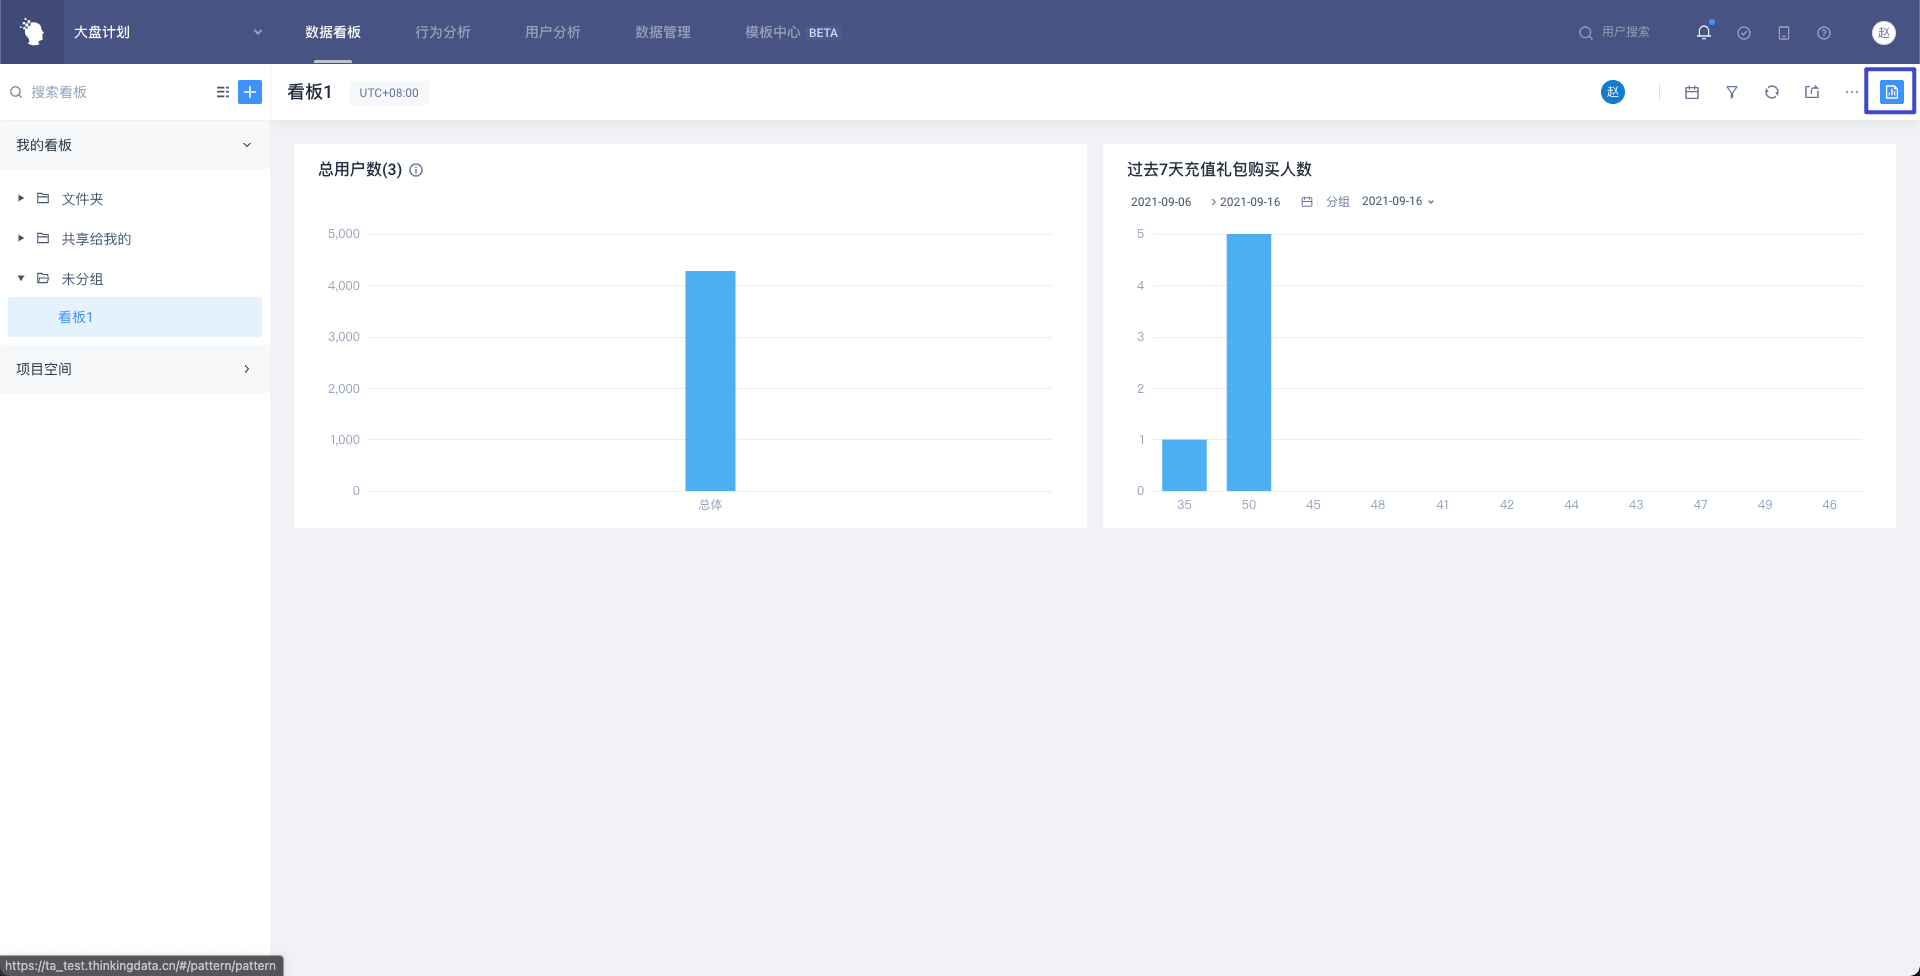
# 3.2.1 Add reports
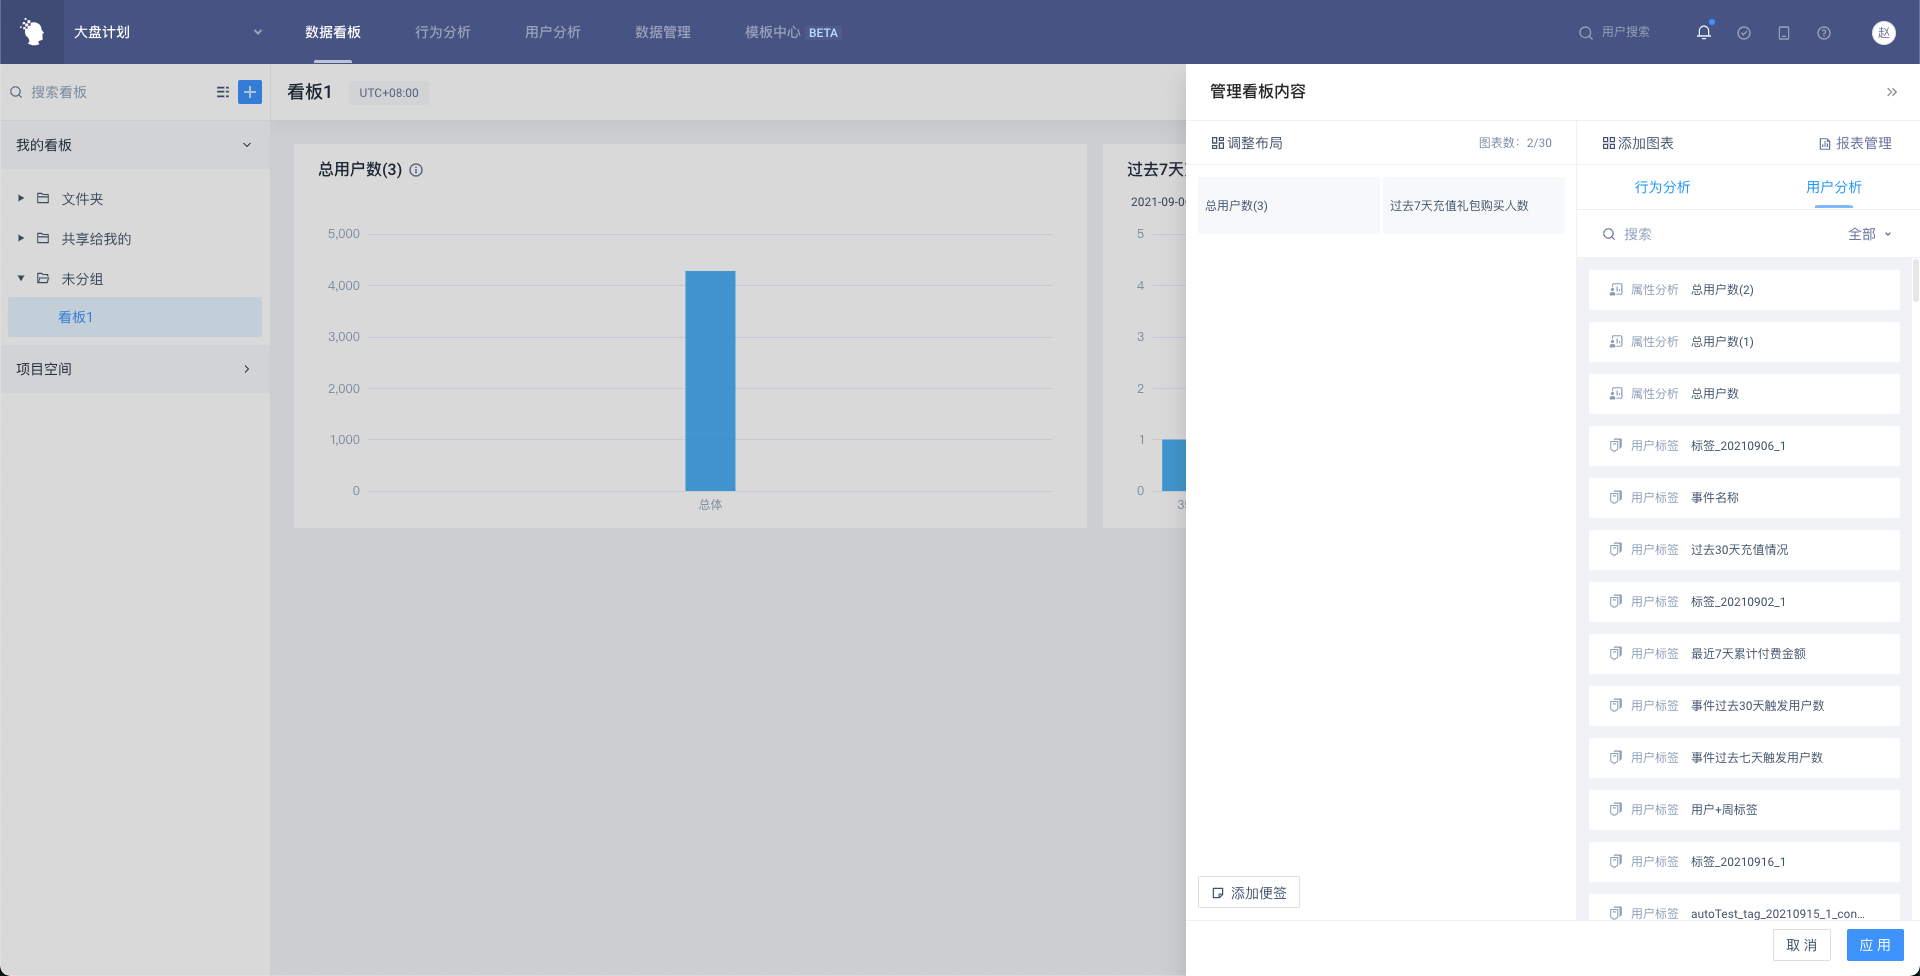
- The 'Add Chart' area on the right is divided into two tabs with the navigation bar sorted uniformly.
- Behavior analysis includes: event analysis, retention analysis, funnel analysis, distribution analysis, interval analysis, reports created by SQL queries.
- User profiling includes: reports and user tags created by attribute profiling.
- Move the mouse to the right and click [+] at the end of the line to add the report to the current dashboard.
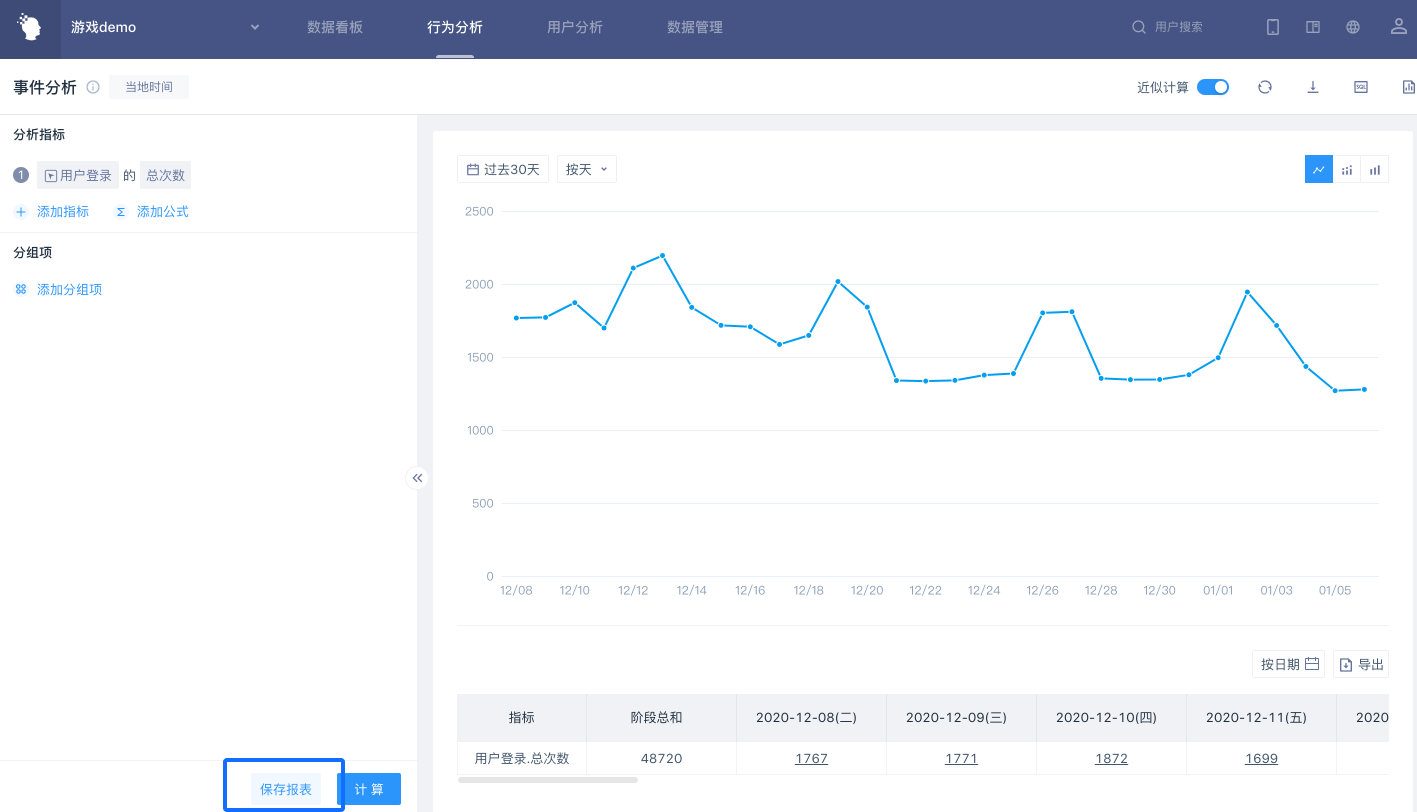
If there are currently no reports to add, you can create one in two ways:
Create a new report in the analysis model
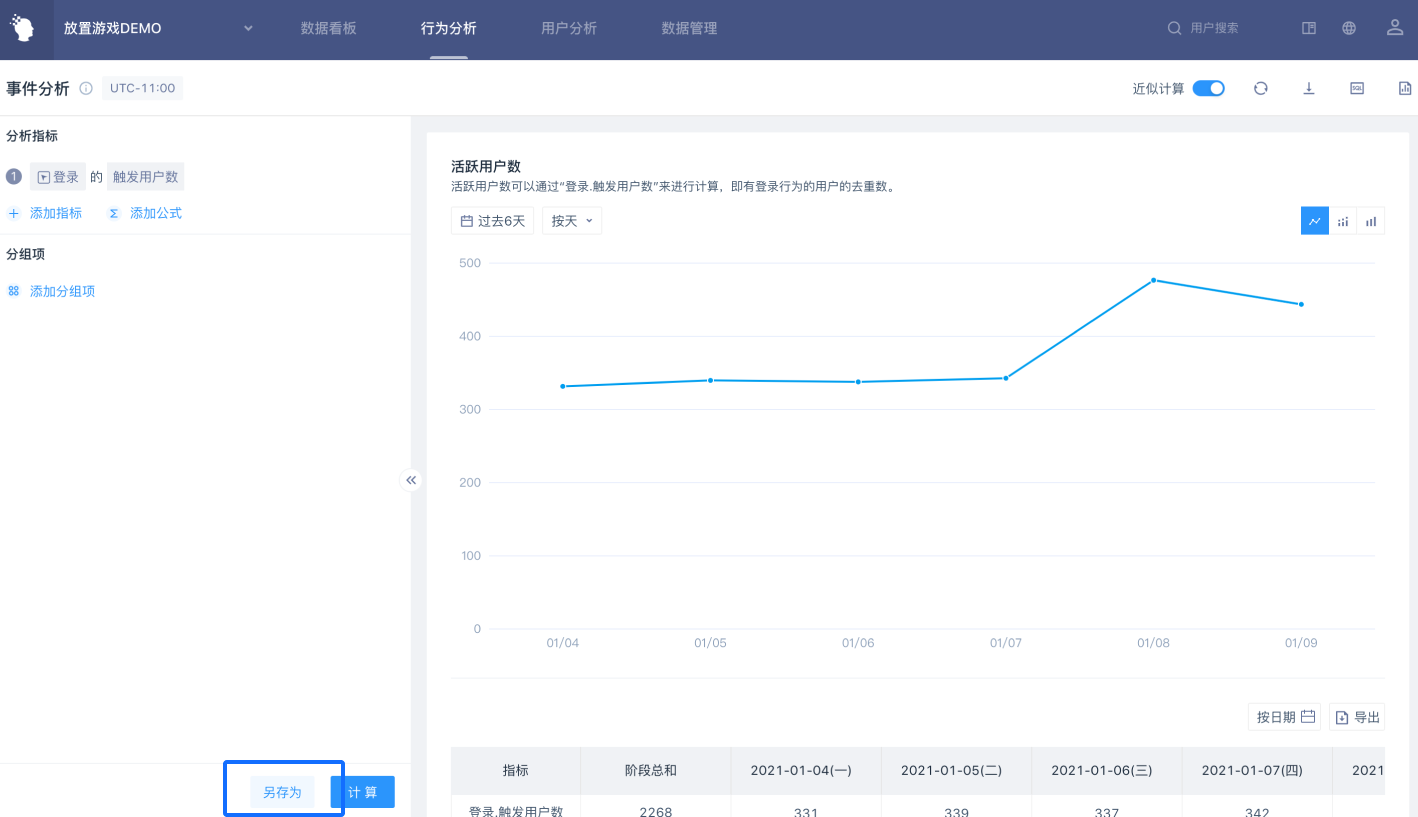
When viewing dashboard reports shared by others, analysts and above roles can save the current report as their own by clicking on the report name to enter the model page.
# 3.2.2 Add Notes
In the lower left corner of the* 'Adjust Layout' area on the left, click the 'Add Note' *button to pop up the dialog box where you can edit the title and content.
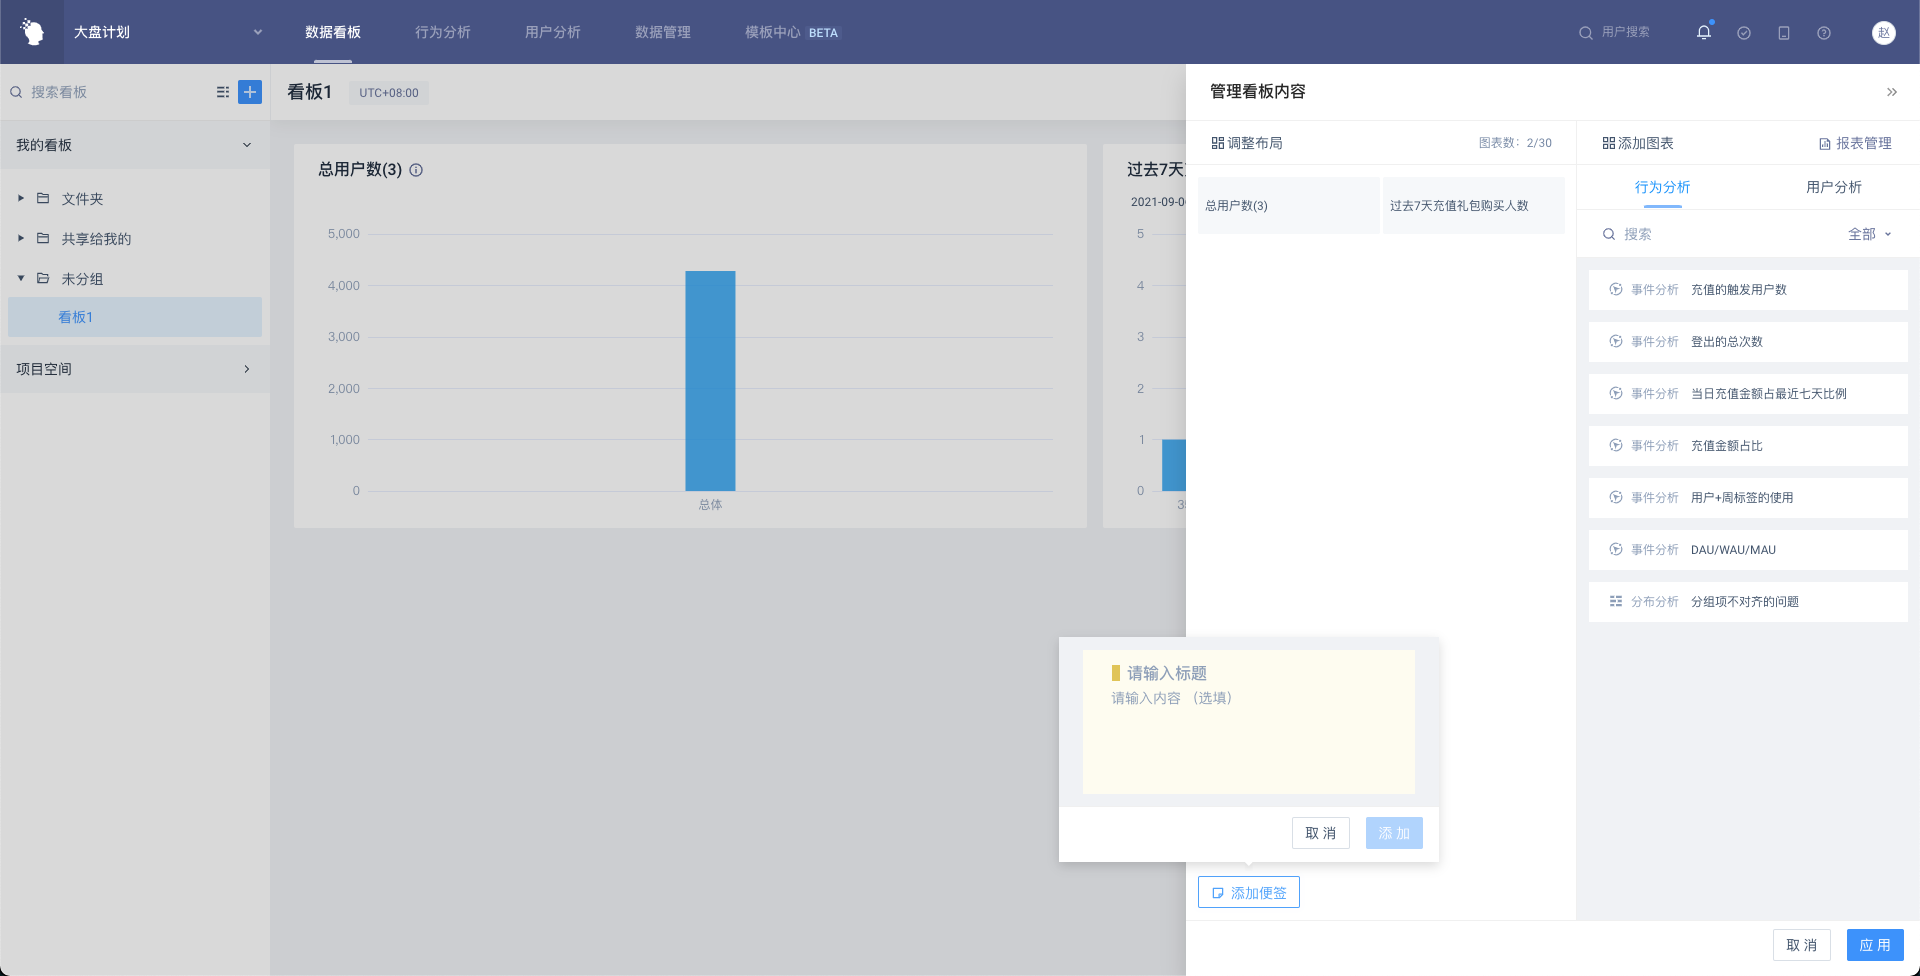
- Title: Required, up to 200 words.
- Content: Not required, up to 800 words.
# 3.2.3 Chart Adjustment
In the 'Adjust Layout' area on the left, hover over the report thumbnail, and click on the right section to expand the operation menu to resize and remove the chart. Alternatively, you can adjust the position of the chart here by dragging.
# 3.3 Dashboard Sharing and Collaboration
TA supports sharing the self-built dashboard with other members of the team, adding other members as dashboard collaborators, and editing dashboard jointly to enable collaboration within team members.
# 3.3.1 Set up Dashboard Sharing
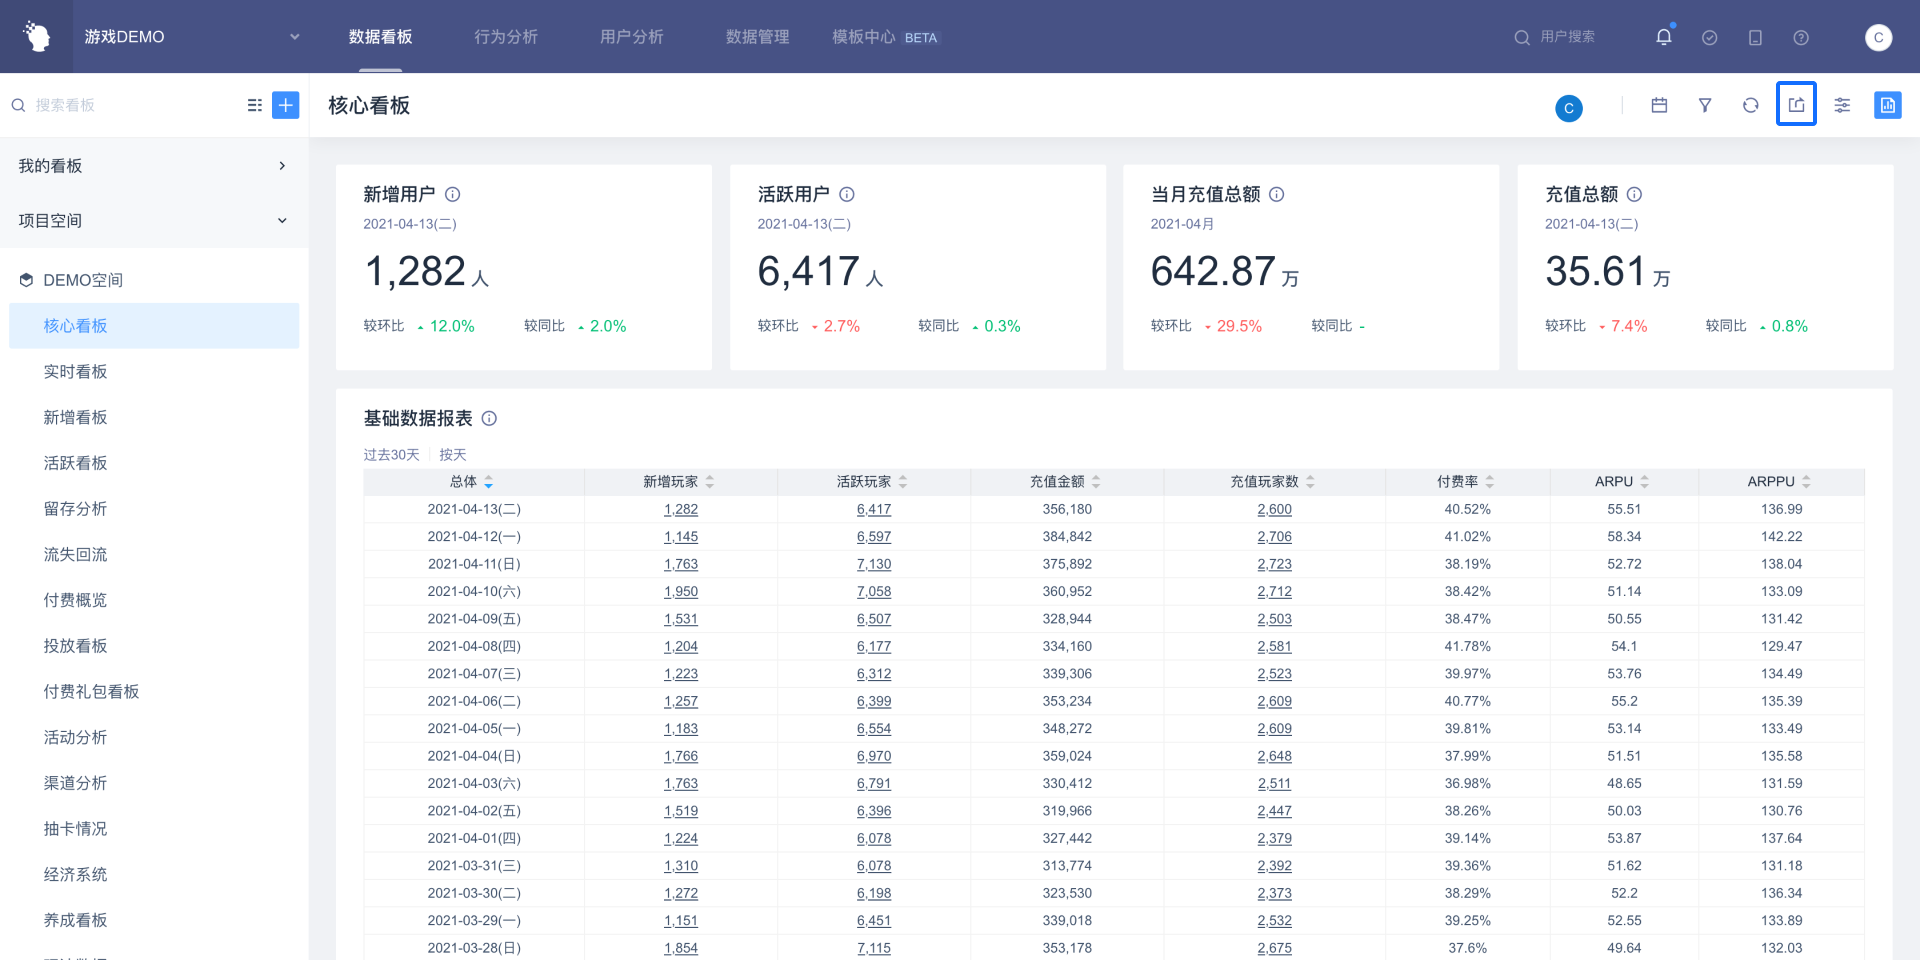
Click the [Share] button at the top right of the dashboard to enter sharing settings.
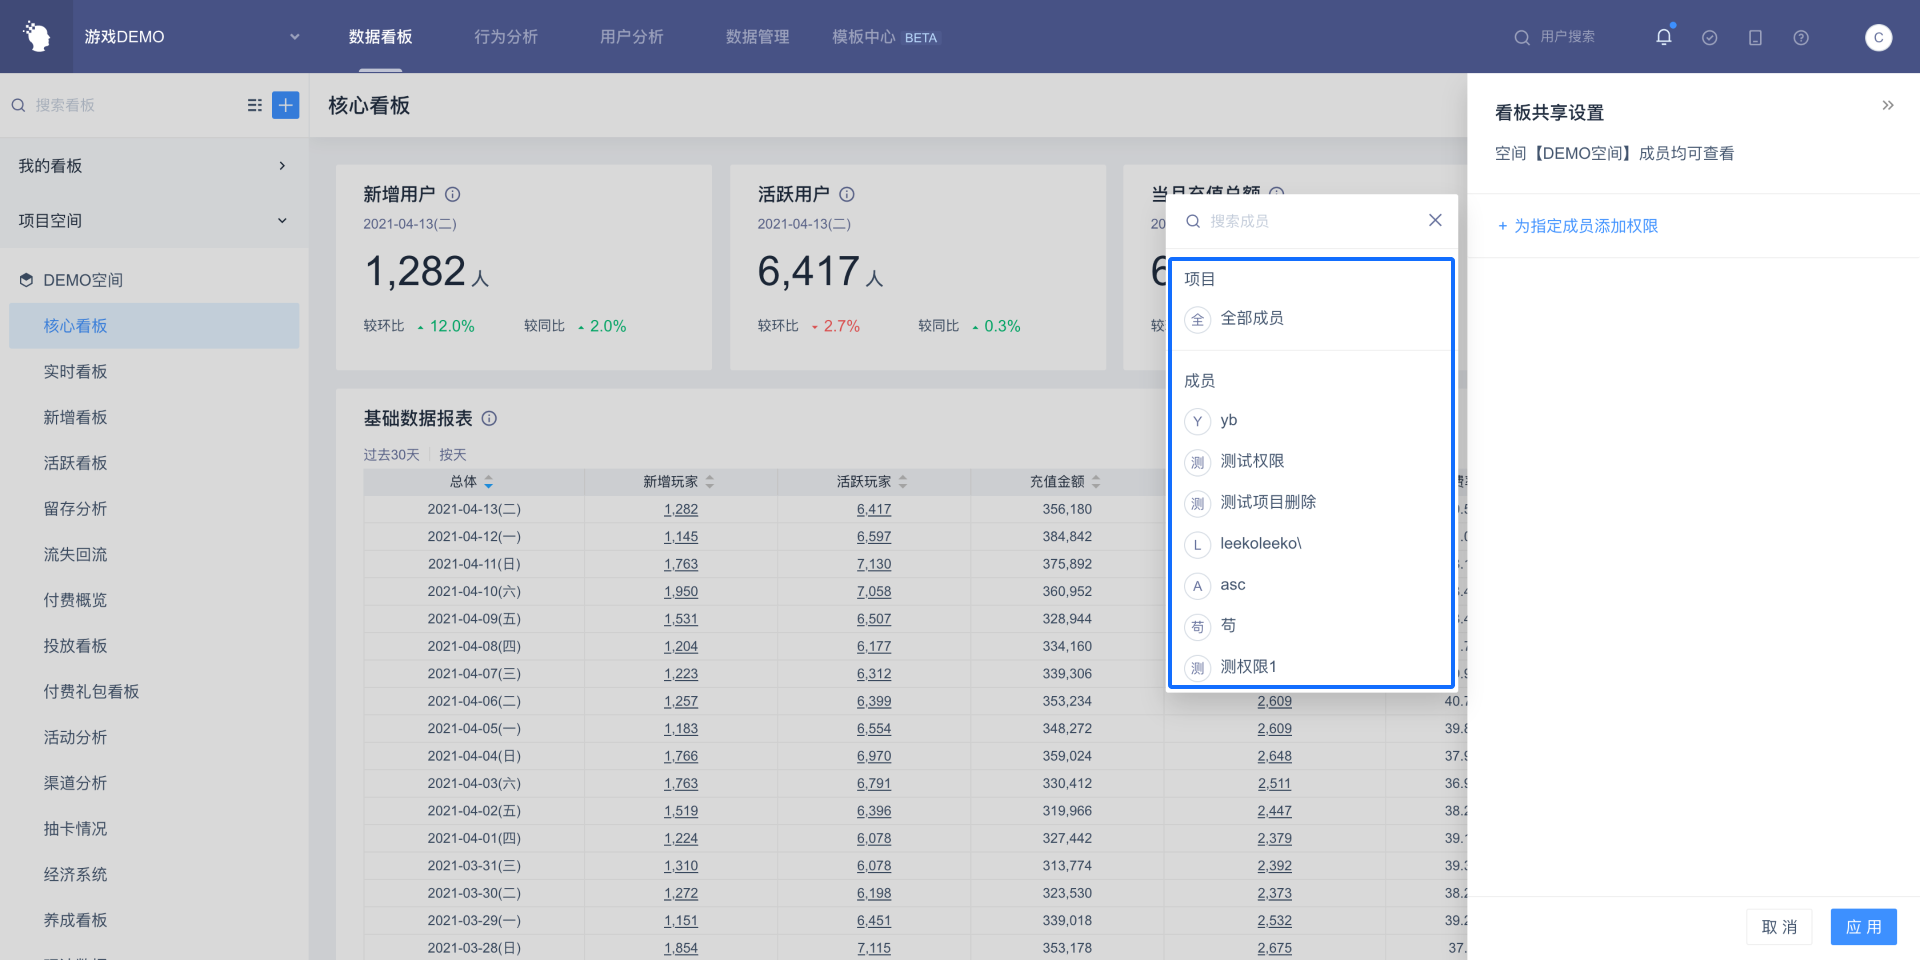
Dashboard defaults to self-visible only. Click [Designated Members] to add a shared object for dashboard. You can choose to share dashboard to:
- All Members: All members of the project are visible.
- Membership Group: Members of the Membership Group are visible (Membership Groups can be set in Project Management - Membership Management).
- Specific member: Specify a member is visible.
# 3.3.2 Set up Dashboard Collaboration
By default, the shared user only has dashboard viewing permission and cannot modify the content and display. After selecting the member or the member group, the 'viewer' can switch the permission of the shared user to 'Collaborator'.
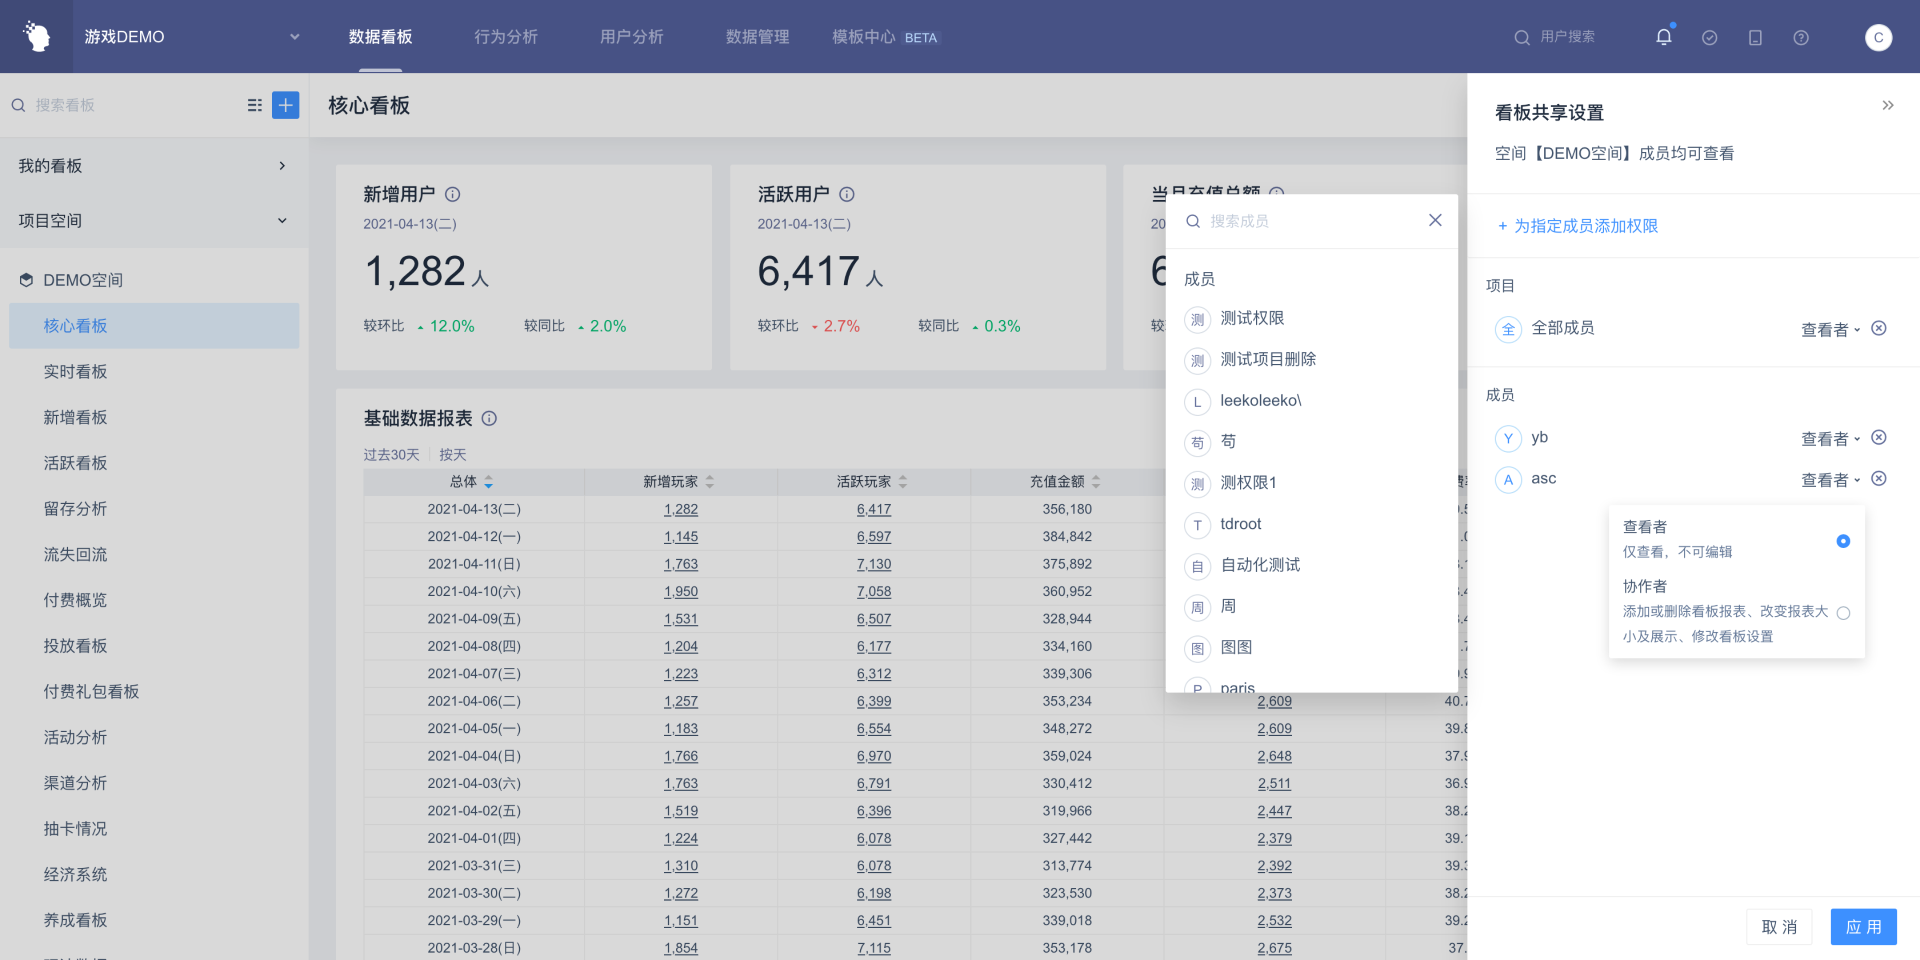
Dashboard collaborators have the operation permissions including (the following permissions shall take effect when the collaborators are analysts and above):
- Add or remove dashboard reports (move the mouse to the added report list to view the report creator information in details).
- Add or remove, replace dashboard default filter (global default).
- Change dashboard chart size and display (change chart size and display type).
- Modify dashboard settings (including updates, approximation calculations and timezone settings).
- View the sharing status of the dashboard.
# 3.4 Copy Dashboard
In the process of using dashboard, if you want to make further analysis and adjustment on the basis of a dashboard, you can use the copy function. TA Supervisors, Administrators and Analysts have permission to copy dashboard by default.
Click [...] on the right side of the dashboard, select Copy dashboard, rename dashboard and specify the folder to be copy to, and click OK to complete the copy of the dashboard.
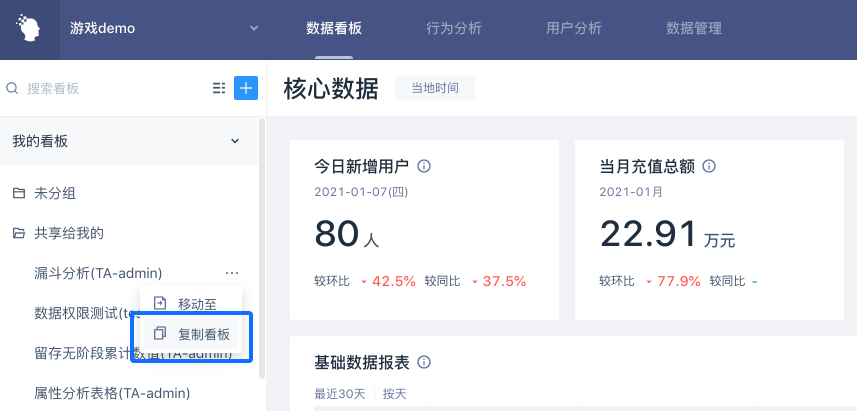
- Copy dashboard will copy all reports in the dashboard at the same time.
- Copy dashboard will follow the original settings (update mode, approximate calculation, time zone settings).
- The sharing status of the copied dashboard is "only visible to myself" by default.
# 3.5 Dashboard Settings
# 3.5.1 Update
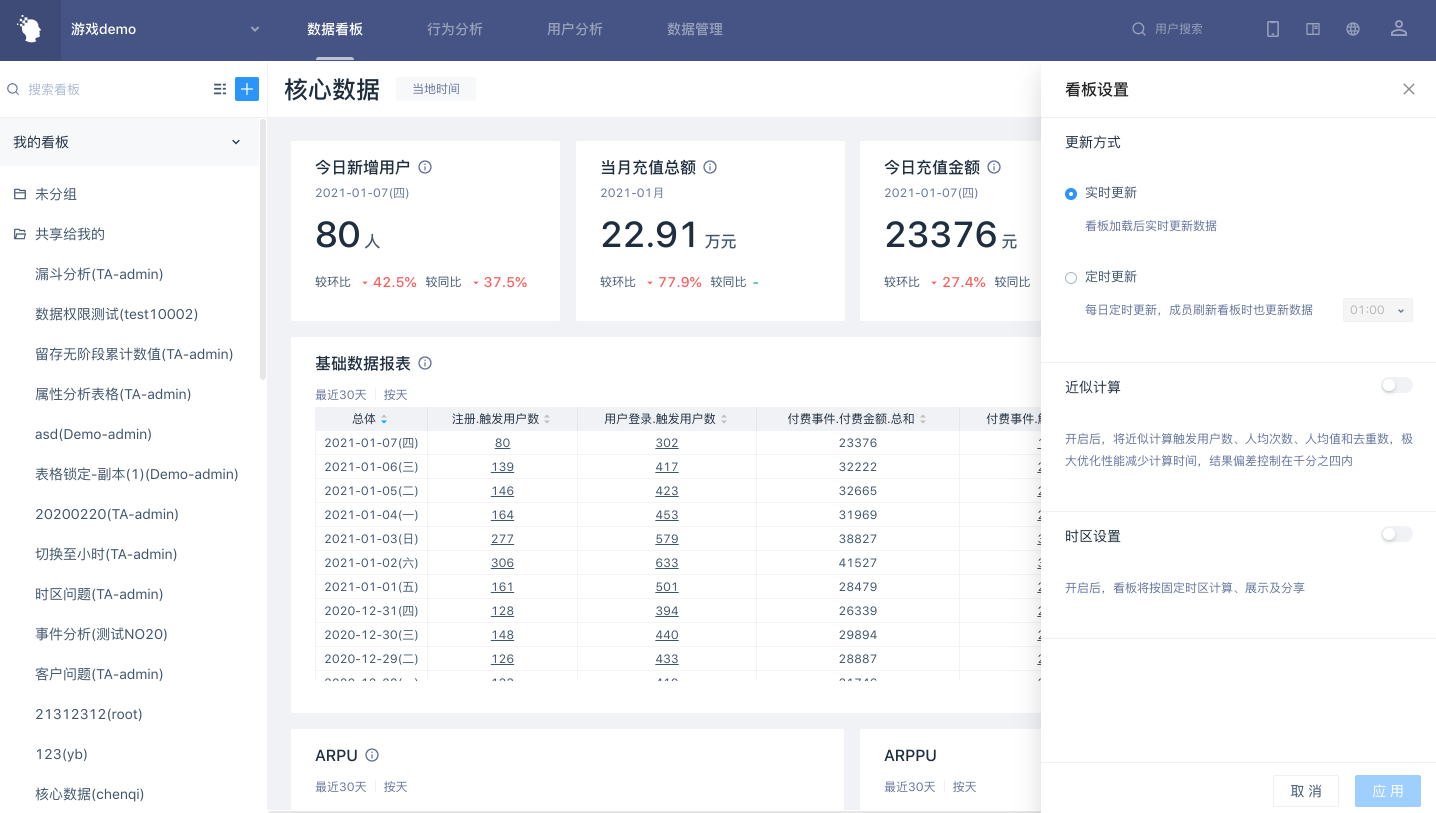
Dashboard defaults to real-time updates, i.e. it is updated every time the calculation is refreshed.
When the timing update is turned on, the system will refresh the calculation results for the dashboard at regular intervals every day, cache the results for the next review. For scenarios with more reports or computations loaded on dashboard, it is recommended to turn on timing updates to improve display efficiency.
# 3.5.2 Approximate calculation
Dashboard defaults to accurate calculation, i.e. each calculation will be calculated according to the conditions.
If there is a need for query efficiency, you can select the Approximate Calculation option. After switching on, approximate algorithm will be adopted for triggering user number, per capita number, per capita value, de-multiplier and other data, which can greatly reduce performance overhead and calculation time.
# 3.5.3 Time zone settings
For projects with multiple time zones, members in the project can select personal time zones from the configured time zone list, and view dashboard data according to personal time zone setting by default. For dashboar that wants members of the project to use the same time zone to view data, a fixed time zone can be specified for the dashboard, and the shared person can only view data according to this time zone.
# 3.6 Global Filtering
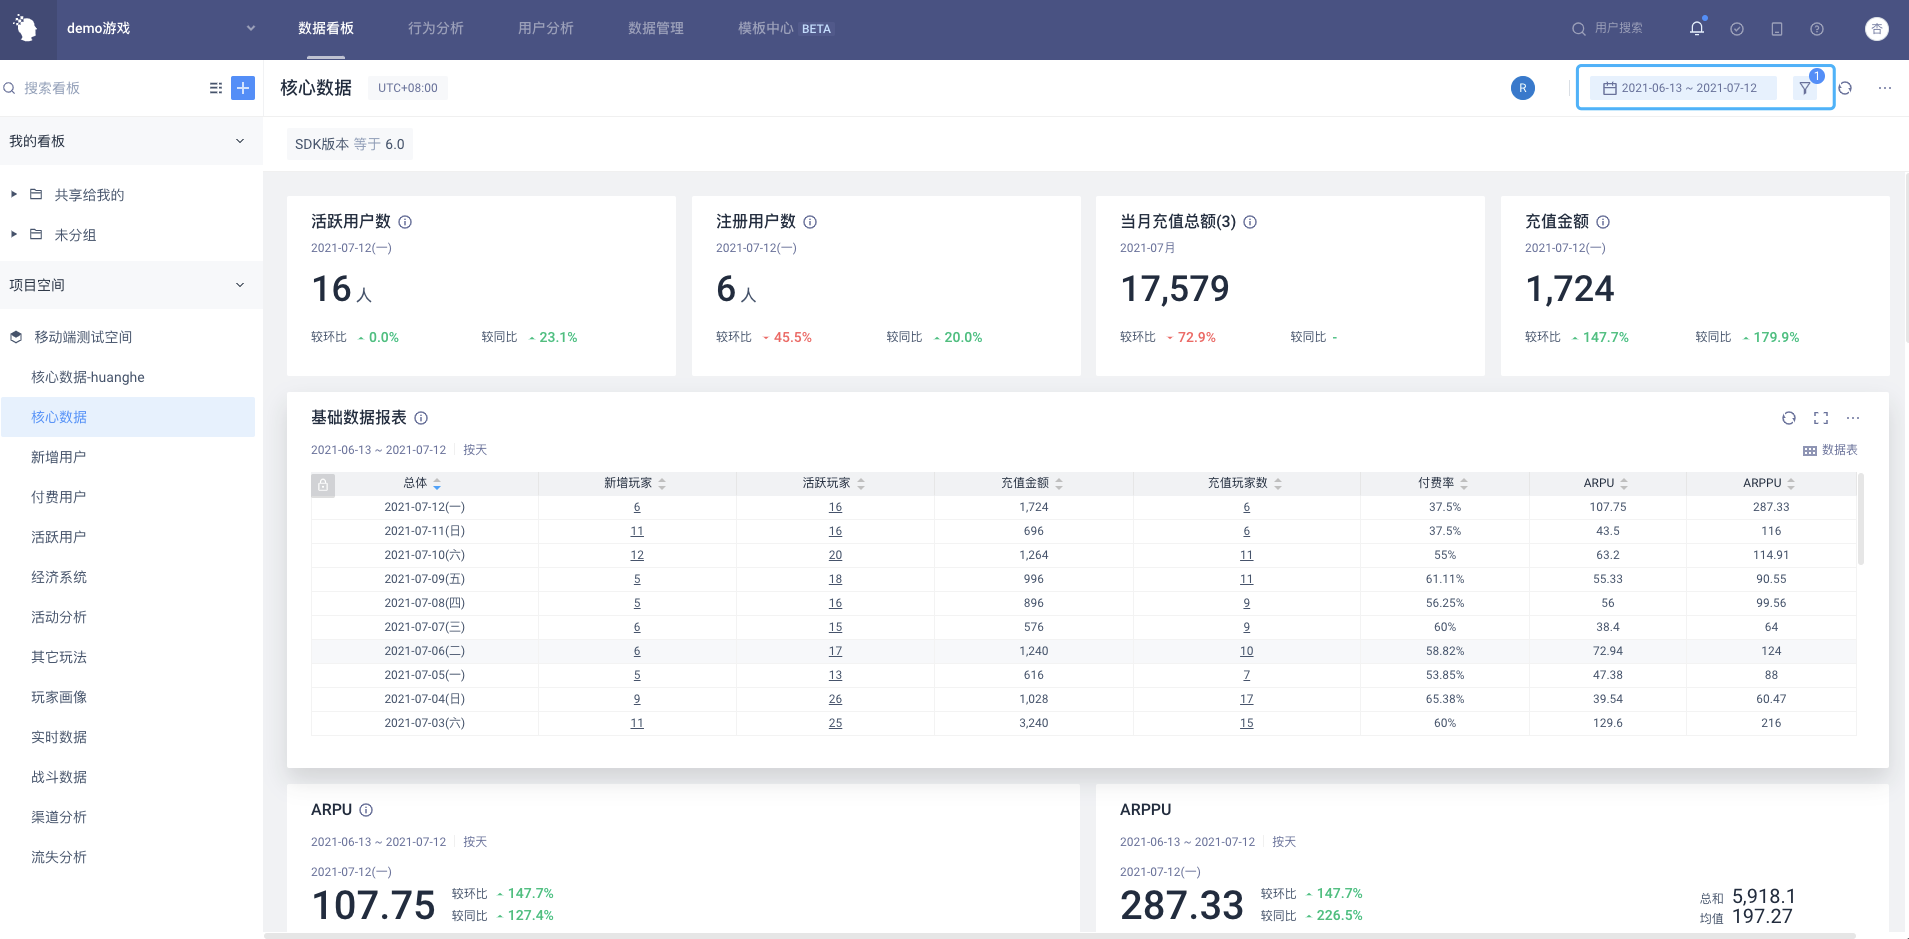
Note: All dashboard global filtering features do not take effect** on tags.**
# 3.6.1 Modify the Selection Requirements and Range
- The conditions that can be filtered are the public event attributes of [All Reports Included in dashboard] or all user features or user groups (conditional grouping + result grouping)
| Model | The events are |
|---|---|
| Event Analysis | All events analyzed |
| Retention analysis | Initial event + return event (no simultaneous display) |
| Funnel analysis | Funnel full step event |
| Attribute analysis | No event (do not participate in public event screening) |
| Distribution analysis | Analyze object events |
Up to 30 conditions can be set.
When calculating, each dashboard report in dashboard will be substituted with filters and time setting.
# 3.6.2 Modify and Analysis Time
# 3.6.2.1 Open and save timeframe
In any state , the timeframe can be switched, and the data granularity is days.
Initial option is "last 30 days" for static time
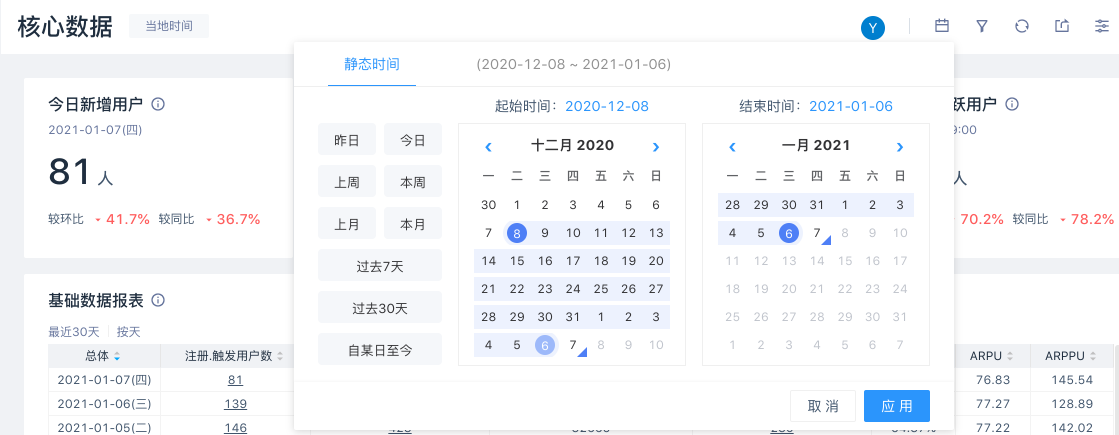
After selecting the app, execute in the following order:
- Toggle the display content of the global timeframe.
- Check if the current filter is valid.
- Enter the "filter condition is wrong" state when invalid.
- Valid time enters the condition and enters the calculation state.
- After the calculation is completed, switch the time to the same as the global timeframe and display the results of each report.
- When the calculation is completed, the filter condition becomes the calculation complete state.
# 3.6.2.2 Cancel global timeframe
After moving into the timeframe area, the cancel option will be displayed. Canceling the timeframe is equivalent to giving up the setting of the timeframe.
- Toggle the display content of the global timeframe to empty.
- Check if the current filter is valid.
- Enter the "filter condition is wrong" state when invalid.
- Valid time enters the condition and enters the calculation state.
- At this time, the calculated time information is the original time of each report. When completed, cut back the time of each report to the original time and show the results.
- After the calculation is completed, the filter condition is set to the calculation complete state.
# 3.6.3 Modify filter condition or timeframe scenarios
- When the overall timeframe is adjusted, the timeframe of each report on the page will be temporarily adjusted together and the result will be recalculated.
- When the filter condition is adjusted (that is, after the condition is changed and determined), it needs to be recalculated.
- Modify the content of a report and only recalculate the report without affecting the overall filtering condition.
- If you add or delete dashboard reports, they will be calculated as a whole according to the changed condition on the page.
- When logging out or switching dashboard, the filter condition and timeframe will be cleared. If you want to save, you can set it to [Favorites] or [Dashboard Default]
- When you refresh the dashboard, the filter condition and timeframe options will not be clear.
# 3.6.4 Save filter condition
Filters that need to be saved for a long time can be added to the personal favorites list and bound to the account.
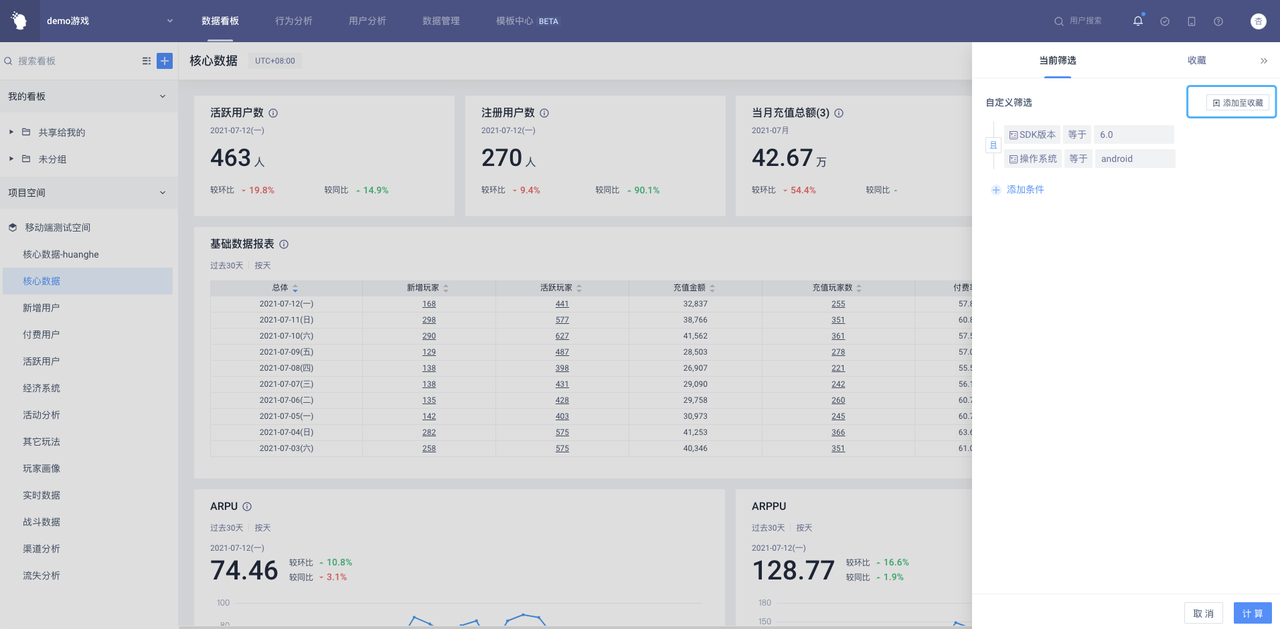
Under the "Favorites" tab, you can view the query condition that your already saved or calculate by the saved conditions. In addition, you can set the collection as default, rename or remove it. After setting the default, the condition is moved to the top for display. And when the default is cancelled, it will return to the favorites list.
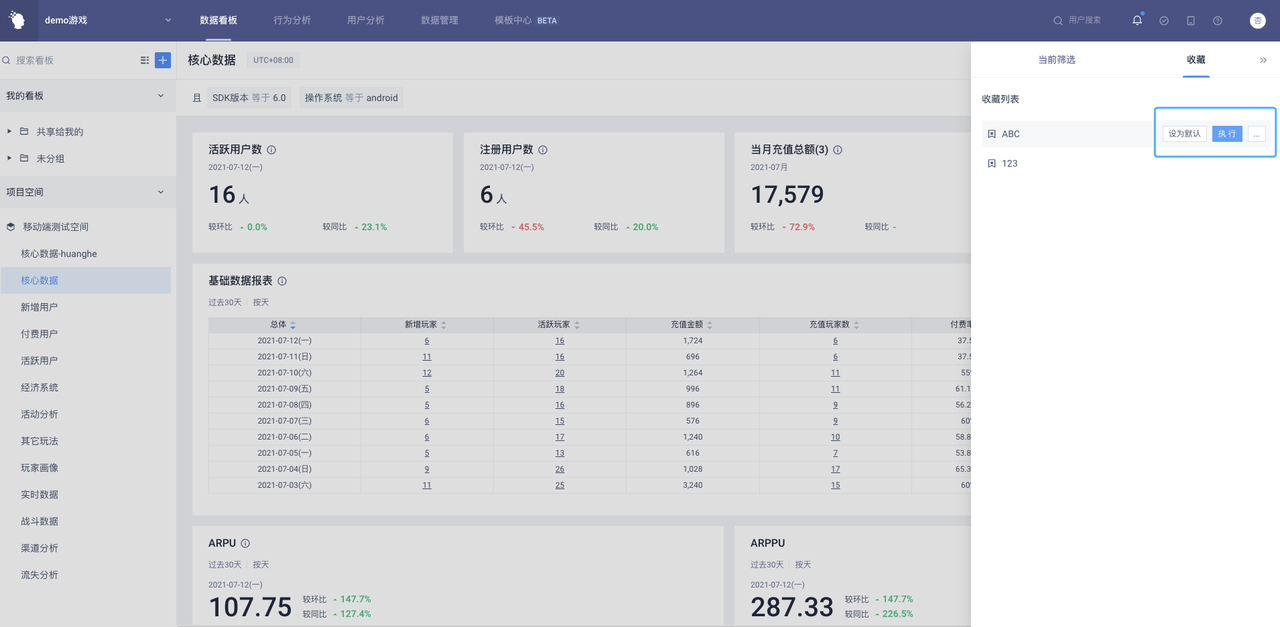
The operation permissions of the favorite list are as follows:
| Set/cancel global default conditions | Set/cancel personal default conditions | Remove collection (personal) | Rename (personal) | Execution | |
|---|---|---|---|---|---|
| Creator & Collaborator | ✅ | ✅ | ✅ | ✅ | ✅ |
| Common Shared Members | - | ✅ | ✅ | ✅ | ✅ |
# 3.6.5 Setting Dashboard Default Conditions
The condition that needs to be fixed on display can be set as the default condition, which will take effect by default when entering dashboard.
It includes the following two types:
- Global default condition
Effective for all dashboard shared members, only creators and collaborators have the permission to set
- Personal default condition
Effective only for the setter, when the dashboard also has global default condition, it will take precedence over the global condition.
There are two ways to set and cancel default conditions:
- Hover to the filter display area at the top of the dashboard and set default/cancel

- Set/cancel in the favorites list

Only the collected condition is allowed to be set as the default. When the default is removed, the condition will still be saved in the creator's personal collection.
# 3.7 Batch download
When downloading all the chart data on dashboard in batches, each chart corresponds to a csv file, the download process can be viewed in the task list.
Download data content is determined by chart settings and dashboard global filtering, and is not affected by temporary operations.

# 4."Project Space" Guideline
# 4.1 Usage Scenarios of Project Space
After setting up dashboard sharing under "My dashboard", the dashboard will be displayed under the "My dashboard" → "Shared to Me" folder of the shared person. With the further use of the system, the number of dashboards in the project is increasing. At the same time, it brings difficulties to the creators to set up dashboard sharing, sharing state management, the classification and arrangement of shared dashboards by the shared people, and dashboard coordination among team members. Using the function of project space, the batch sharing of dashboards and the unified classification of dashboards shared by multiple creators are available. Achieve a unified and structured team dashboard view to make communication and collaboration between team members more efficient and convenient.
# 4.2 Create/edit space
# 4.2.1 Create space
- Click [+] in the upper right corner and select [Create Space]. By default, TA hypervisors and administrators can create space.
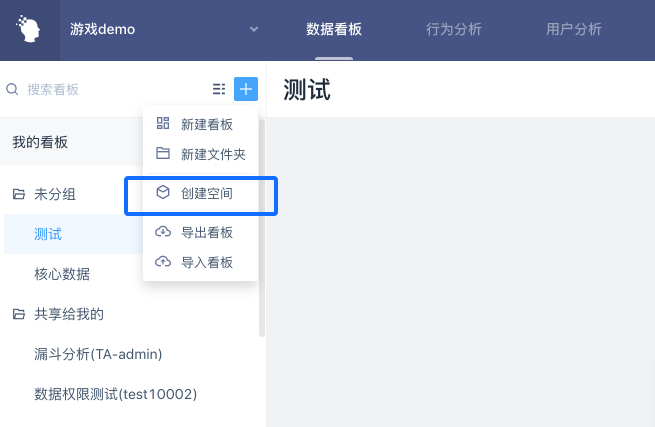
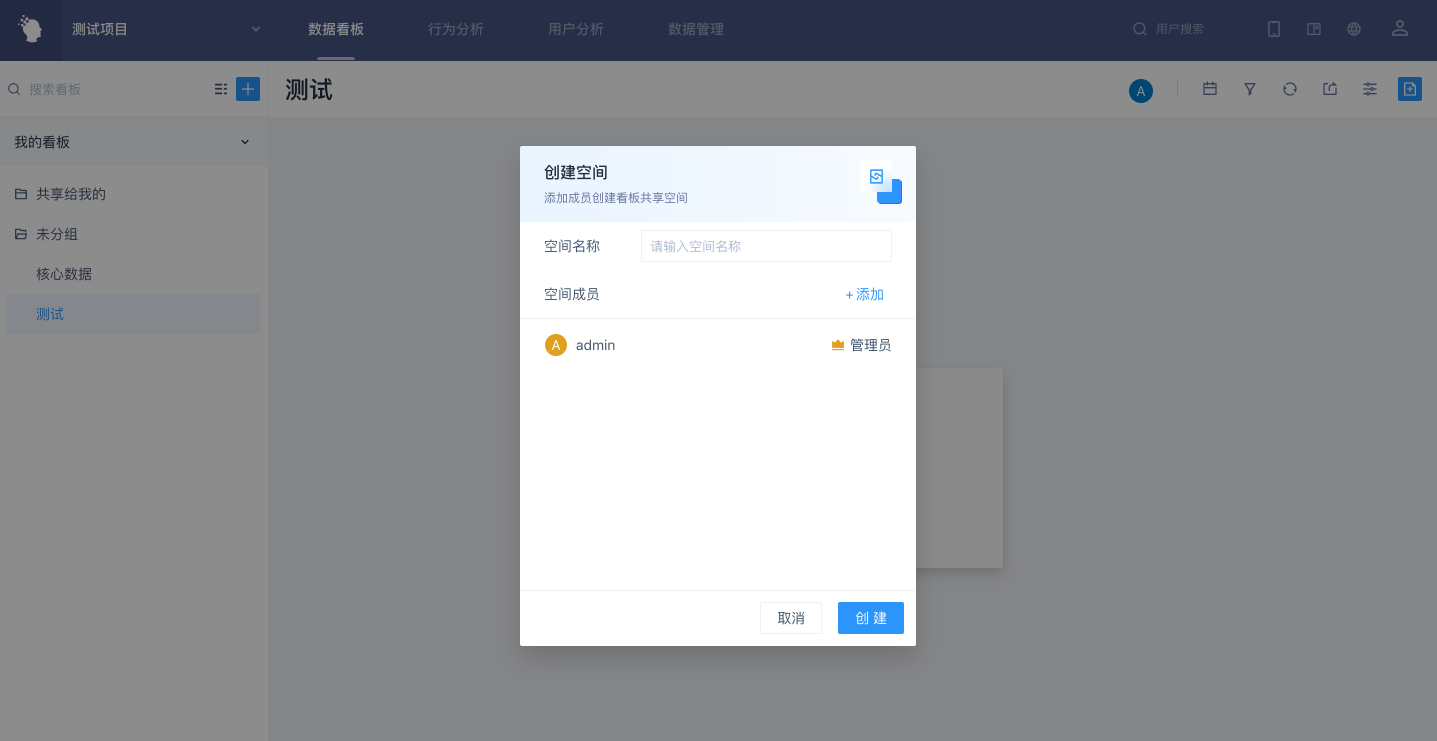
- Select the space member and set the space member permissions in the Create space bullet box. The dashboard in the space is visible to the space members by default.
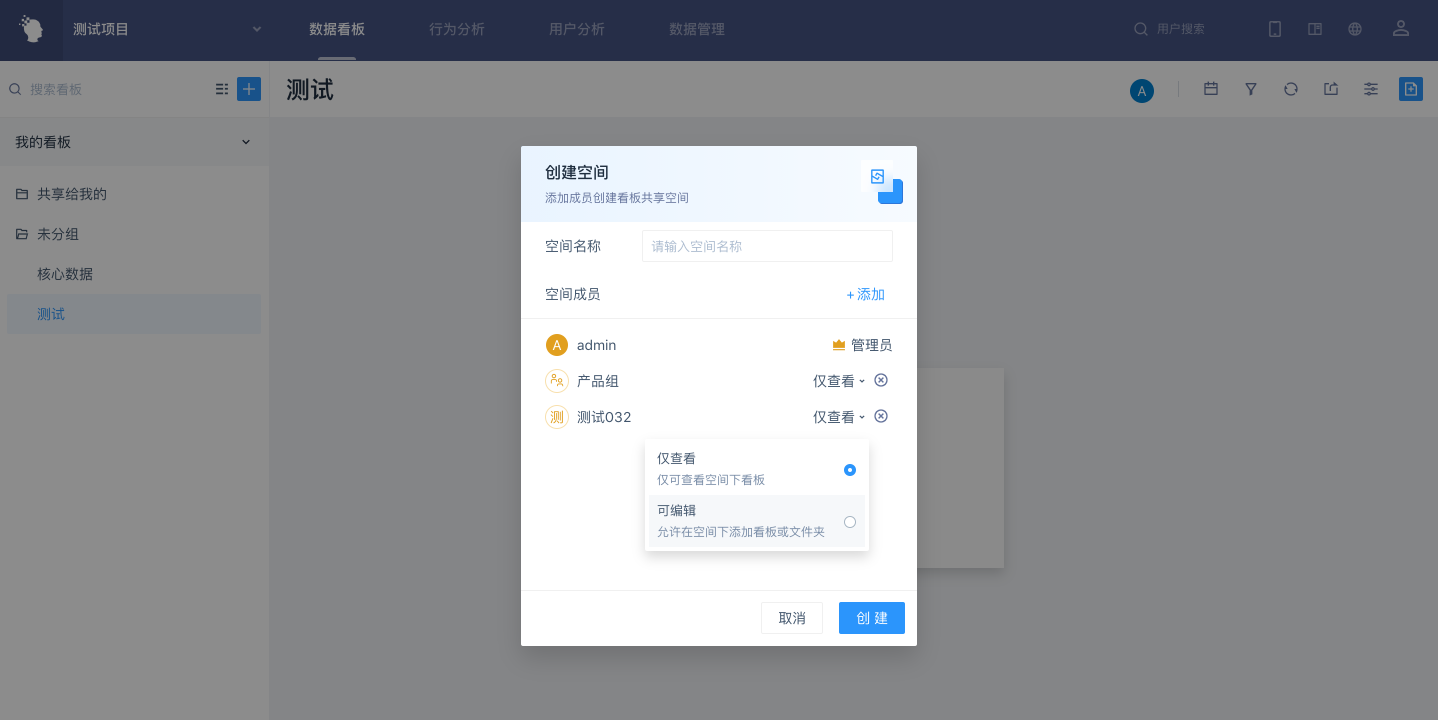
- Members with space permissions [View Only] can only view the space dashboard without any space editing permissions.
- Members with [Editable] space permissions can create a new dashboard folder in the space, drag and sort the space content.
Note: Space [Editable] refers to adding dashboard or folders in space, and has no editing permission for dashboard created by other members in the space**.**
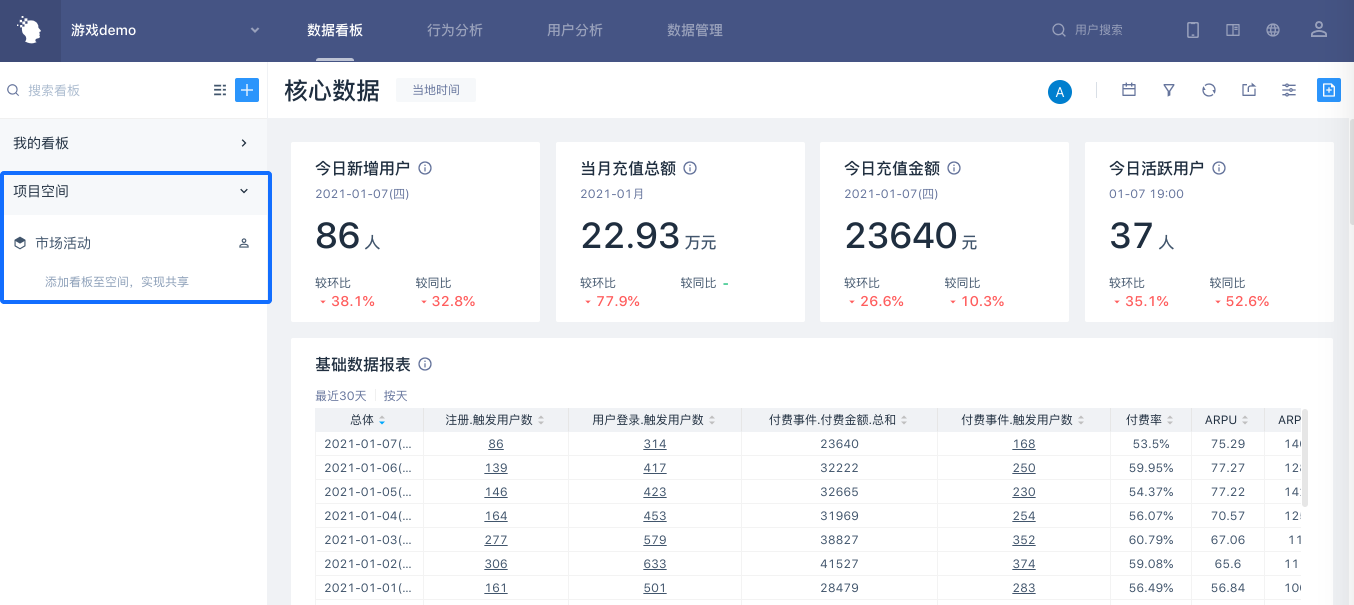
After successful creation, a project space catalog will be added under my dashboard catalog.
# 4.2.2 Edit space
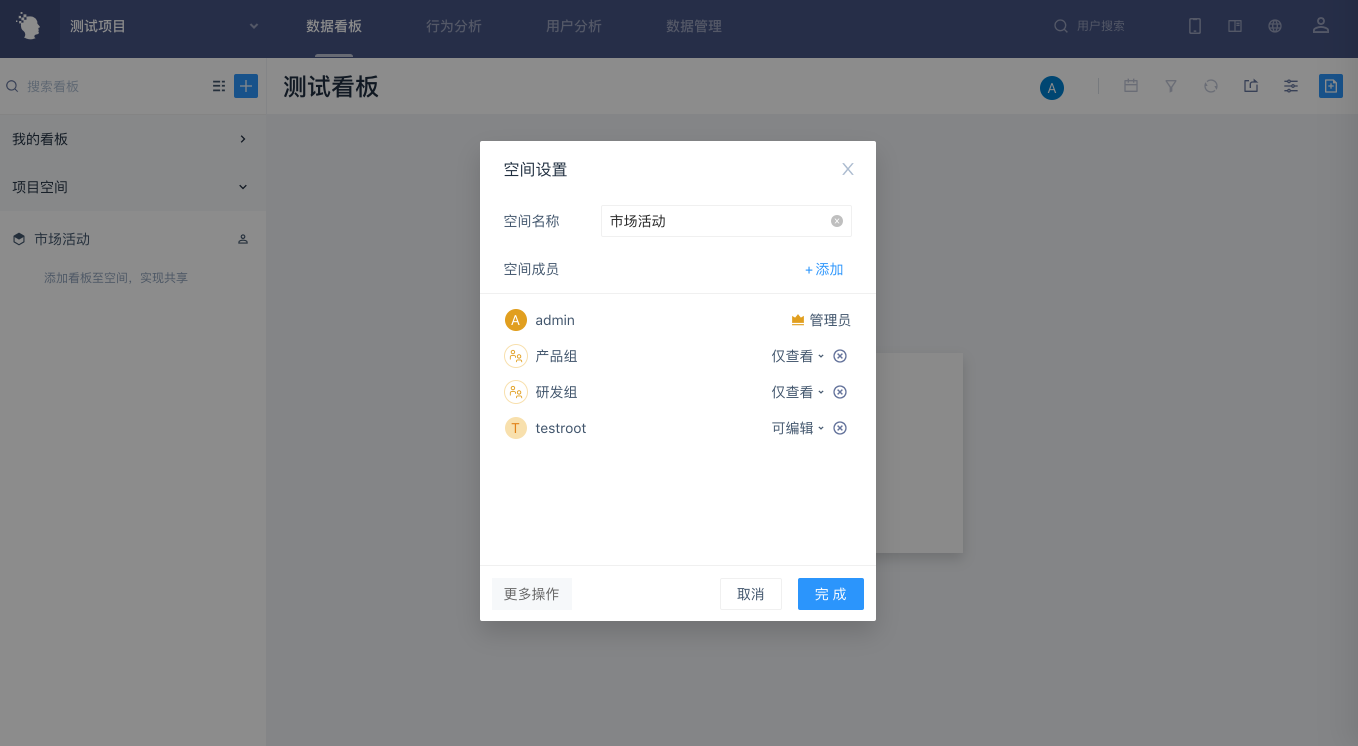
Move the mouse into the space name and click the [Member] button on the right to open the view/edit space settings:
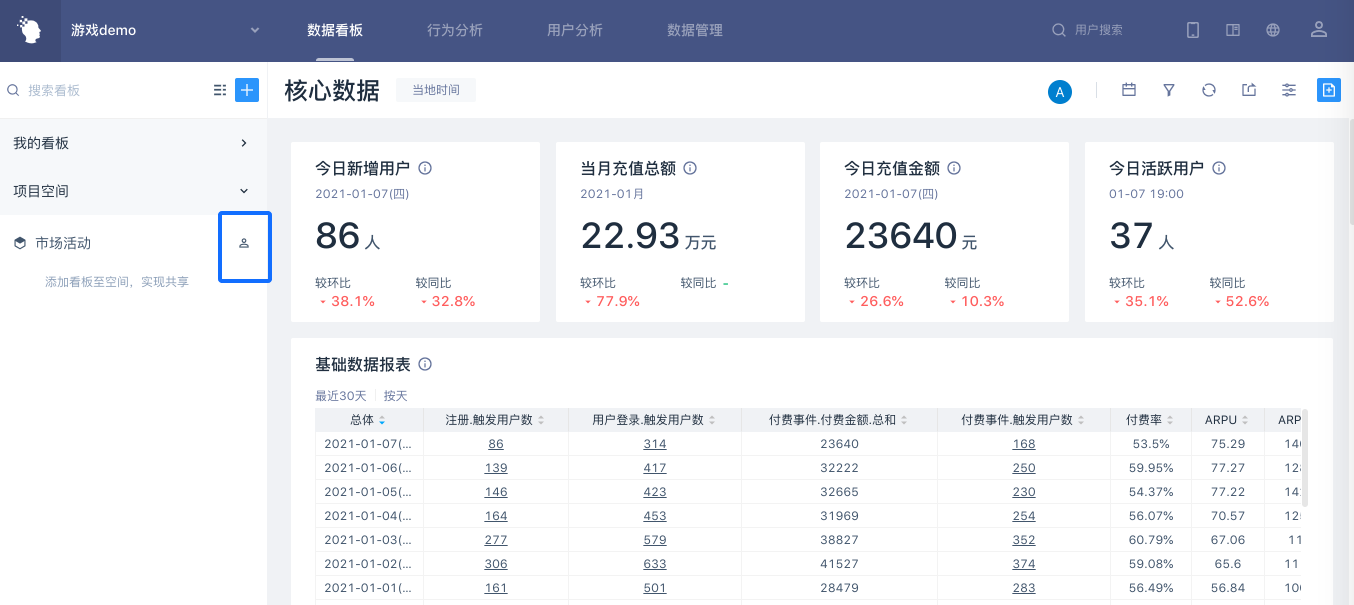
The space administrator can edit the space settings, including modifying the space member list, handing over the space, and deleting the space.
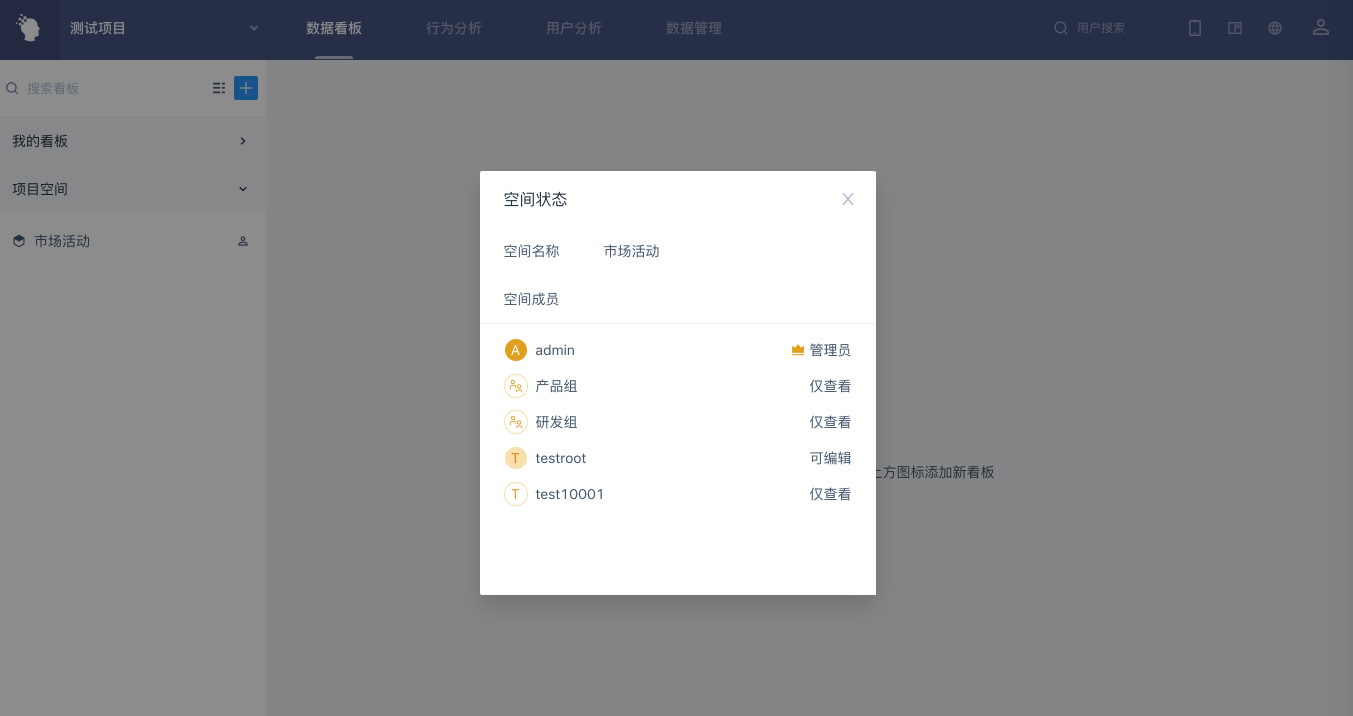
Space members can view the list of space members.
# 4.2.3 Transfer or delete the space
The space administrator can transfer or delete the space. Open the space setting box and click [More Operations] in the lower left corner of the pop-up box to choose to transfer or delete the space.
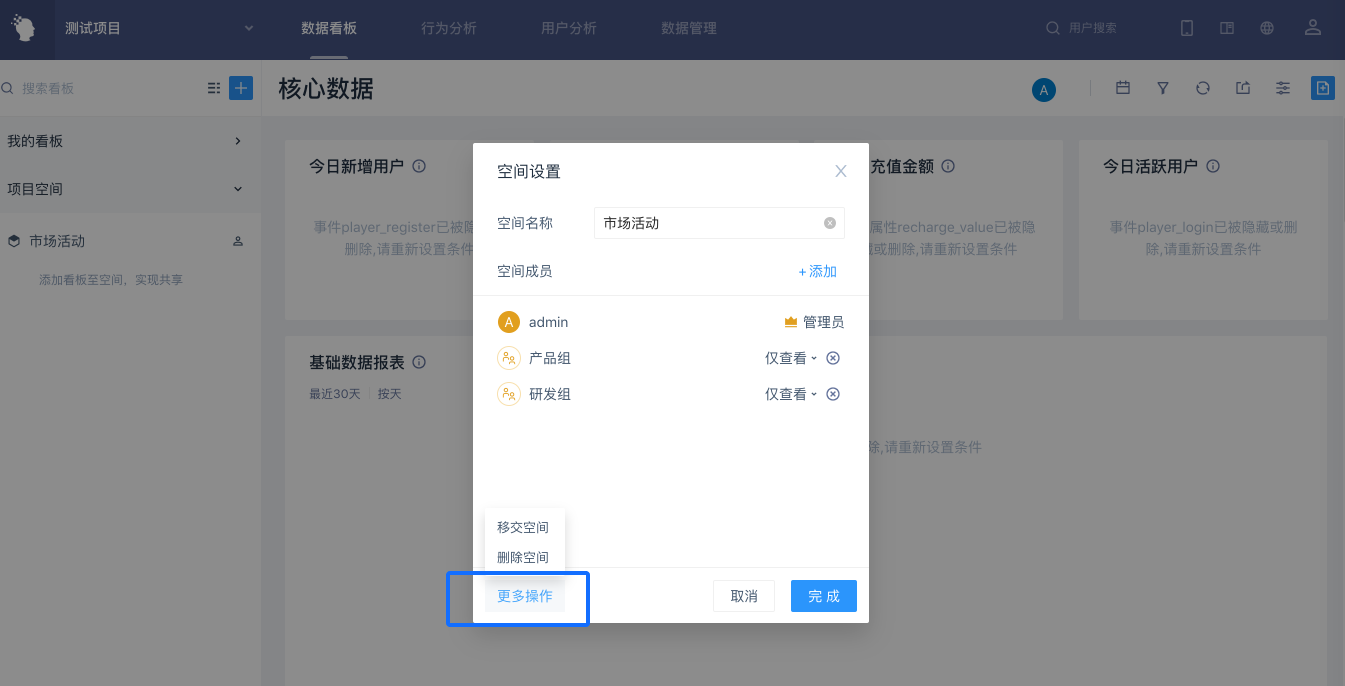
- Handover Space: Select the project member as the new administrator. After the handover, the original administrator will become a space member. The transfer user must be analyst and above roles
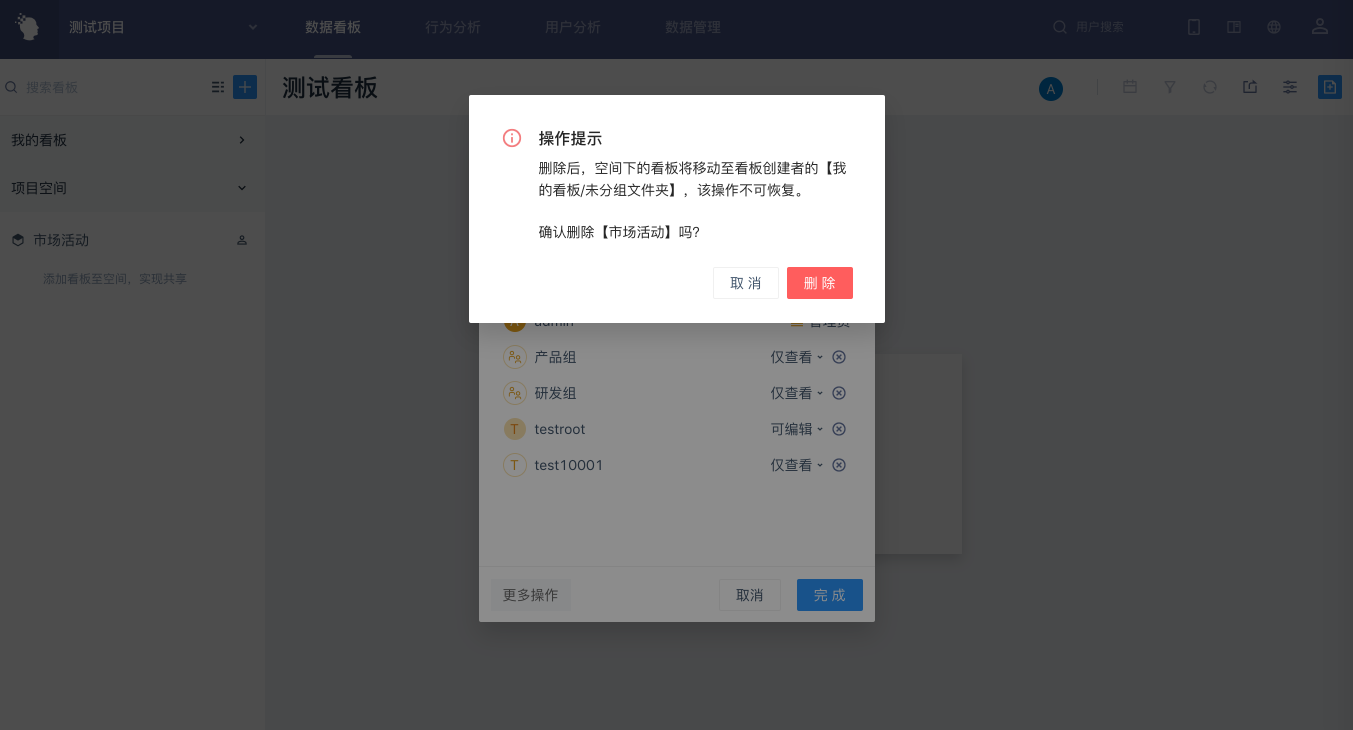
- Delete space: Deleted spaces do not delete dashboards directly. After deletion, dashboards under the space will move to the folder of 「My dashboard」→「Ungrouped folder」.
# 4.3 Create a New Space Dashboard or Folder
It supports sharing dashboards in space in two ways:
# 4.3.1 Create a new dashboard or folder directly to the space
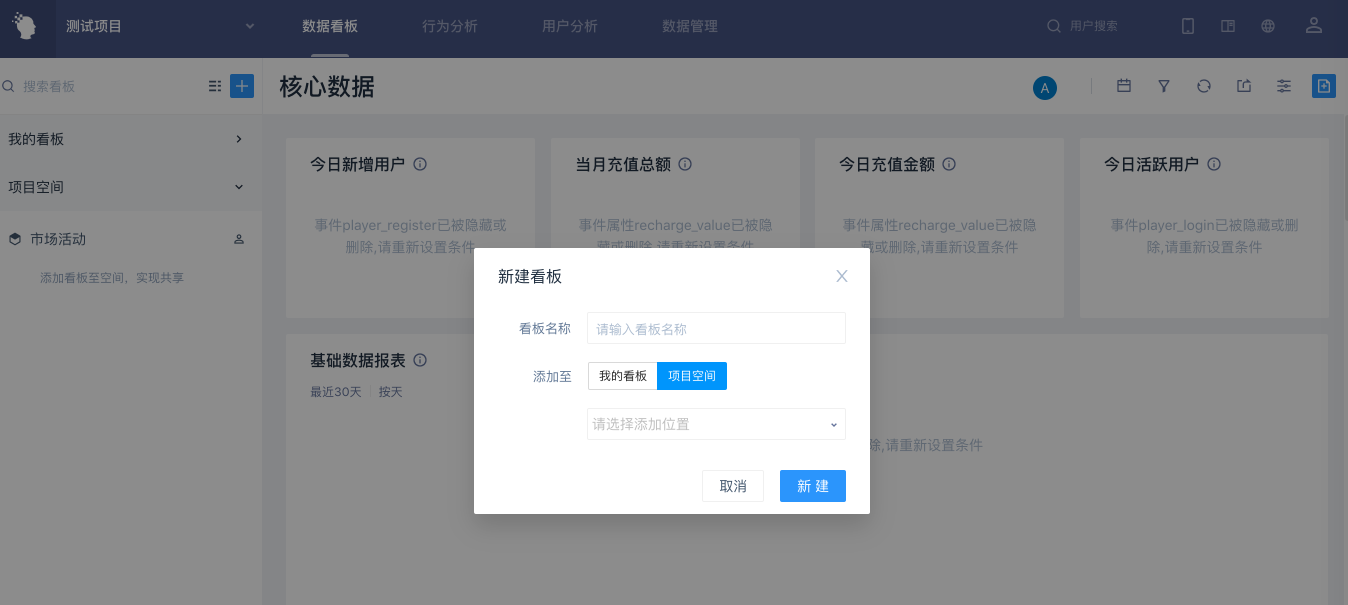
Click [+] in the upper right corner of the left column of dashboard, and select "New dashboard" or "New Folder" to directly save dashboard or Folder to a space with editing permission.
# 4.3.2 Move self-built dashboard to space
Move the mouse into the self-built dashboard under "My dashboard", click [...] and select "Move to" to move the dashboard to a space with editing permission.
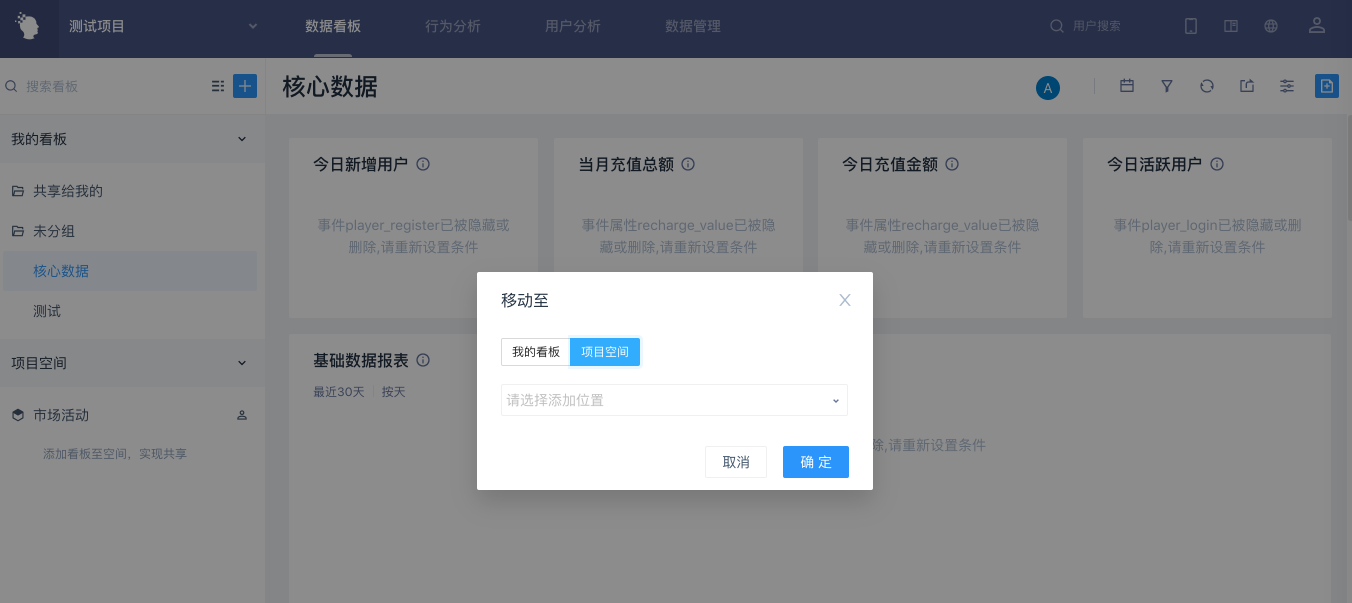
Note: Moving dashboard does not change the sharing settings of dashboard (which means the sharing status in the [Dashboard Sharing Settings] in the upper right corner does not change with the action)
# 4.4 Specify Sharing for Space Dashboard Settings
The dashboard in space can be viewed by default for space members. During the use, if you want to add dashboard collaborators to the dashboard in space or share them with other members outside the space, you can click the [Share] button in the upper right corner to specify the sharing settings of the dashboard.
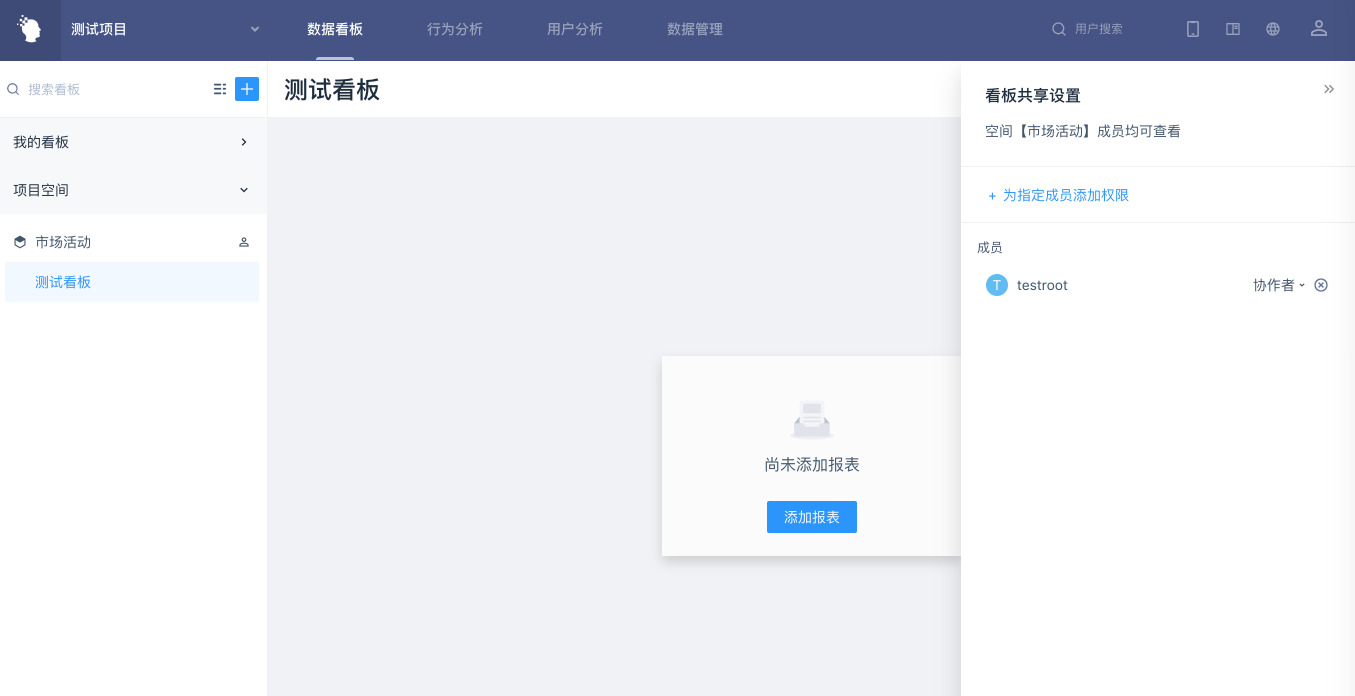
If you share a dashboard with another member outside the space, the dashboard will be displayed under the 'My dashboard' → 'Share to Me' folder of that member.
# 5.Dashboard Management
# 5.1 Batch move or delete self-built dashboard
Click Dashboard Management in the upper right corner of the dashboard page to open the dashboard Management pop-up window. This function allows you to move or delete your own dashboard in batches.
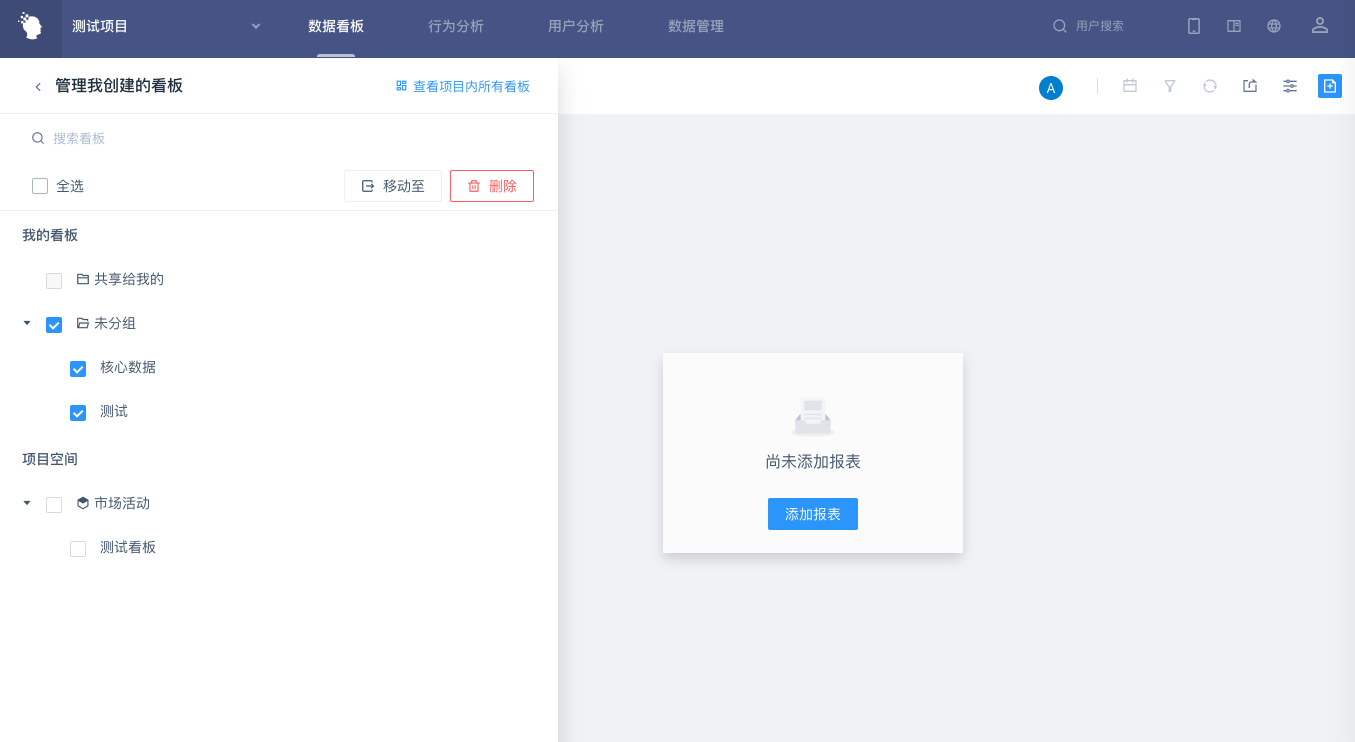
- Only support batch management of self-built dashboards.
- You can move your own dashboard to "My dashboard" (except "Shared to Me" folders) or to the space with permissions.
# 5.2 TA Supervisors View all dashboards in the project
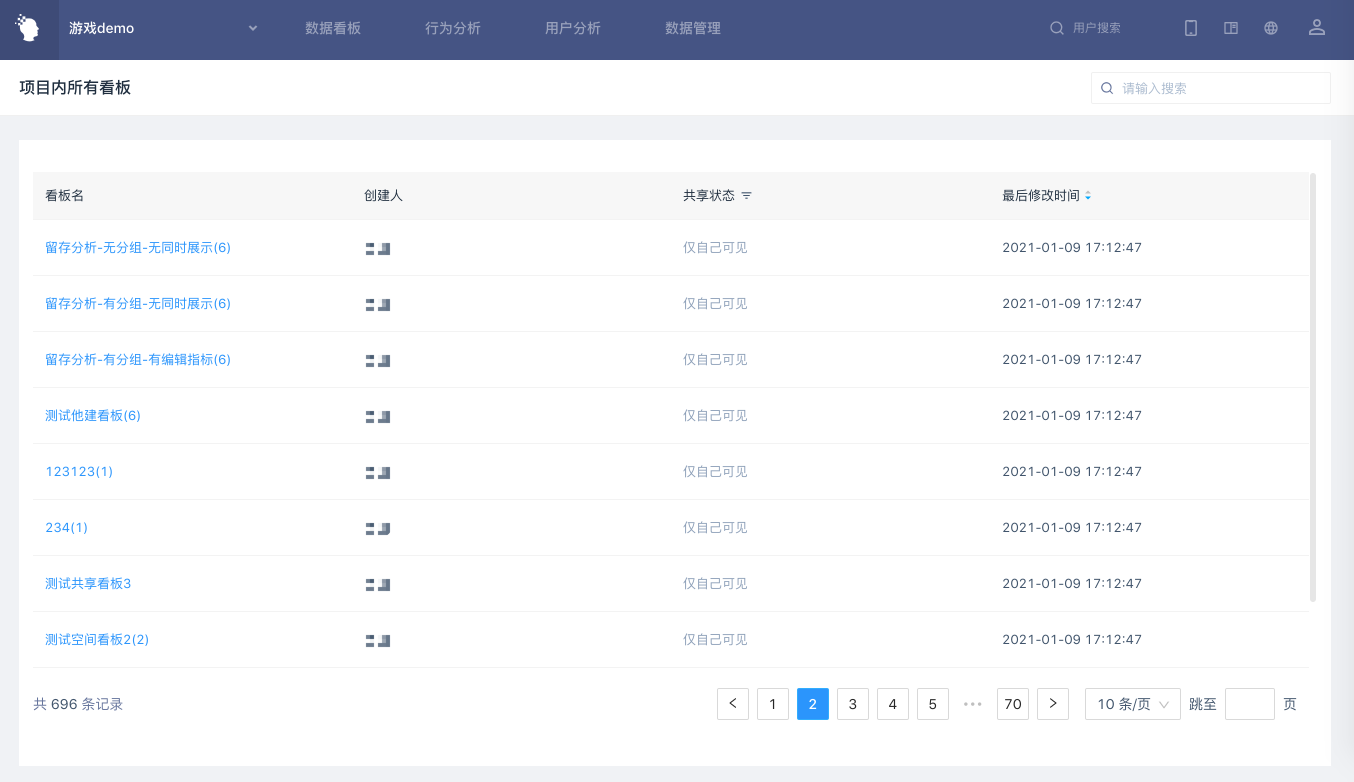
TA Supervisors can access to view all dashboard in the project through this module. Dashboard information includes the name of dashboard, the creator of dashboard, the sharing status of dashboard and the last modification time. Click on the name of dashboard to view the details.
# 6.Dashboard reports
# 6.1 Composition of Dashbaord reports
The dashboard core area is composed of multiple dashboard reports (reports or labels), reports are not represented in exactly the same way as models on dashboard.
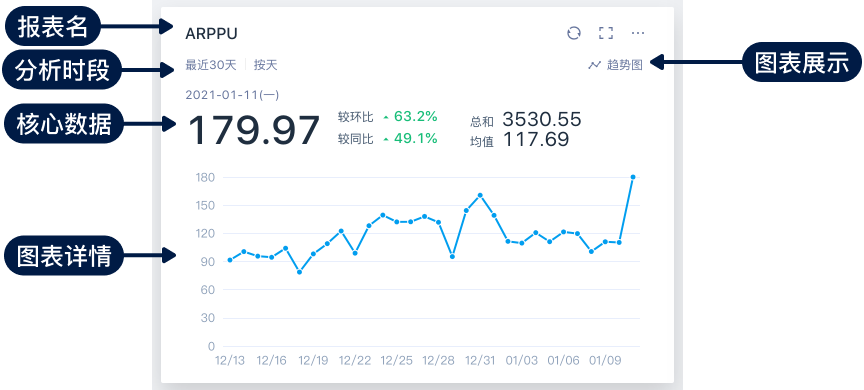
Any chart consists of a configuration area and chart content. Depending on the type of chart (from different sources), the options supported by the configuration area also differ.
# 6.2 Operation permissions of different roles on dashboard reports
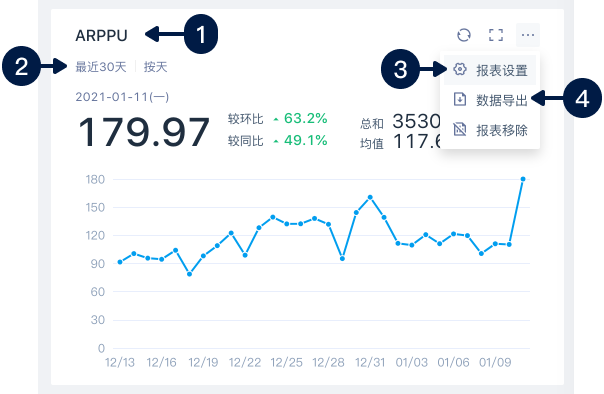
| Creator | Collaborator | Analyst and above users | Ordinary members | |
|---|---|---|---|---|
| 1 Click the chart name to enter the chart page | You can click to enter the report page to update the report | You can click to enter the report page and save the report as well | You can click to enter the report page and save the report as well | Not clickable |
| 2 Temporary adjustment of analysis period and chart display | Settable | Settable | Settable | Settable |
| 3 Modify chart settings | Settable | Settable | Not set | Not set |
| 4 Data Export | Exportable | Exportable | Exportable | Exportable |
- If the collaborator role is [ordinary member], because ordinary members do not have the permission to use the model, they cannot click the report name to enter the report page and modify the chart display settings.
# 6.3 Exploration module of the chart
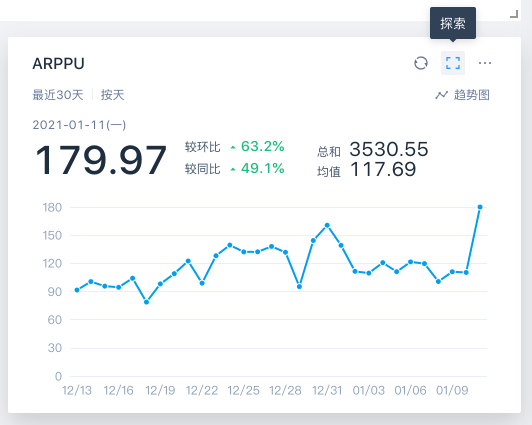
Click the Exploration Module button in the upper right corner of the report to further exploration. Please refer to the Exploration Module section for the use of the exploration module;
Note: The tag on the dashboard does not support entering the exploration module.
# 7.Dashboard Import and Export
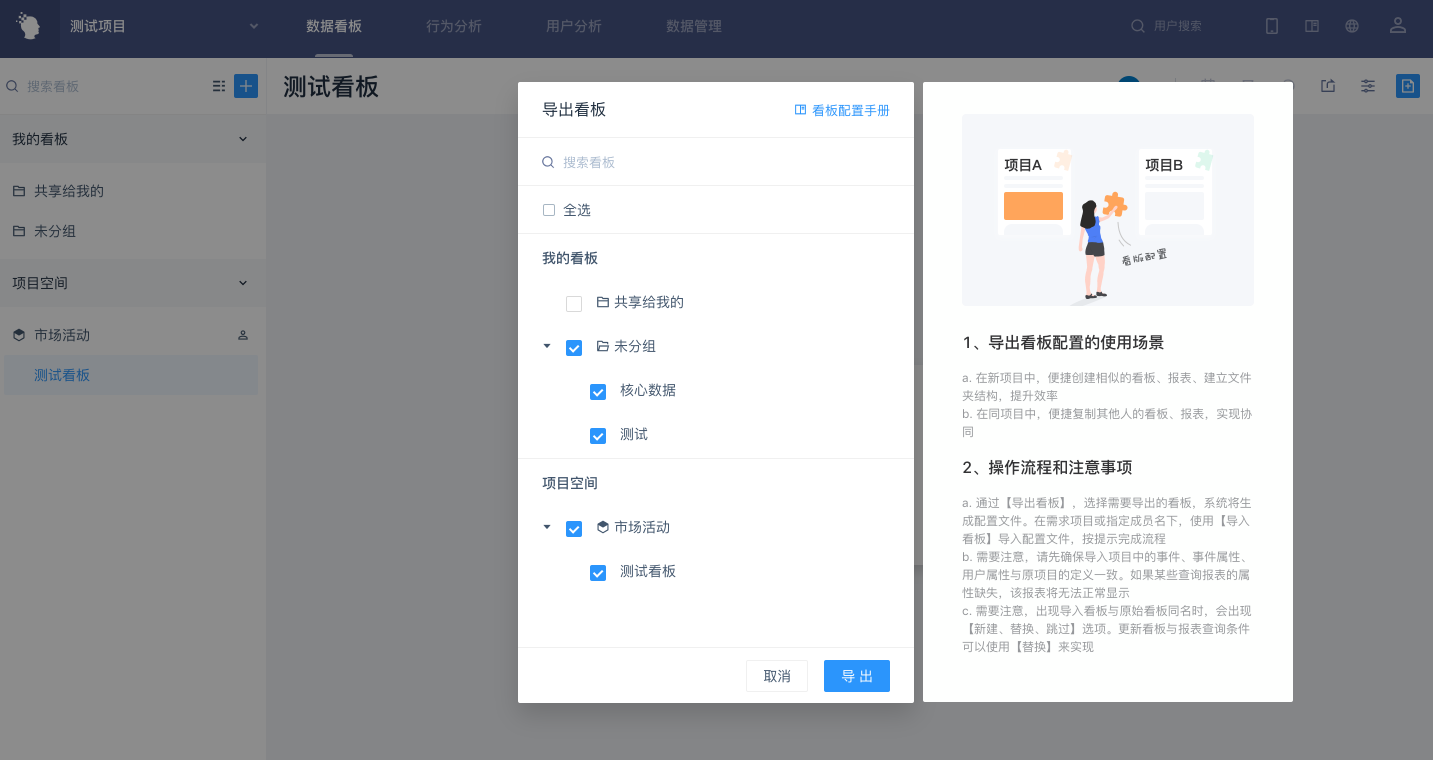
TA supports exporting the dashboard, dashboard reports and space configuration information into JSON files, and supports importing in any project to enable the rapid migration of space, dashboards and reports.
Note: This function generates a new dashboard according to the imported dashboard parameter configuration. Dashboard can only be used normally when the events (attributes) of the imported project match the events (attributes) of the exported project.
# 7.1 Dashbaord import and export operation process
For items that need to export dashboard, click [+] in the upper right corner of the left column of dashboard, select "Export dashboard", select dashboard to export in the list column, and click [Export] to generate dashboard configuration file.
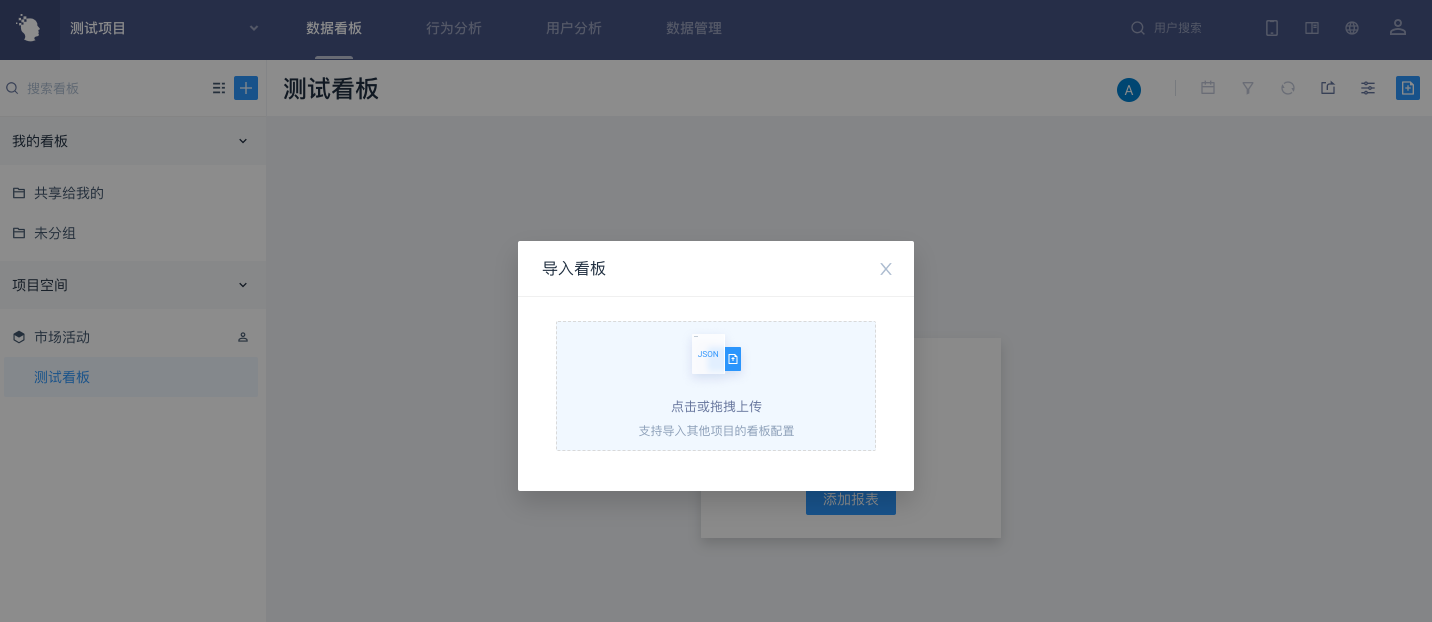
Enter the project that needs to import dashboard, click [+] in the upper right corner of the left column of dashboard, select "Import dashboard", and upload the configuration file generated in the previous step in the floating window.
After successful import, you can view the dashboard content within the project.
# 7.2 Dashbaord Import and Export Rules
Dashboard configuration file includes space, dashboard, dashboard folder, dashboard chart information.
The creator of the imported dashboard is the imported operator; if the imported dashboard generates space, the creator of the space is also the import operator.
The share status of the imported dashboard defaults to "visible only by myself"
" The import rules on dashboard are:
- In original project, "ungrouped" and 'shared to me' folders will import to the "Ungrouped" folder of the new project.
- Merge dashboards with the same name in original and current projects.
- Dashboards in other folders will import the new folder.
- " The dashboard import rules in Project Space are:
- If the operator does not have permission to create a new space, a folder named "Space + Space Name" will be created under "My Dashboard" and the dashboard under this space will be imported.
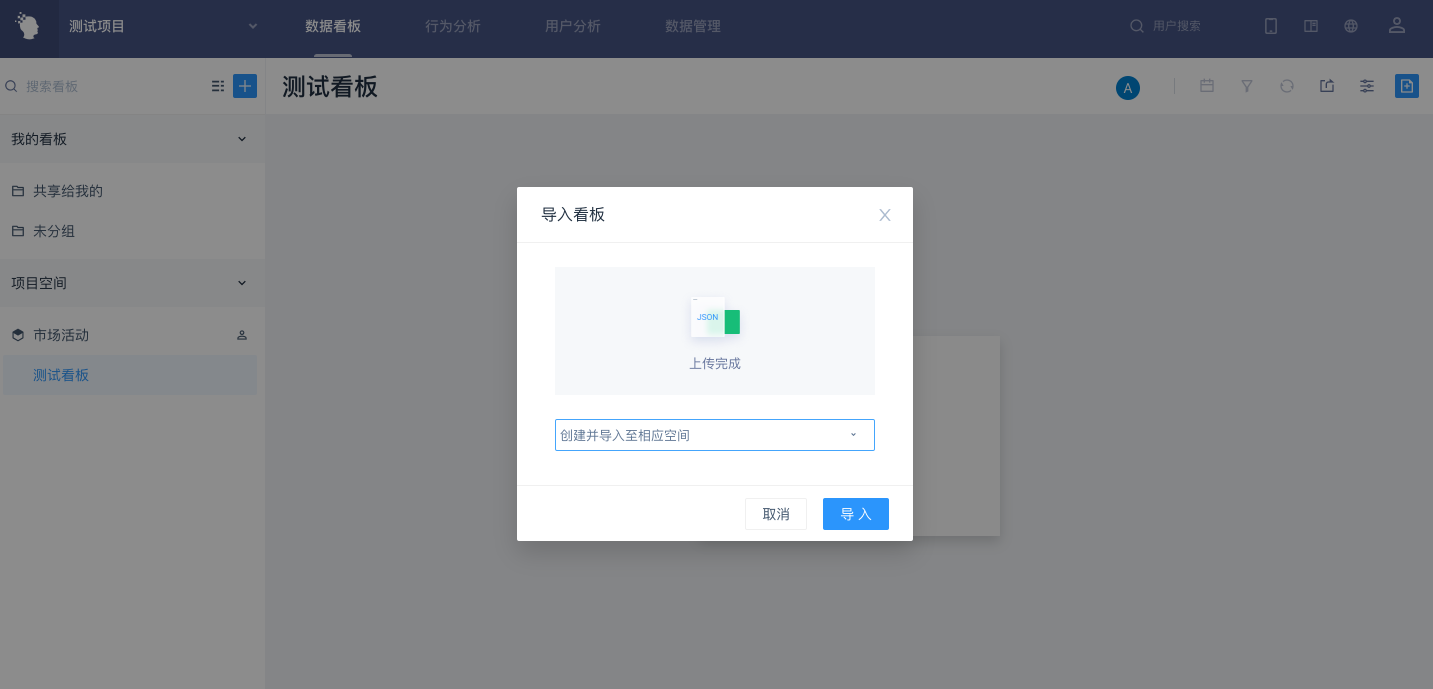
- If the operator has the permission to create a new space, you can choose Import All to My Dashboard or Create and Import to the corresponding space when importing. If you select [Import All to My Kanban], follow the above rules; if you select [Create and Import to the corresponding space], you will create a new space without space members, and import the dashboards in space to the new space.
# 8.Best Practices
# 8.1 Data sharing through dashboard and space
Through dashboard and space, it is very convenient to share the reports you create with other users.
Dashboard is the basic unit of data sharing. The report data sharing is available by putting the report to be shared on dashboard, sharing dashboard or sharing in the space shared with others. At the same time, dashboard also supports adding collaborators, who can put their own reports into dashboard to implement multiple people to maintain dashboard reports together.
Space is an area where many people cooperate. The creator and administrator of the space can add their own dashboard to the space. All members in the space view the same space content, including the location of the dashboard, the location of the dashboard folder, and the structure of the dashboard folders. Since the content of the space is stable for all members, it is appropriate to be the standard data area for the team to store data of common concern to the entire team.
# 8.2 Use dashboard filtering for population-specific analysis
Dashboard filtering can screen all reports and is suitable for analysis of specific groups. Before analysis, you can put multiple reports in the dashboard to analyze different user segments, such as activity reports, payment reports and participation reports of core product behaviors. After that, these reports in the dashboard can then be filtered by filtering user groups or user tags, which is equivalent to viewing the report data of the people selected by the filter rules, in order to quickly analyze the various analysis of a specific population.
# 8.3 By providing ancillary information and segmenting areas
The core dashboard often contains a large number of reports or labels, which can be divided based on the outcome measure into those that are newly relevant, retained active relevant, paid relevant. Dashboard can be divided into several areas through notes, and comment information can be written for each area, which is convenient for new participants to quickly understand the business meaning of the dashboard when it is shared.
