# Product Metrics
Metrics are the key to data analysis. You can create project-specific metrics such as the number of active users or the payment amount for different projects, which can also be directly used by other project members in analysis. In the meantime, if the statistical caliber of a metric is adjusted, you can also make timely modifications to prevent wrong data from affecting business decision making.
# Quickly create metrics in event analysis
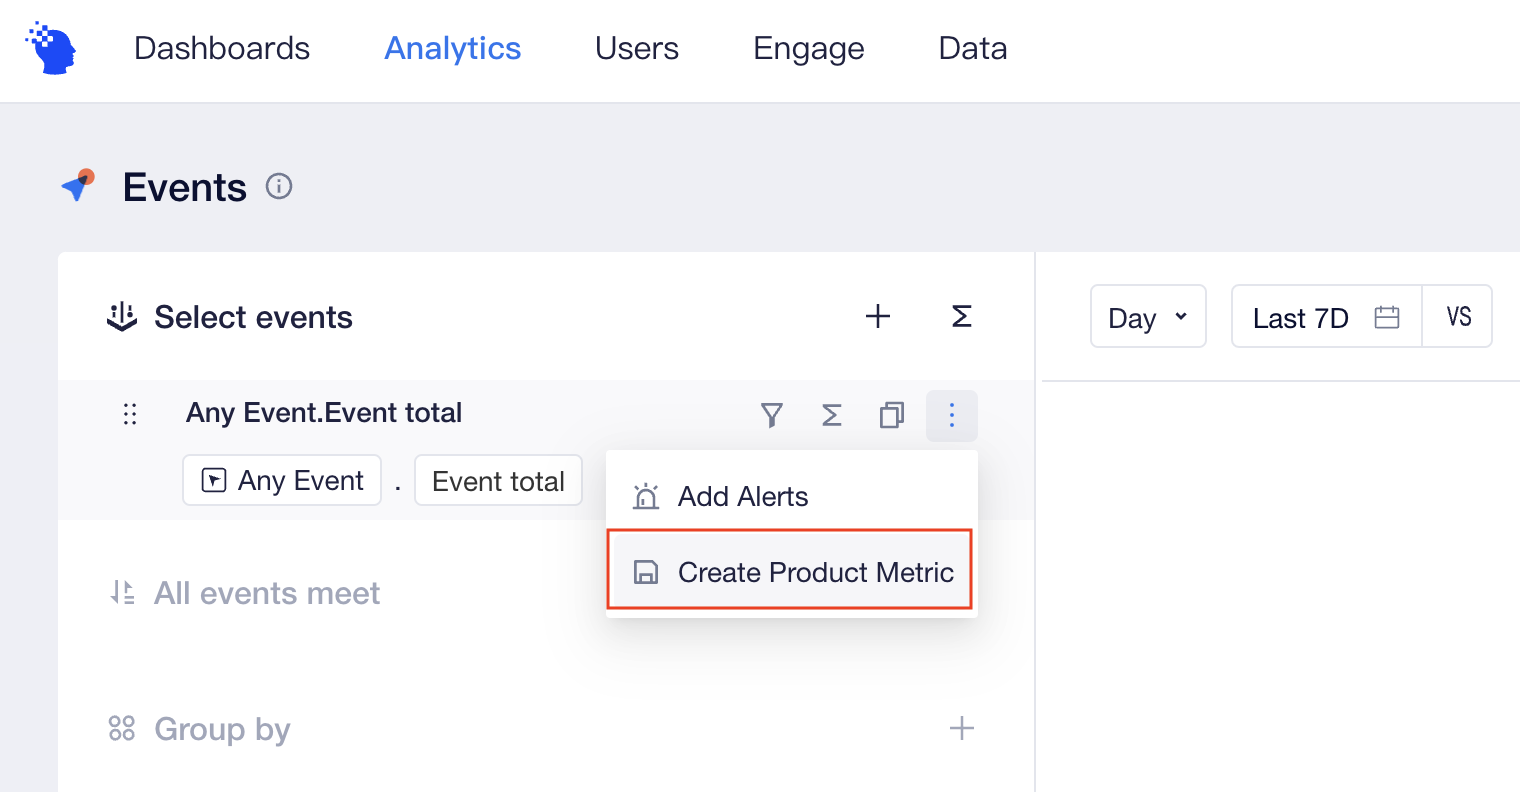
In Events, you can save metrics that meet business needs and are validated by data through "Create Product Metric" and reuse them in other scenarios. The events, computational methods and filter conditions (excluding "All events meet") used in metric configuration for a model will be automatically brought into the statistical caliber of metrics.
Click "Save" after filling out basic information of metrics and you will be able to complete metric creation. Specifically, metric name as the sole identifier can not be changed after creation.
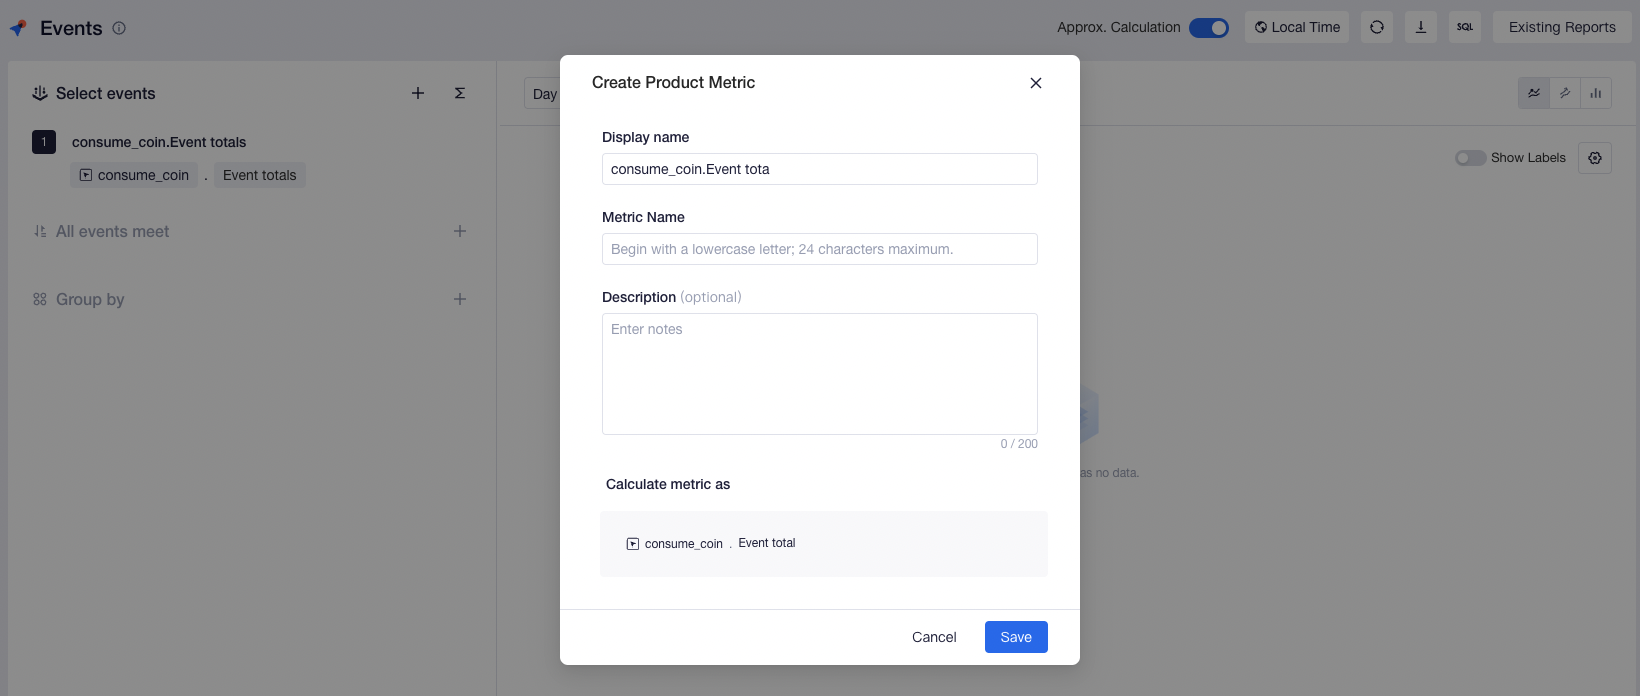
It should be noted that if the current logic of metric configuration uses metrics that have already been created or contains event splitting, then the metric can not be created.
# Quickly create metrics in retention analysis
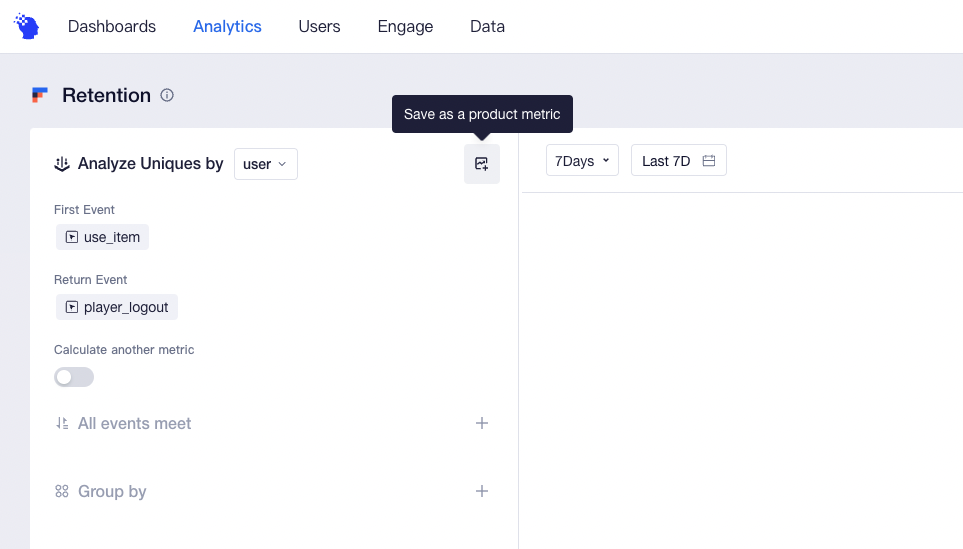
Similar to event analysis, you can also save the retention rate and churn rate for a specific date in the "Save as a product metric" section of retention analysis, and the corresponding analysis entities, initial and return visit events, and filtering criteria (including "All events meet") will be automatically brought into the statistical caliber of metrics.
Tips
Take daily retention data for example. If you select 【Analyzing retention of the N-th day】 in the retention analysis model, the table will display results of the entire analytical period from the display date, the 1st day...to the N-th day. In the retention metric, you should specifically select 【data performance of the N-th day】 corresponding to the metric, that is, a certain column of data in the retention table.
# Use metrics to perform analysis
In event analysis, you can directly select metrics that have been created instead of re-selecting events, computational methods or filter conditions. You can also apply metrics to equations and combine them with other metrics or constants.
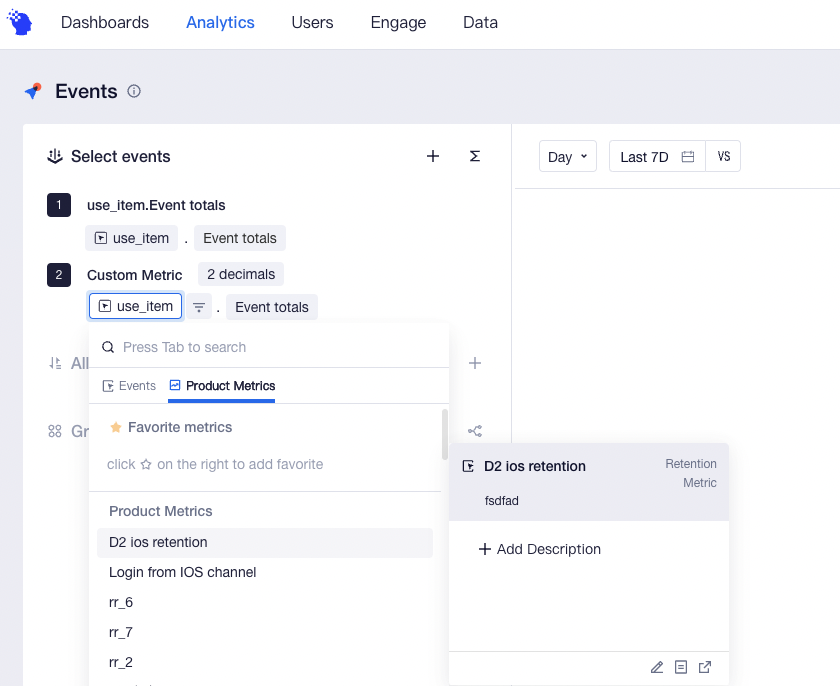
For example, if you want to display not only the number of new users, the number of active users and total payment amount, but also metrics created through retention analysis such as the 2nd-, 3rd- and 7th-day retention. In this case, you can create these key KPI metrics first and then quote them in event analysis and save them as reports.
Notes
Analysis metrics shown together must share the same granularity of time. For example, the second day retention rate only supports "daily" presentation, while the next week retention only supports "weekly" presentation, and thus can not be put together in a report. When the analysis metric Extended Date Rangeis selected, the granularity of time only supports "daily" and the metric can not be displayed along with weekly/monthly retention metrics either.
# Manage all metrics in a project
You can click [Data > Product Metrics] to view metrics that have been created for the current project. If there are too many metrics, you can also filter metrics by creation modes or use the search box to perform fuzzy matching.
You can also directly create metrics through event analysis or retention analysis, and customize and adjust display formats and computational methods.
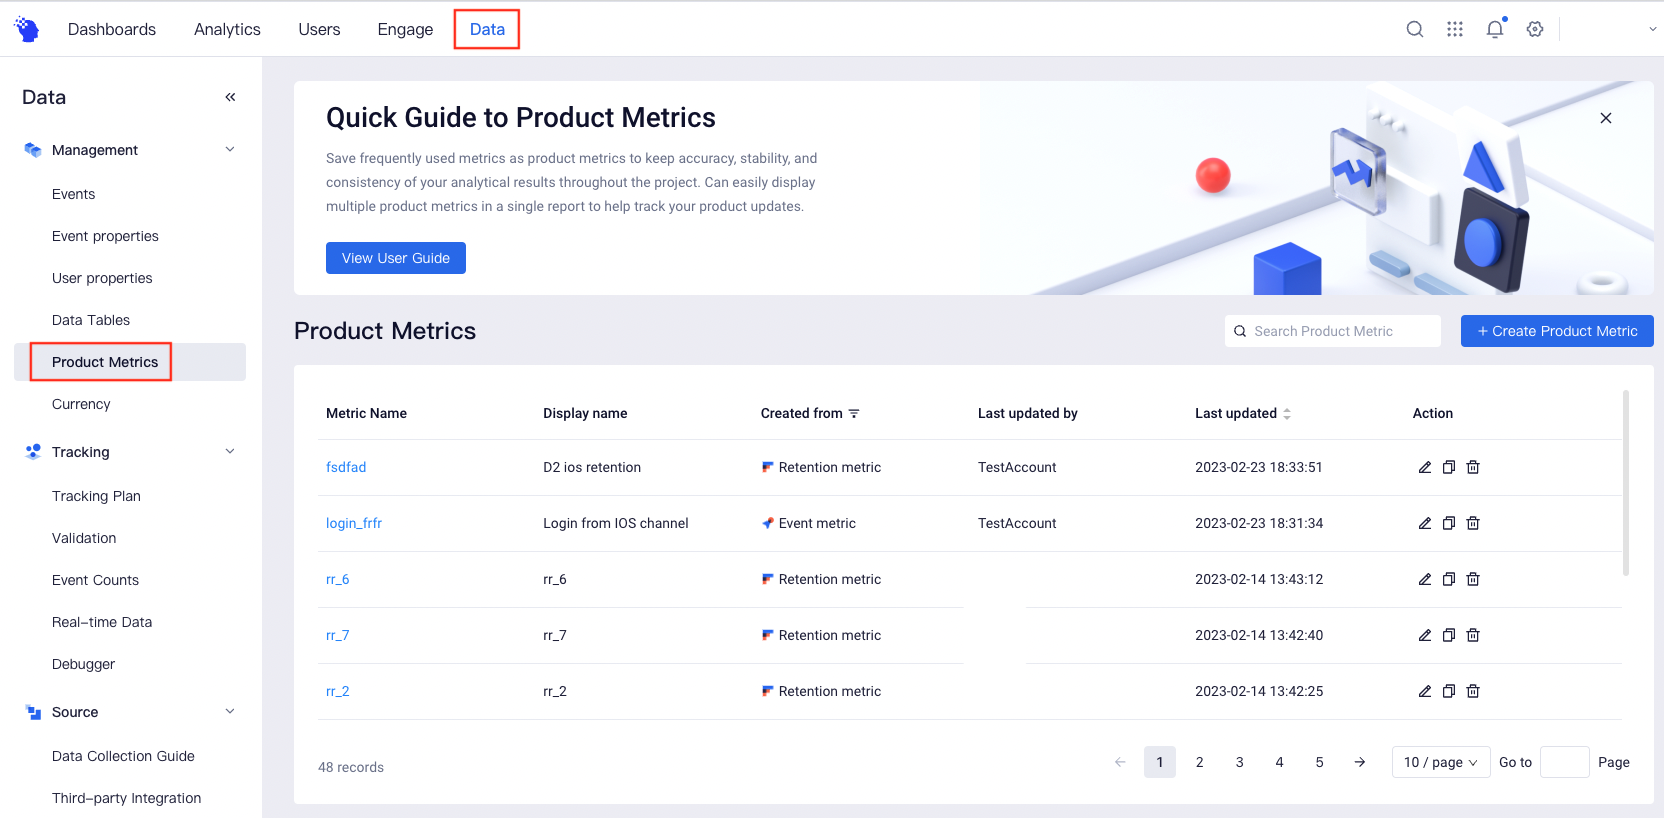
For metrics created, you can edit statistical caliber of metrics, but metric name and creation mode can not be changed. You can delete a metric that you no longer want to follow. After that, all reports that have used the metric will be unusable.
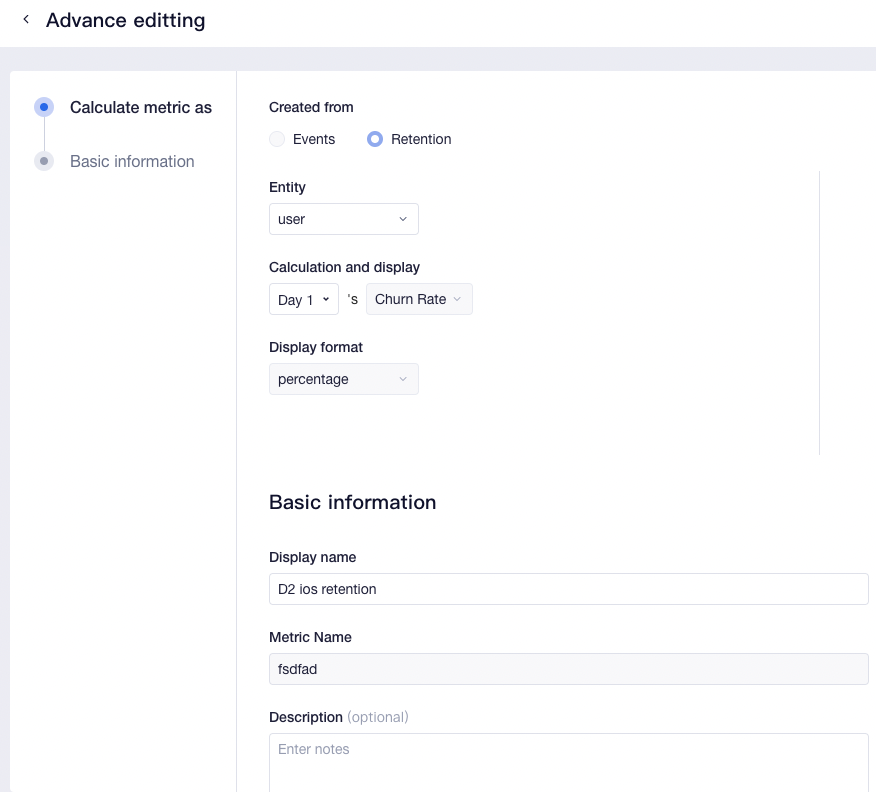
For example, when you find data exceptions in an analysis based on the DAU metric and identify that the reported data of some channel packages is problematic, then you must rule out these data from metrics. You can access the "Advance editting" page to add and save filter conditions. After that, all reports that have used the metric will be re-computed using the newest statistical caliber of metrics, saving the need for re-modification.
# Usage permissions
| Category | Company root | Administrator | Analyst | Member |
|---|---|---|---|---|
| View the metrics management menu | ● | ● | ▲ | ○ |
| Create, edit, and delete self-built metrics | ● | ● | ▲ | ○ |
| Edit and delete metrics created by others | ● | ▲ | ○ | ○ |
Description of permissions:
● Compulsory availability for roles
▲ Availability by default for roles, but unavailability is allowed
△ Unavailability for roles by default, but availability is allowed
○ Compulsory unavailability for roles
