# Flows
As an exploratory analysis, Flows analysis intuitively displays behavioral sequence and key nodes of users in the form of Sankey diagram. Through Flows Analysis, you can view the inflow and outflow of behaviors before and after each key node and quickly understand the primary and secondary factors influencing conversion, thereby improving products.
In Flows analysis, you will be able to find answers to the following questions:
- What are the optimal flows for users to use the product from page browsing to purchase?
- What is the first vital event participated by users after registration?
- What is the last vital event participated by users before churn?
# Definition of flows and configuration of analytical conditions
Sessions are the basis of Flows analysis. Before exploring user flows, you need first understand the definition of a session.
First, select events to be analyzed. You can select a maximum of 30 meta events as session nodes. However, adding filter conditions to events is not supported. You can also add Event Breakdown to selected events. Different properties of a split event will be regarded as different nodes.
After configuration, you can select one event as the First Event, that is, the start node of the session. Beginning with the start node, the Flows analysis model will continue to find the next node. If the next node cannot be found within the session interval, then the session will be considered to be ended.
After the break of a session, a new session will be generated starting with the next First Event of a user, and a user may generate multiple sessions within the selected period of time. It should be noted that even if a user re-triggers the First Event in a session, it will only be regarded as a node in the session rather than generating a new session.
You can set session interval ranging from 24h to 1s. Identical sequence can be divided into different sessions due to the settings of session interval. For example, if a user's action sequence is as follows(suppose that A is First Event and A1, A2 and A3 means a user triggers three times):
| Event | Event-time | Time between adjacent nodes (min) |
|---|---|---|
| A1 | 2023-01-01 10:00:00 | |
| B | 2023-01-01 10:05:00 | 5 |
| A2 | 2023-01-01 10:15:00 | 10 |
| C | 2023-01-01 10:30:00 | 15 |
| D | 2023-01-01 10:50:00 | 20 |
| A3 | 2023-01-01 11:20:00 | 30 |
| B | 2023-01-01 11:40:00 | 20 |
Based on the session interval you selected, the following sessions are divided:
| Session interval (min) | Number of sessions | Session detail |
|---|---|---|
| 5 | 3 | A1-B A2 A3 |
| 10 | 2 | A1-B-A2 A3 |
| 20 | 2 | A1-B-A2-C-D A3-B |
| 30 | 1 | A1-B-A2-C-D-A3-B |
You may also set an event as the last event, which is usually used to analyze prior-to-the-churn behaviors of churned users. The session will trace backwards from the last event to find the previous node. Session break happens if the previous node is not found until the session interval expires.
When Custom Event is used in Flows, an event may be found in multiple custom events, and you need to specify "Events priorities" to make sure Flow counts the right events in case of conflicts.
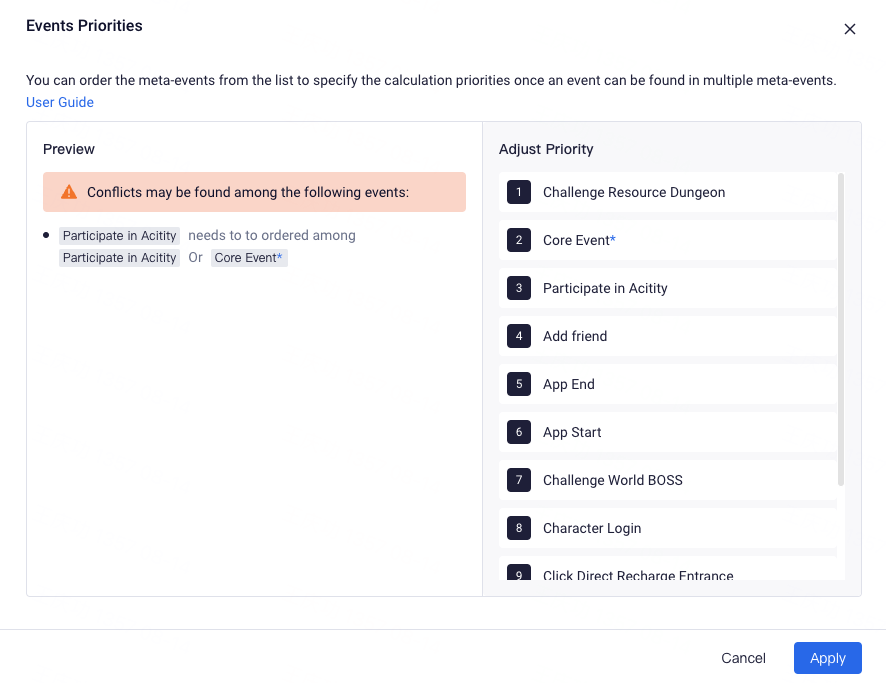
All of the selected events in Analysis condition will appear in the right hand side of the popup. When an event is found with Flows, TE takes any event that contains the event with the highest priority and counts it in the flow.
Like other analysis models, you can also conduct Data Filtering. Flows analysis supports filtering based on user property, tag or cohort.
# View user inflow and outflow with Sankey diagram
A session is made up of multiple steps. After summarizing all users' sessions, you will be able to view the overall data performance. The Sankey diagram will display data performance of a maximum of 10 steps from the first event onwards (or from the last event backwards).
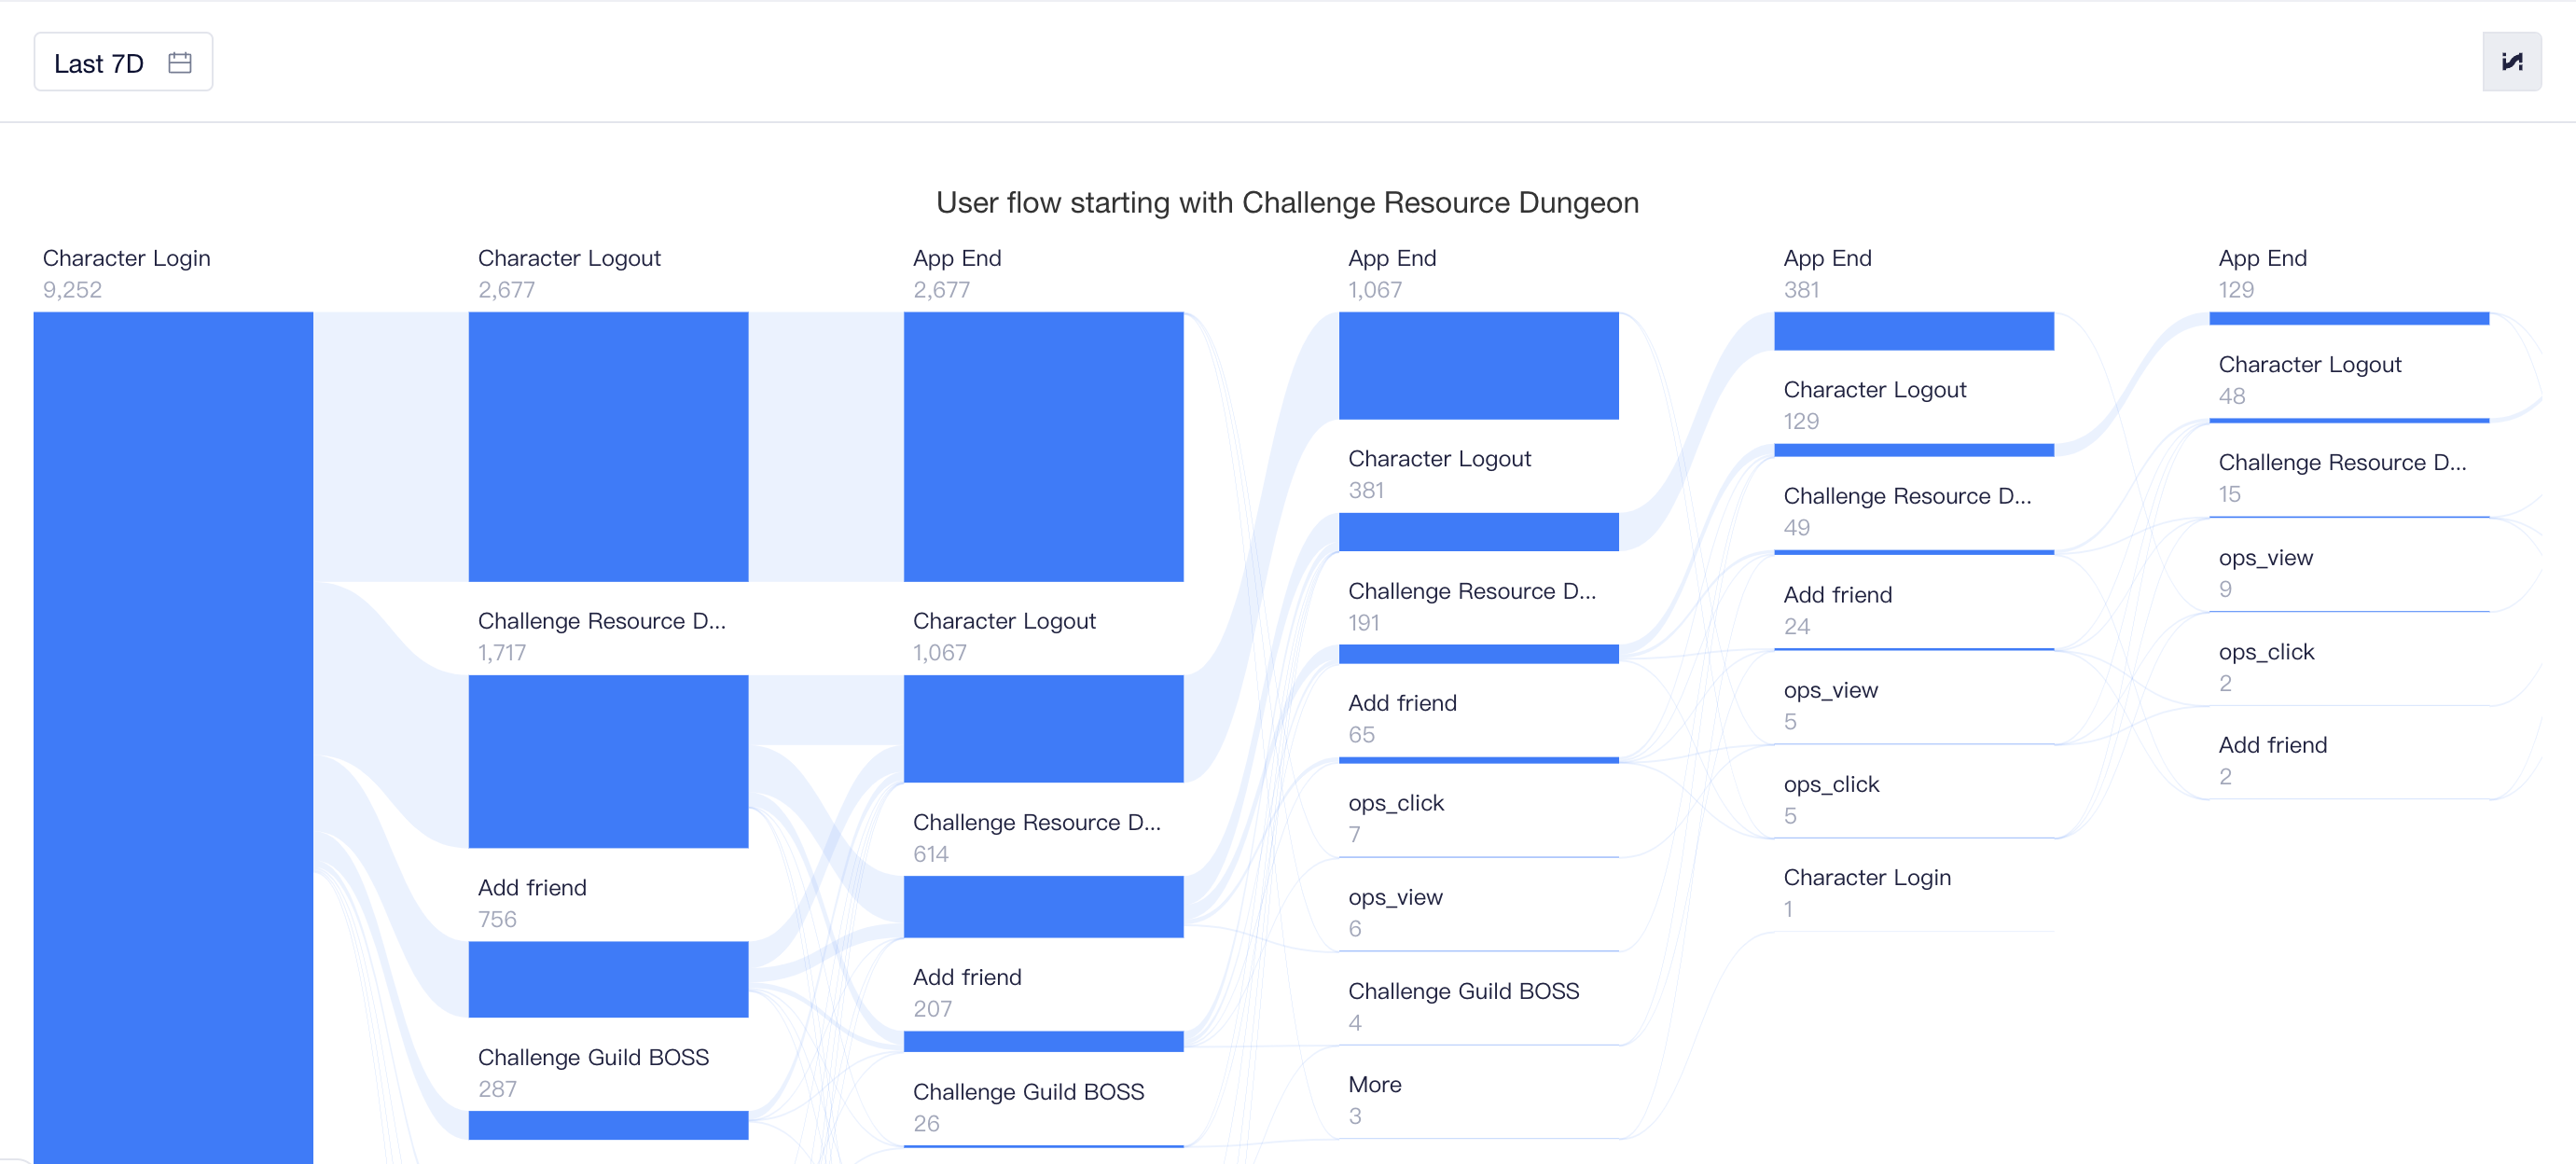
In each step, each rectangle represents a different node, with the height of the rectangle denoting the number of sessions passing through the node. A maximum of 7 nodes will be displayed for a step and data of the rest nodes will be combined into "More".
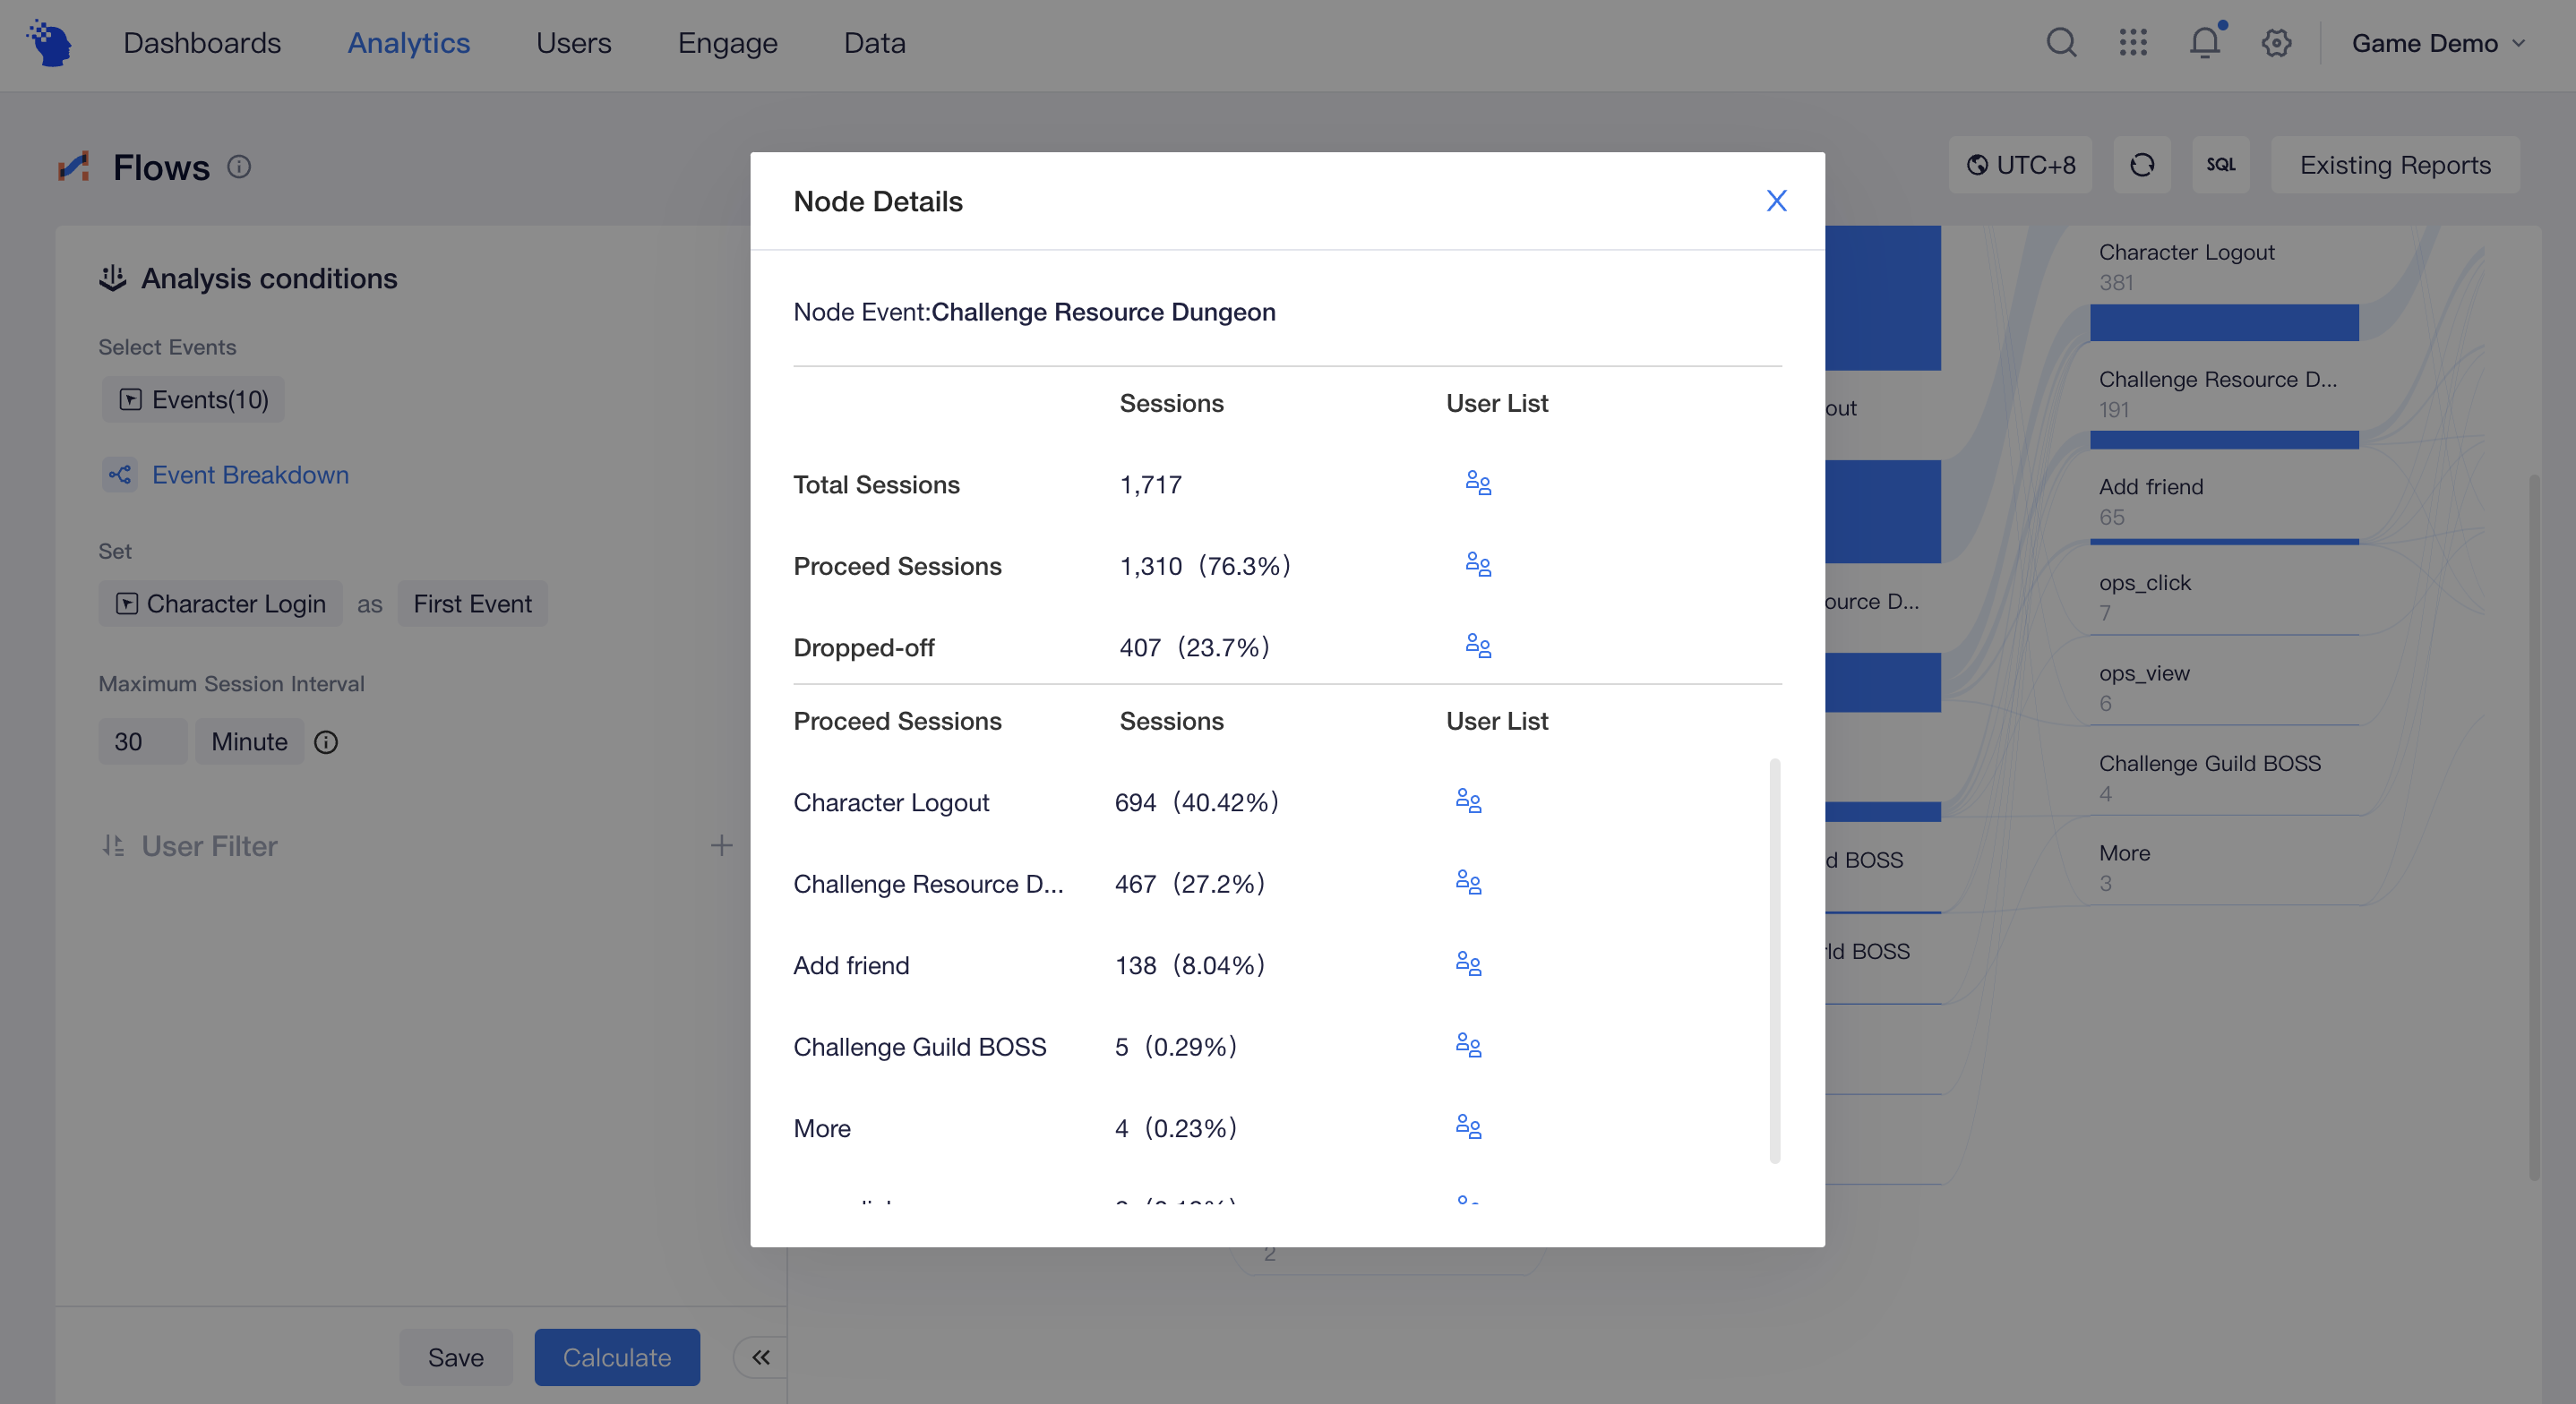
You can click any node in a step to view detailed information. In nodal details, you can view the number of sessions passing through the node at step N and the distribution of subsequent nodes. An absence of subsequent nodes will be considered as a "churn". You may click User Detail to access User List, or save this batch of TE user IDs as result cohort.
The connecting lines between step nodes denotes the proportion of sessions passing through node A that will also pass through node B in the next step. You can click a node to highlight session flows passing through the node and view the flows in a clearer way.
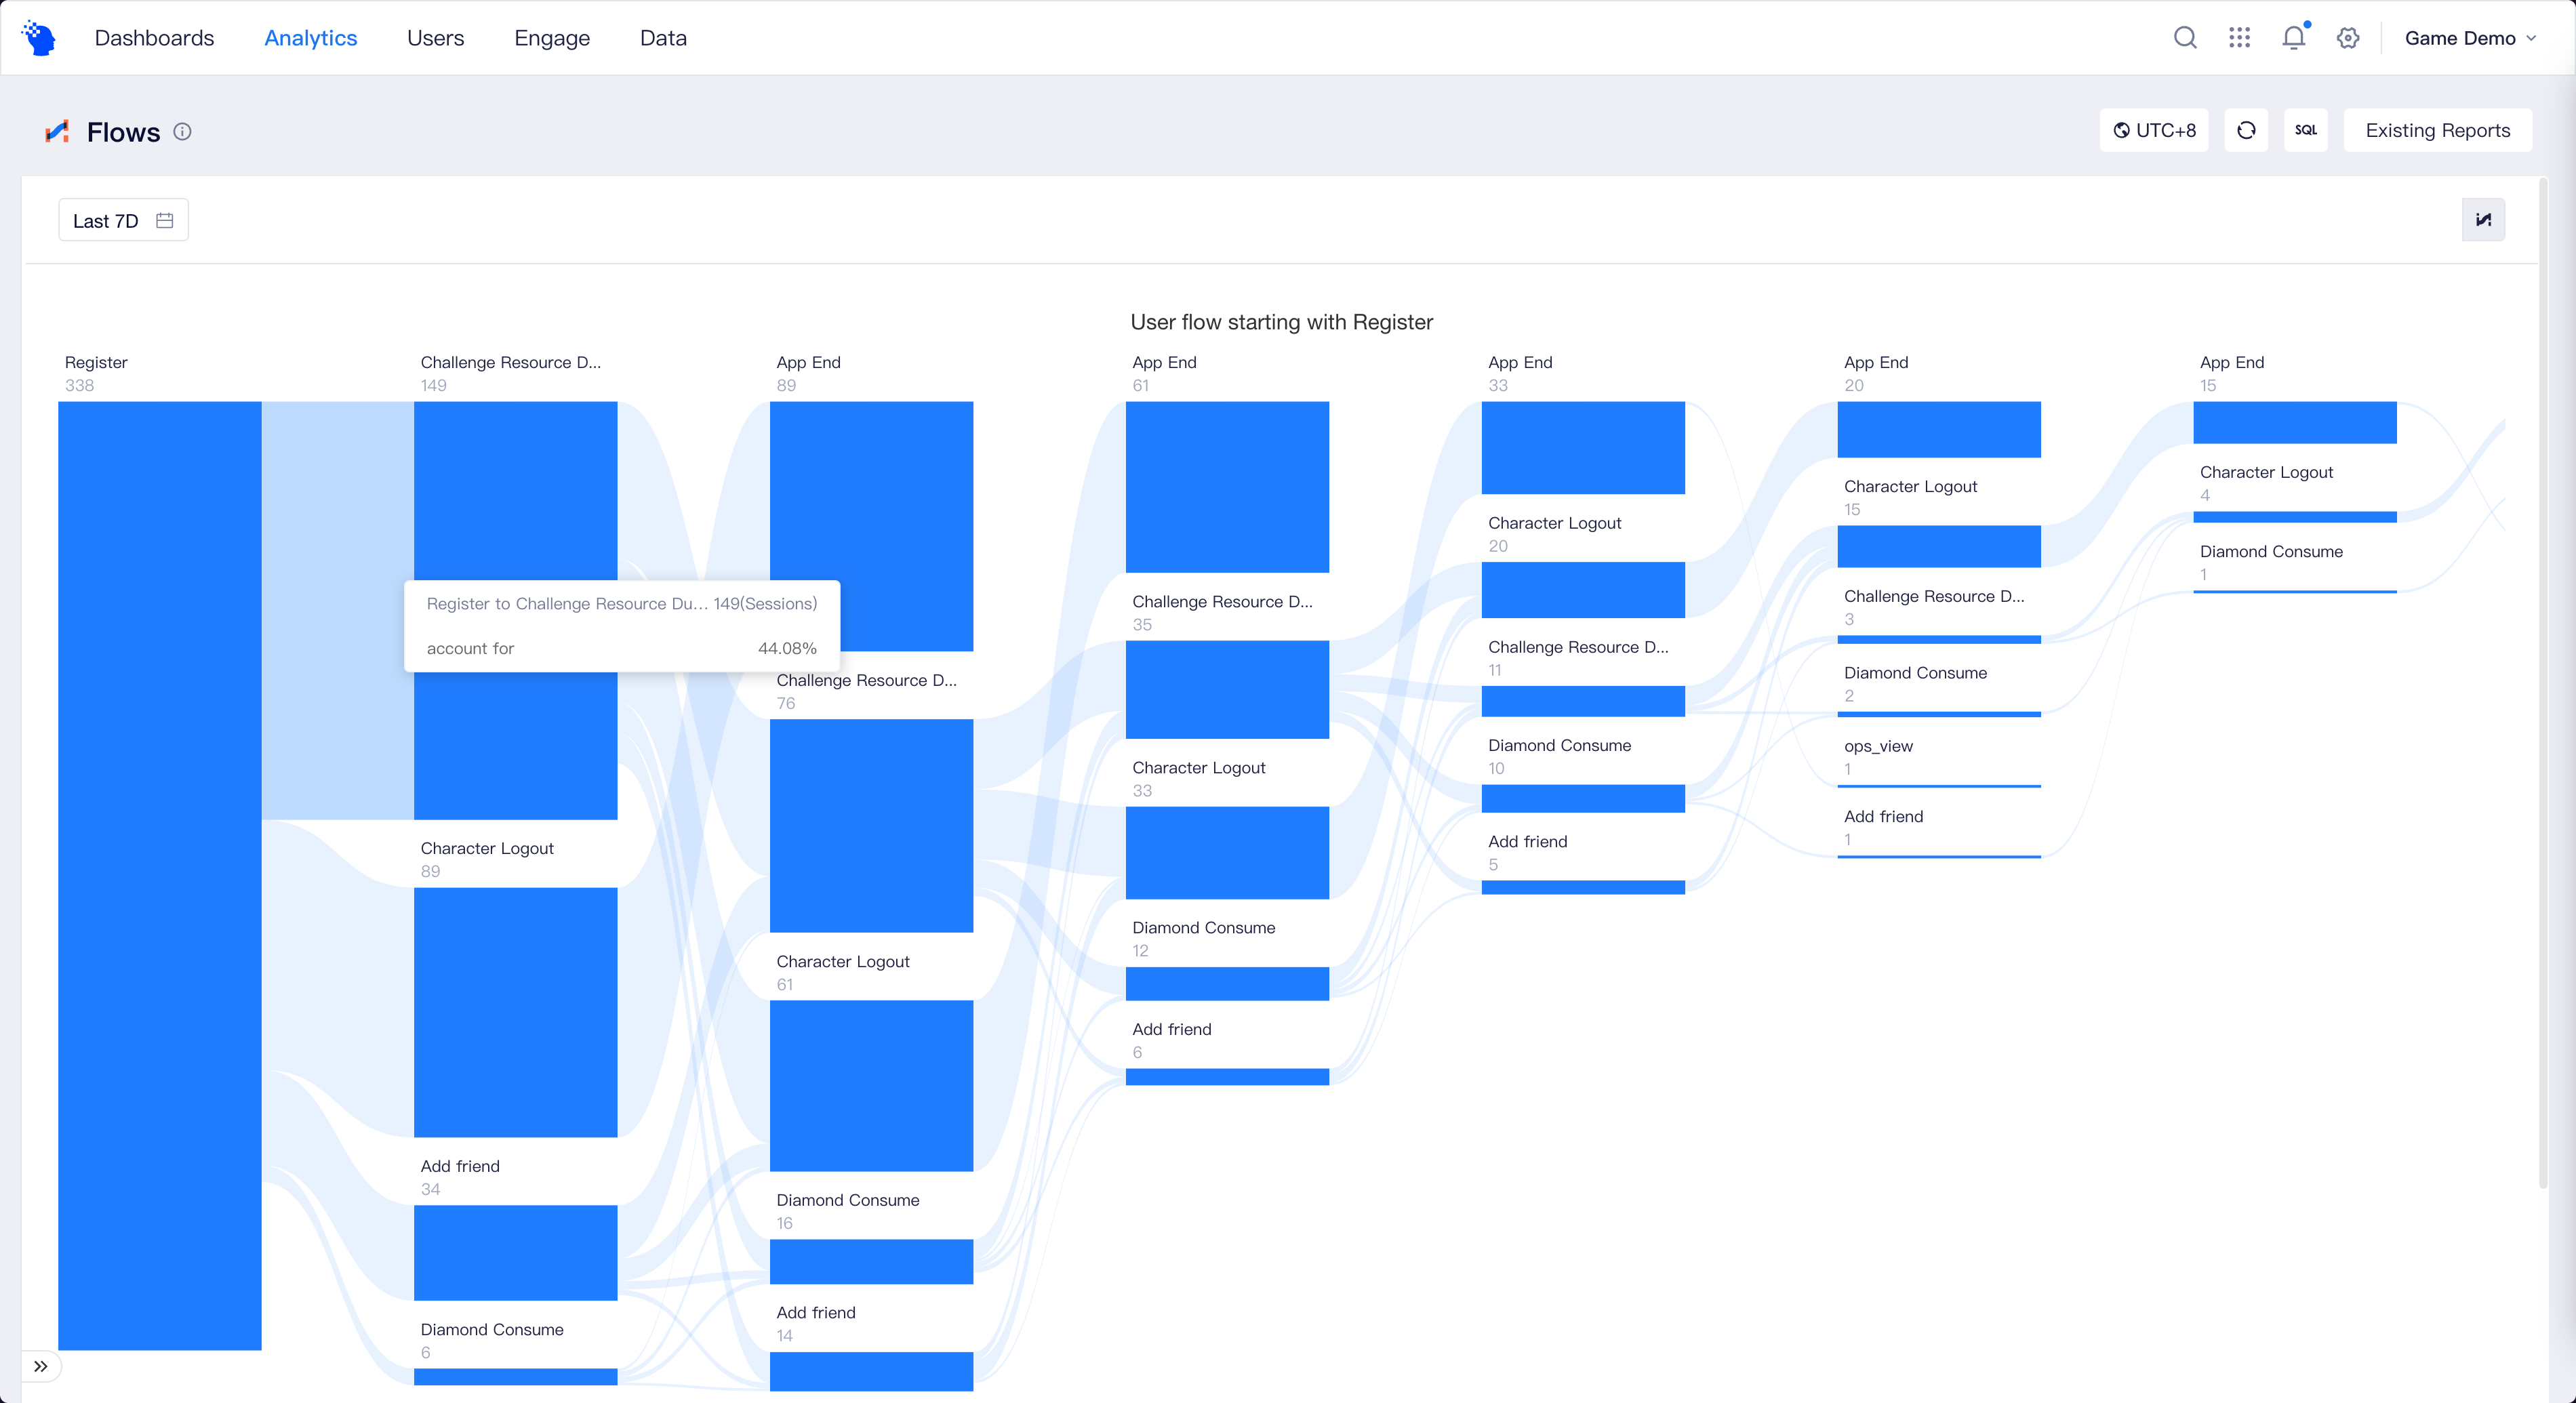
For instance, suppose you select a group of key gameplay modes in the analysis and use Register as the first event. If you see from the Sankey diagram that more than 44% of sessions pass through 'Challenge Resource Dungeon' after the registration event, then it indicates that the campaign is the most appealing gameplay mode for new users.