# Retention
Retention analysis is a common approach of data analysis, which measures data performance of different batches of new users, indicated most commonly by the retention rate. Increasing the 2nd-, 3rd- and 7th-day retention rate is of great significance for the sustainable development of a project. Using the retention analysis model, you just need to perform a few clicks to analyze the return actions of users of a certain trigger action over a period of time, thereby optimizing decisions informed by macroscopic understanding.
In retention analysis, you will be able to find answers to the following questions:
- What is the proportion of newly registered users who are still active on the following day?
- What is the lifetime value (LTV) of new users over the past 30 days?
- How many days it takes for the ROI across different advertising channels to become positive?
# Quickly configure retention definition
Prior to analysis, you need to determine what user entities are because different user entities represent different perspectives of retention. For example, you may want to view the retention of roles in the game or analyze the 2nd-day retention of accounts.
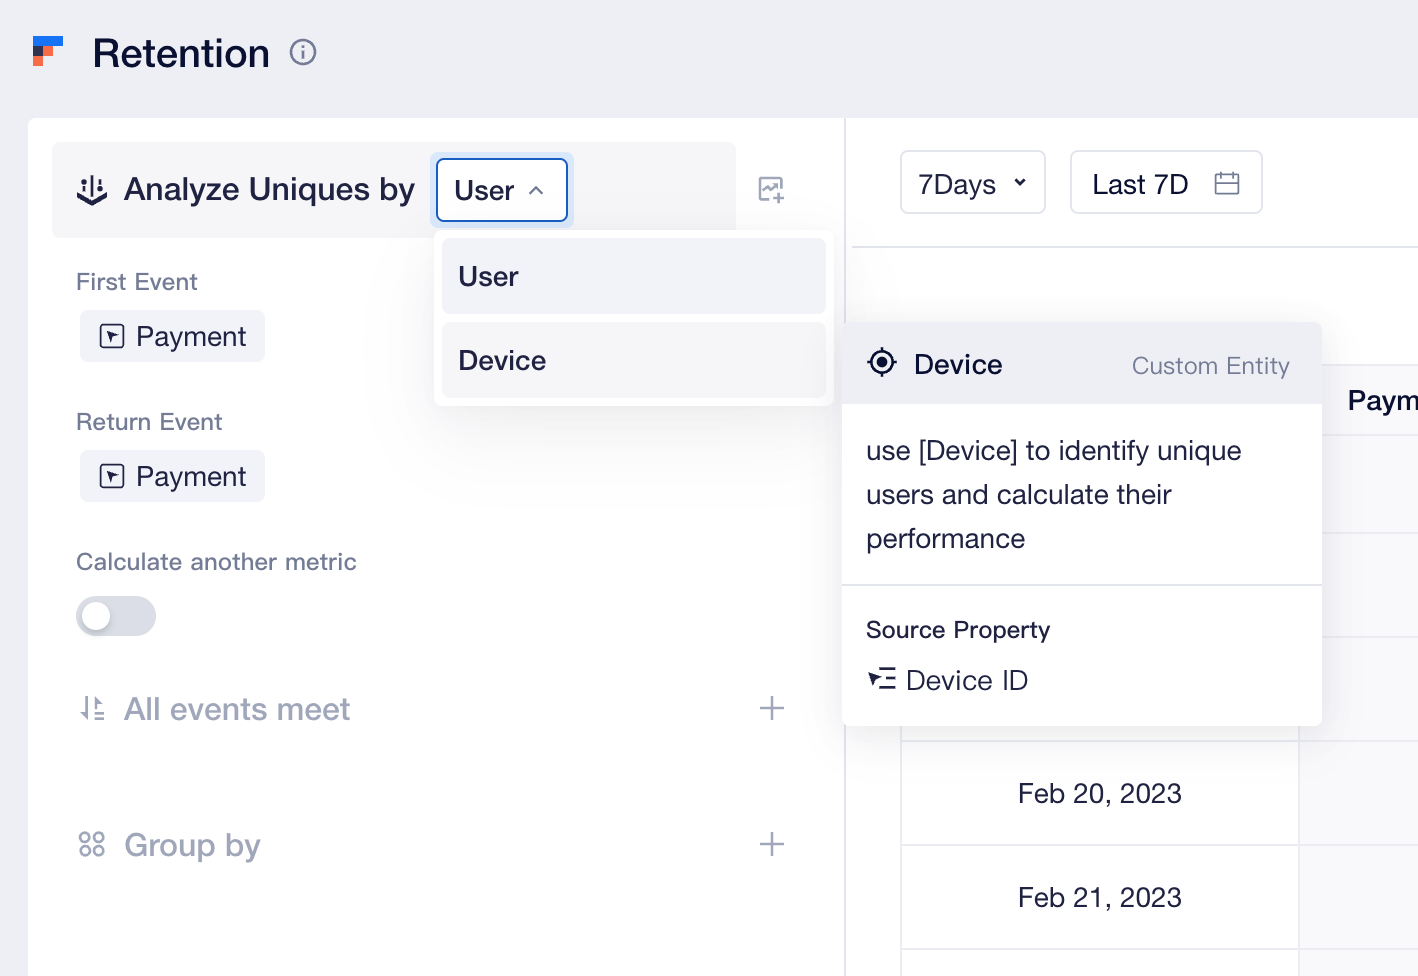
If you want to analyze whether new accounts are still active on the 2nd, 3rd...day, you may perform the following configurations:
- First Event: denotes new growth events such as register.
- Return Event: denotes active events such as login.
By default, retention analysis is conducted at a "daily" basis. You may also carry out weekly and monthly analyses, that is, analyze whether a user entity who has completed trigger action in a certain week/month also completes the return action in the subsequent N-th week/month to obtain the N-th week/month retention. If you want to analyze the daily retention metric but needs to view the weekly or monthly summary of the data, please configure the Display Settings.
Following the configuration of relevant actions, the retention analysis model automatically generates the number of retained users, retention rate, number of users churned and churn rate during the N-th day/week/month. Retention and loss are defined as follows:
- Retention: If a user entity who completed the First Event also completes the Return Event at the N-th day after the trigger action, then the user is recognized as "retained user" on the N-th day.
- Churn: If a user entity who completed the First Event fails to complete the Return Event from the 1st to the N-th day after the trigger action, then the user is recognized as "churned user" on the N-th day.
You may also enable "Calculate another metric" to conduct further analysis and compute other metrics of users who have completed the return action, such as Calculating LTV and ROI。
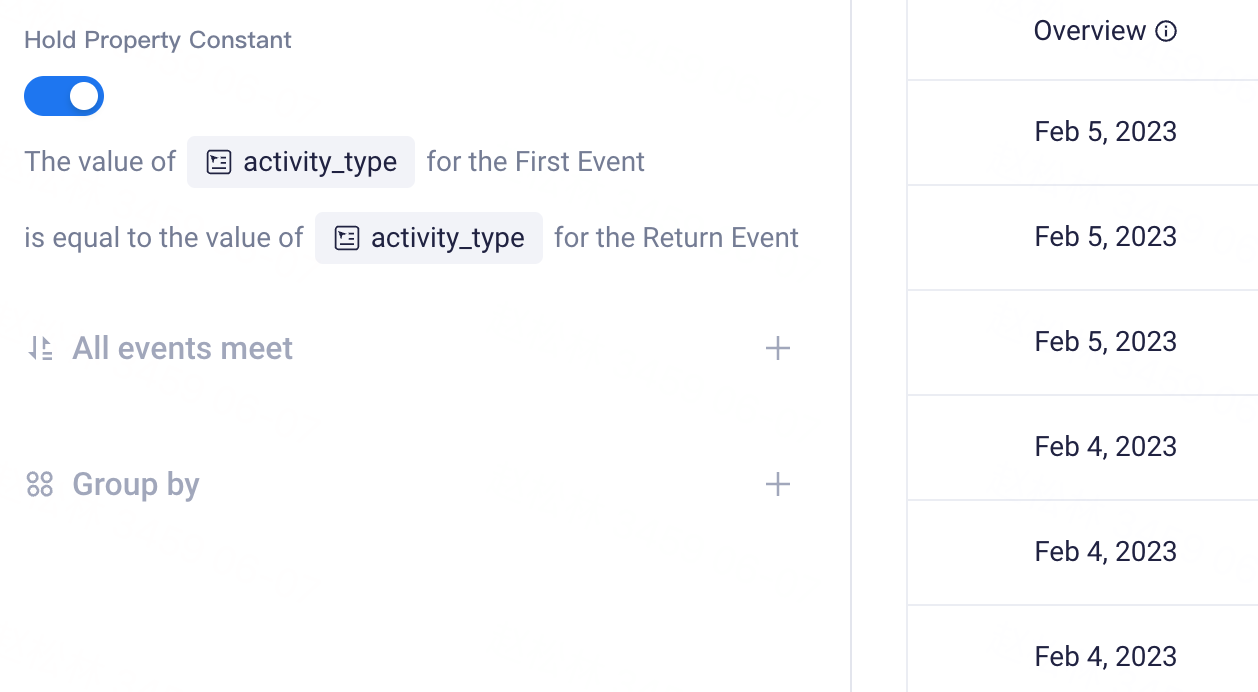
To obtain more accurate retention data, you can also "Hold Property Constant" and select the same type of event properties for the First Event, Return Event, and another metric. When enabled, it not only requires users to complete the Return Event, but also requires the property values to be completely identical. If a user triggers multiple First Event with different property values on the same initial date, they will belong to multiple groups.
For example, if you want to compare different activities in the game and require the same user to participate in the same activity the next day to be counted as a retention user in that gameplay, you can select "activity type" as "Hold Property Constant".
You may also conduct Data Filtering and Group by process.Unlike Events, if you group users by event properties or dynamic matching of tags, then only group value of user entity at the time when trigger action is first implemented is used as user label, that is, only the user entity only falls in one "group-by" item within a period of time.
For example, if you want to analyze a user's active retention between January 1 and January 7, grouping by the VIP level of event property, assume that the user has completed login event on each of the 7 days across different VIP levels, then the user can only be categorized into the group corresponding to the VIP level of the login event triggered on January 1.
# Visualize data results
Retention analysis can be displayed in a variety of visualized forms and is presented as tables by default.
- Table
Each table cell displays the number of retained users/retention rate on the N-th day following a certain initial date, and relevant descriptions can be checked by moving the mouse cursor to the cell. Depending on the magnitude of the retention/churn rate, each cell is filled with different shades of blue to facilitate you to rapidly locate exceptional dates.
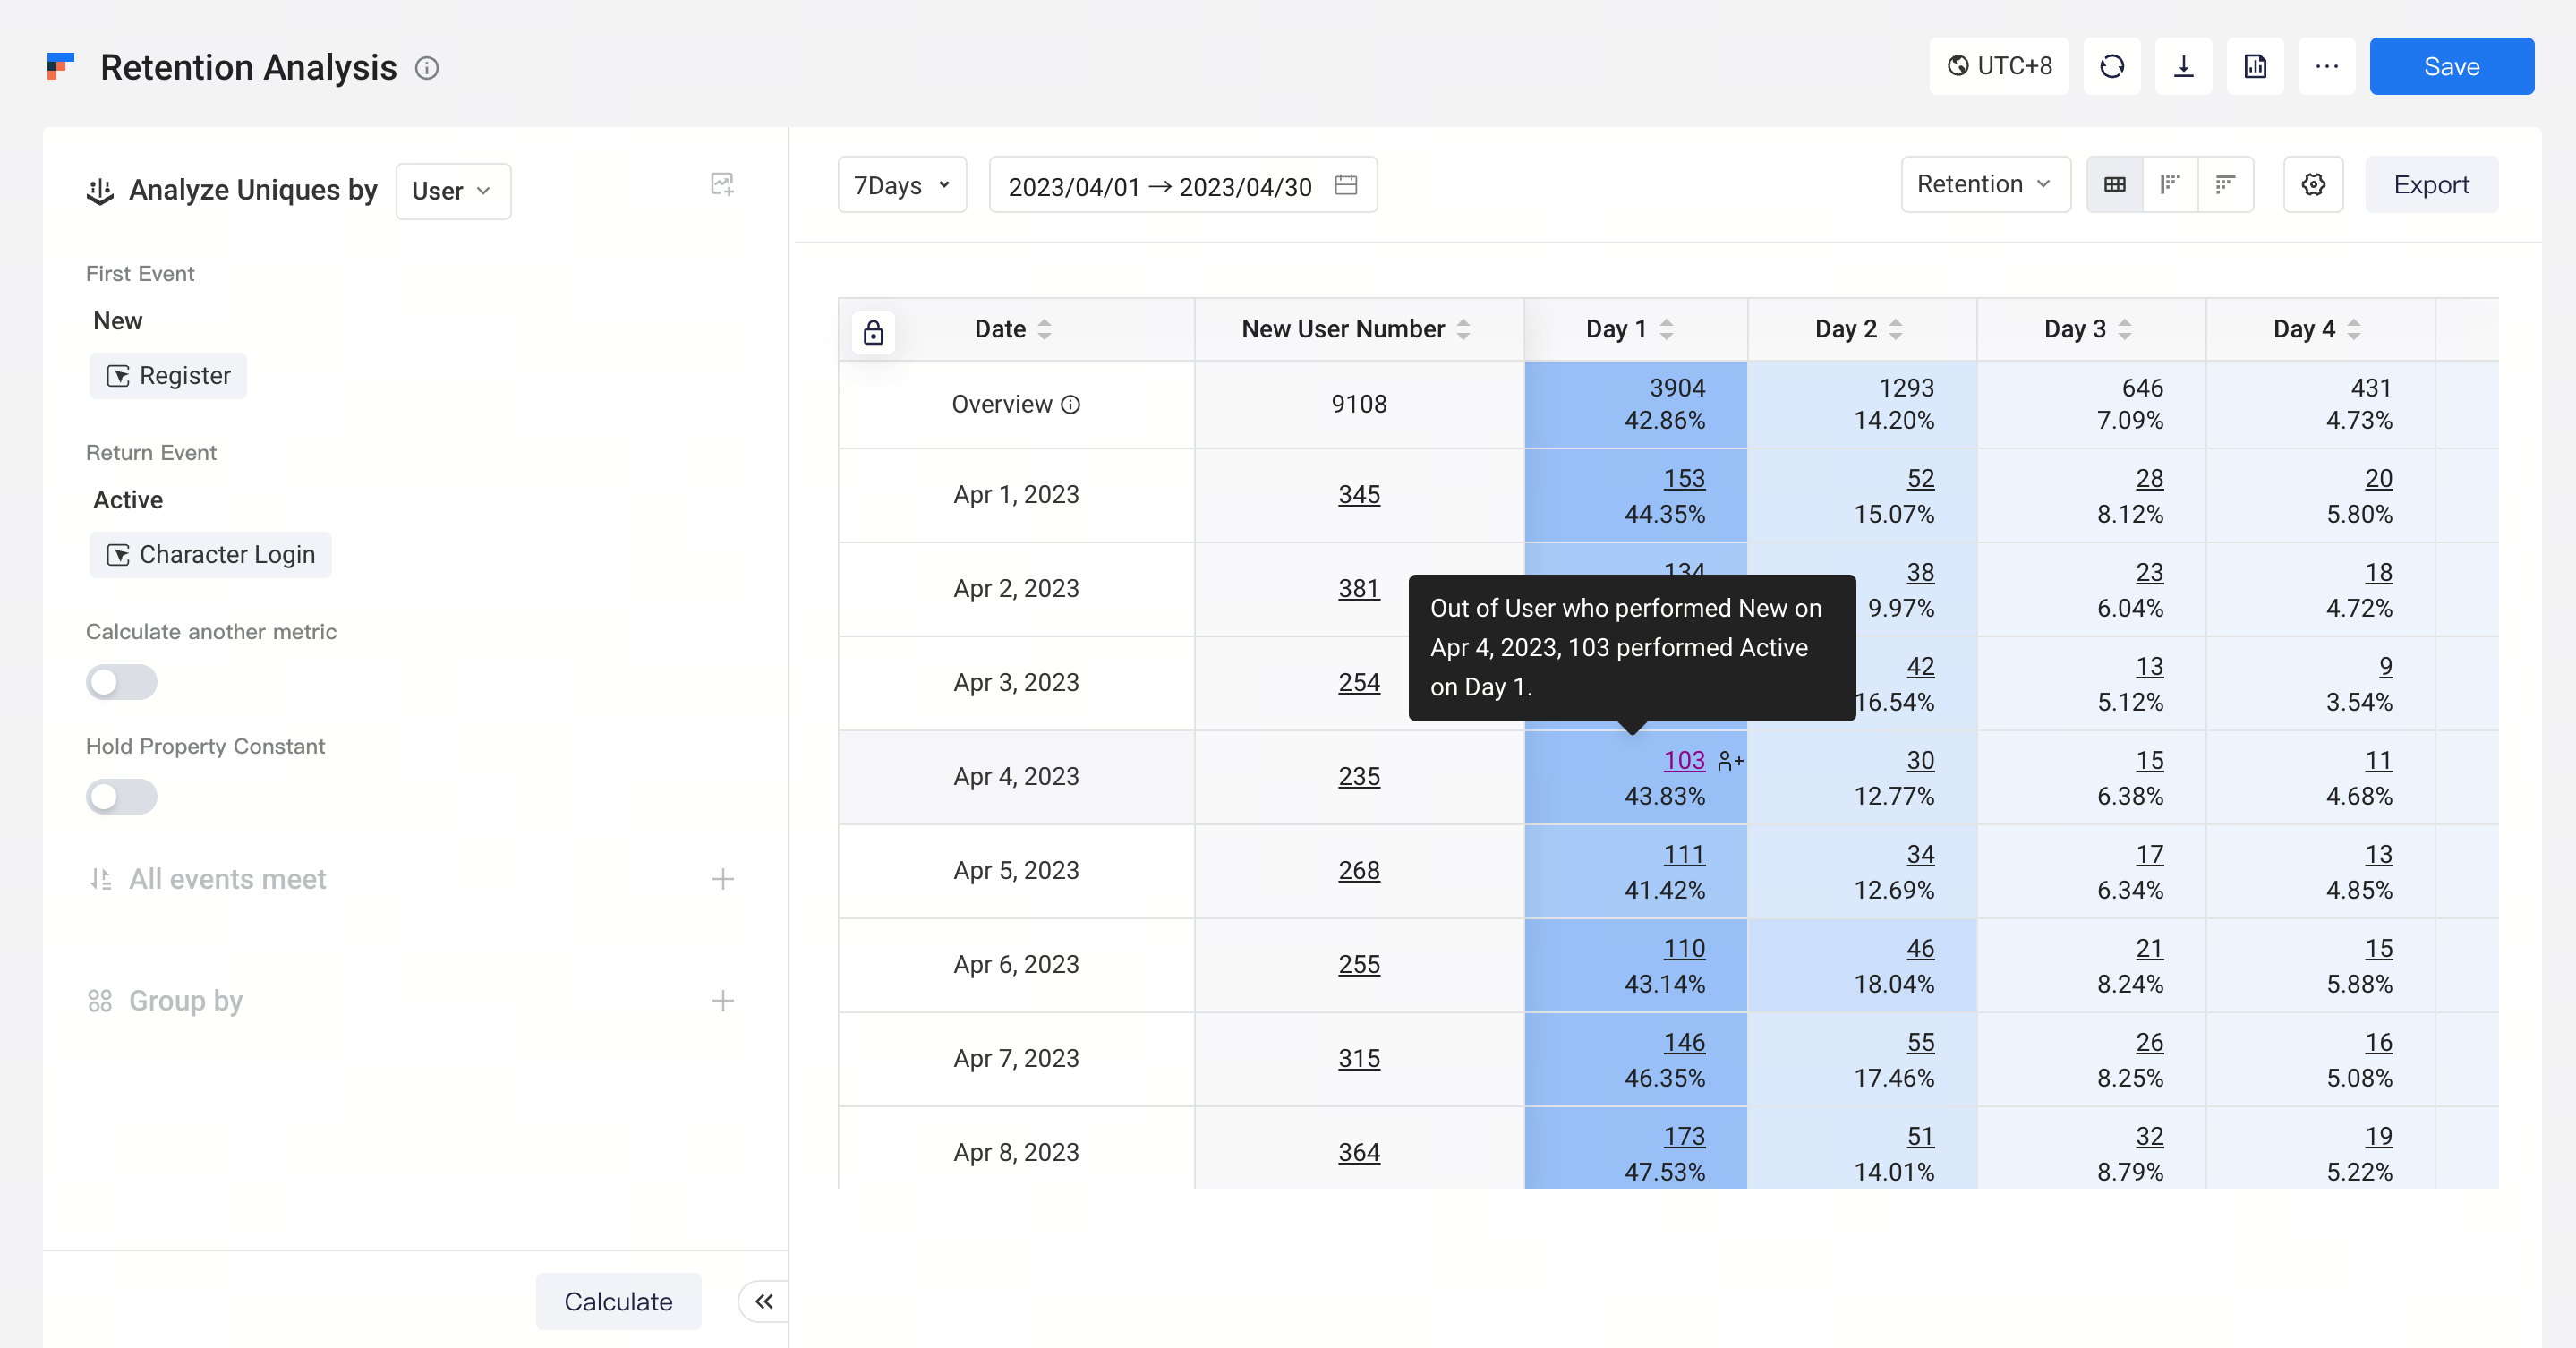
The first row of the table displays phase value data within a certain period of time. You can view the computational logic of phasic values at Instructions on logic of Overview.Beginning from the second row, daily/weekly/monthly retention/churn data will be displayed. If you have configured a "group-by" item, you can click "+" to check data performance of different groups of the date in the pop-up window.
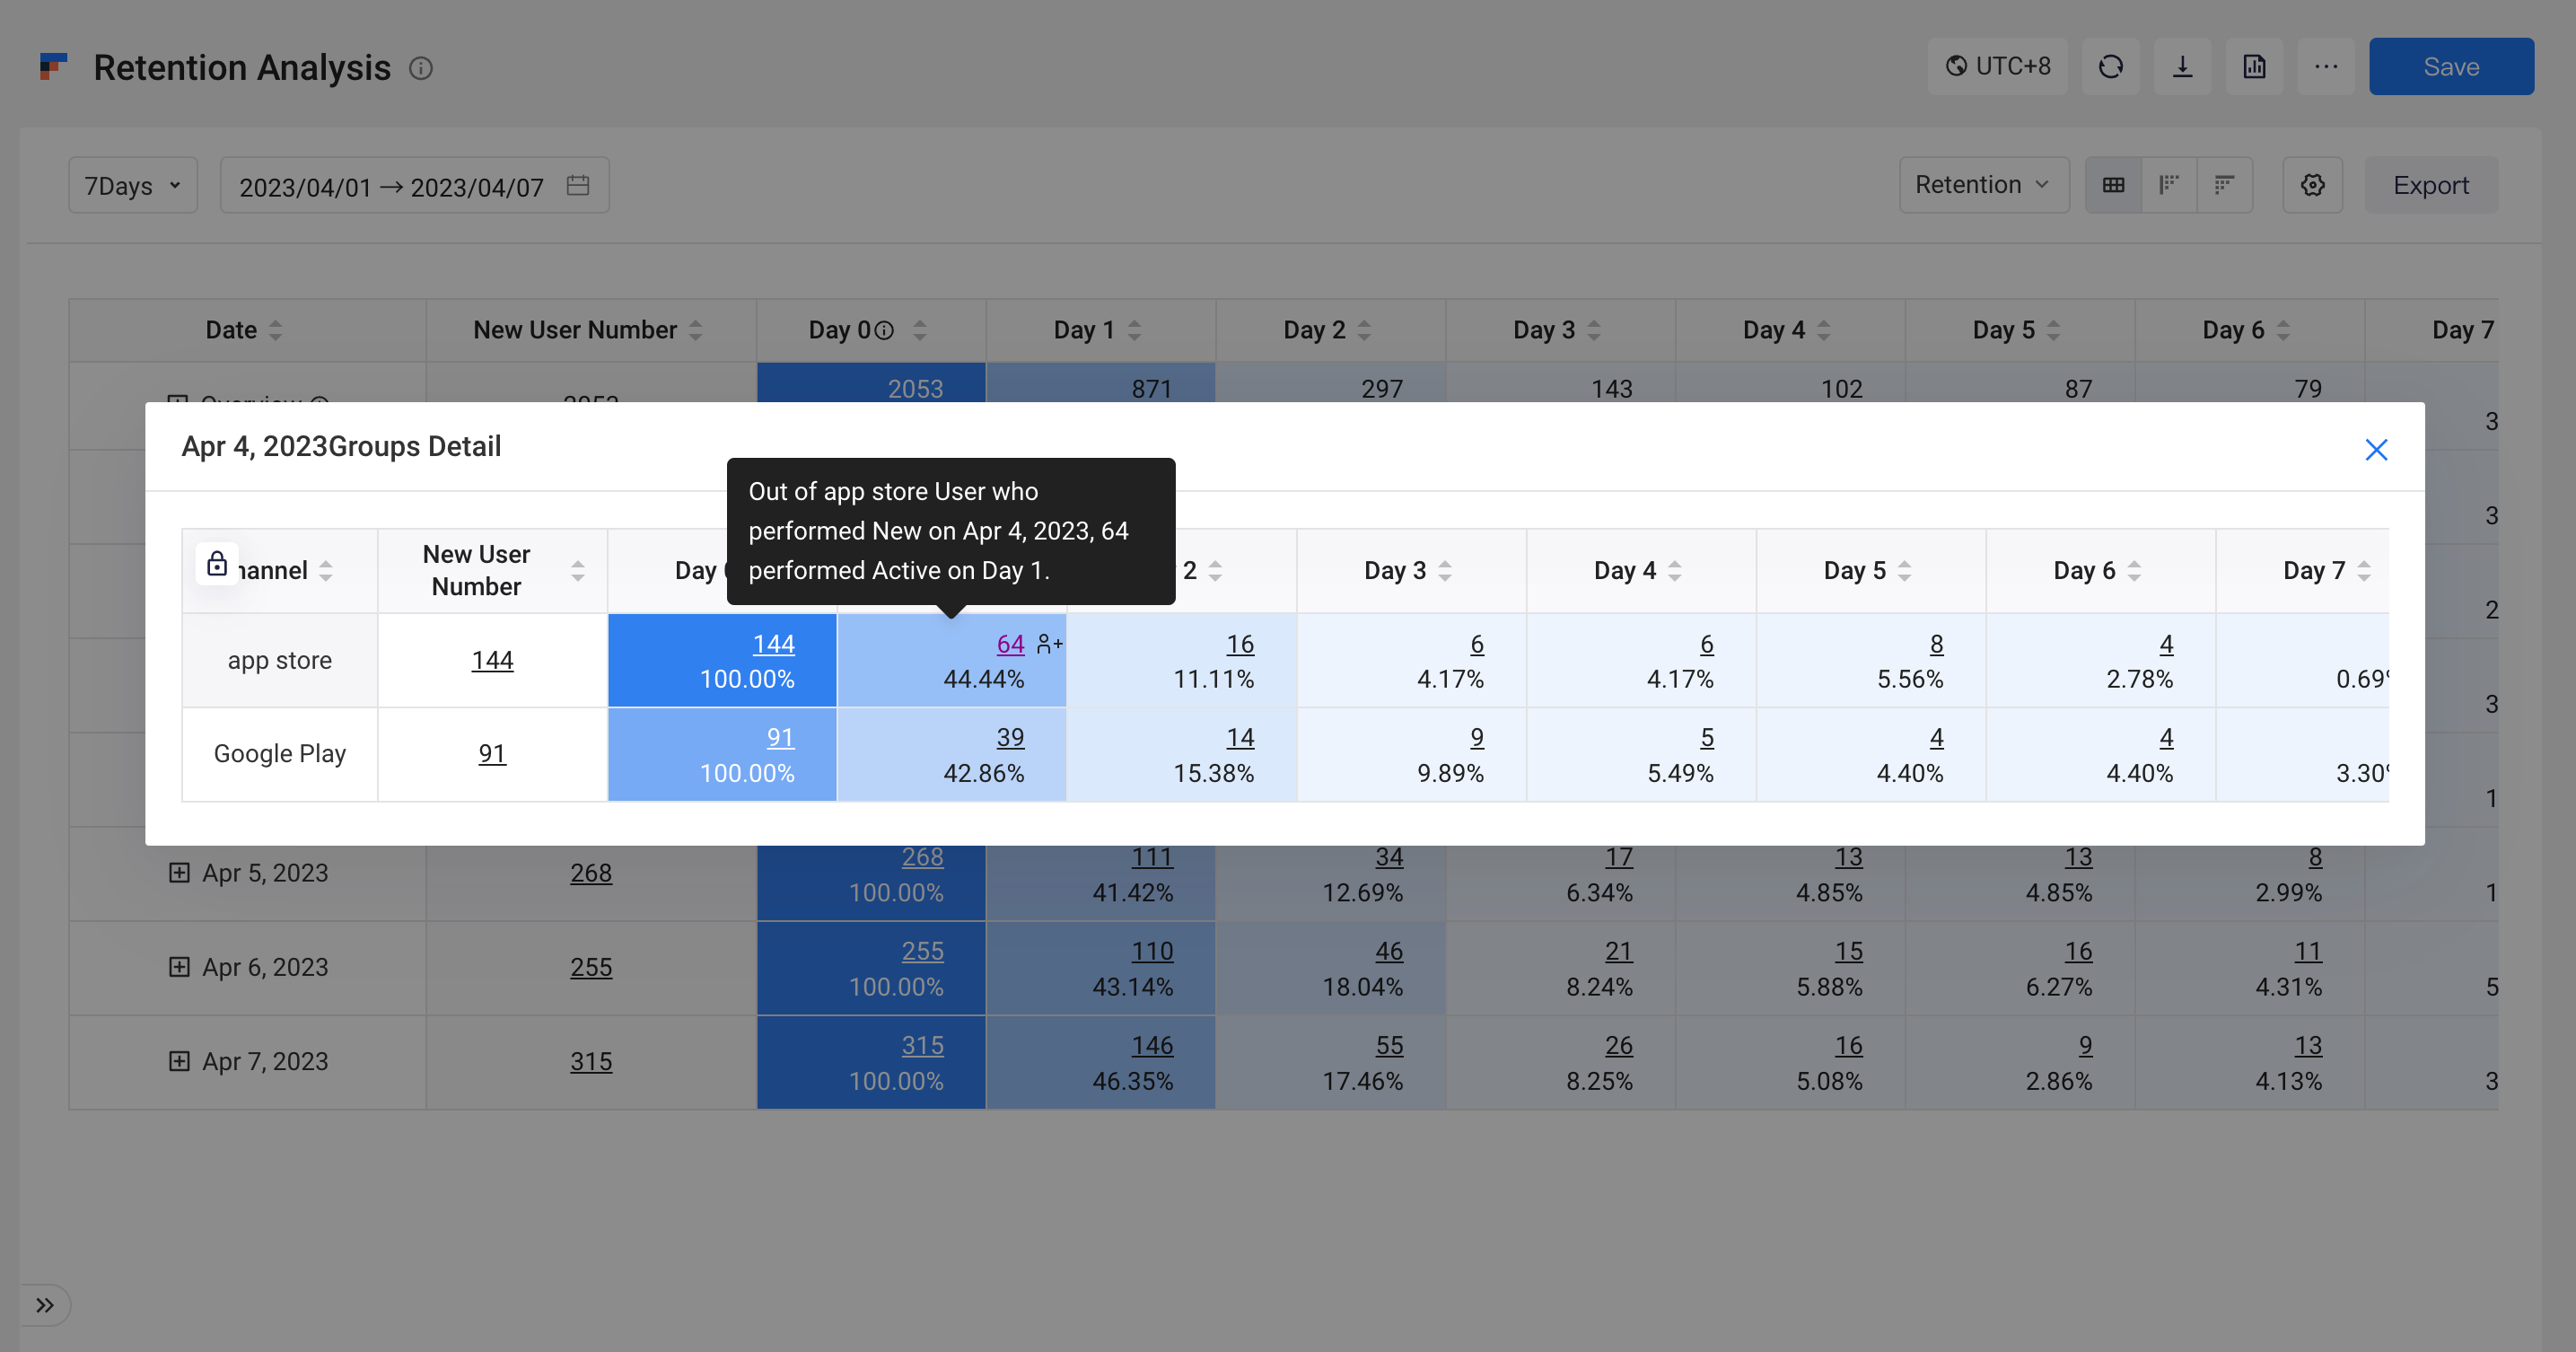
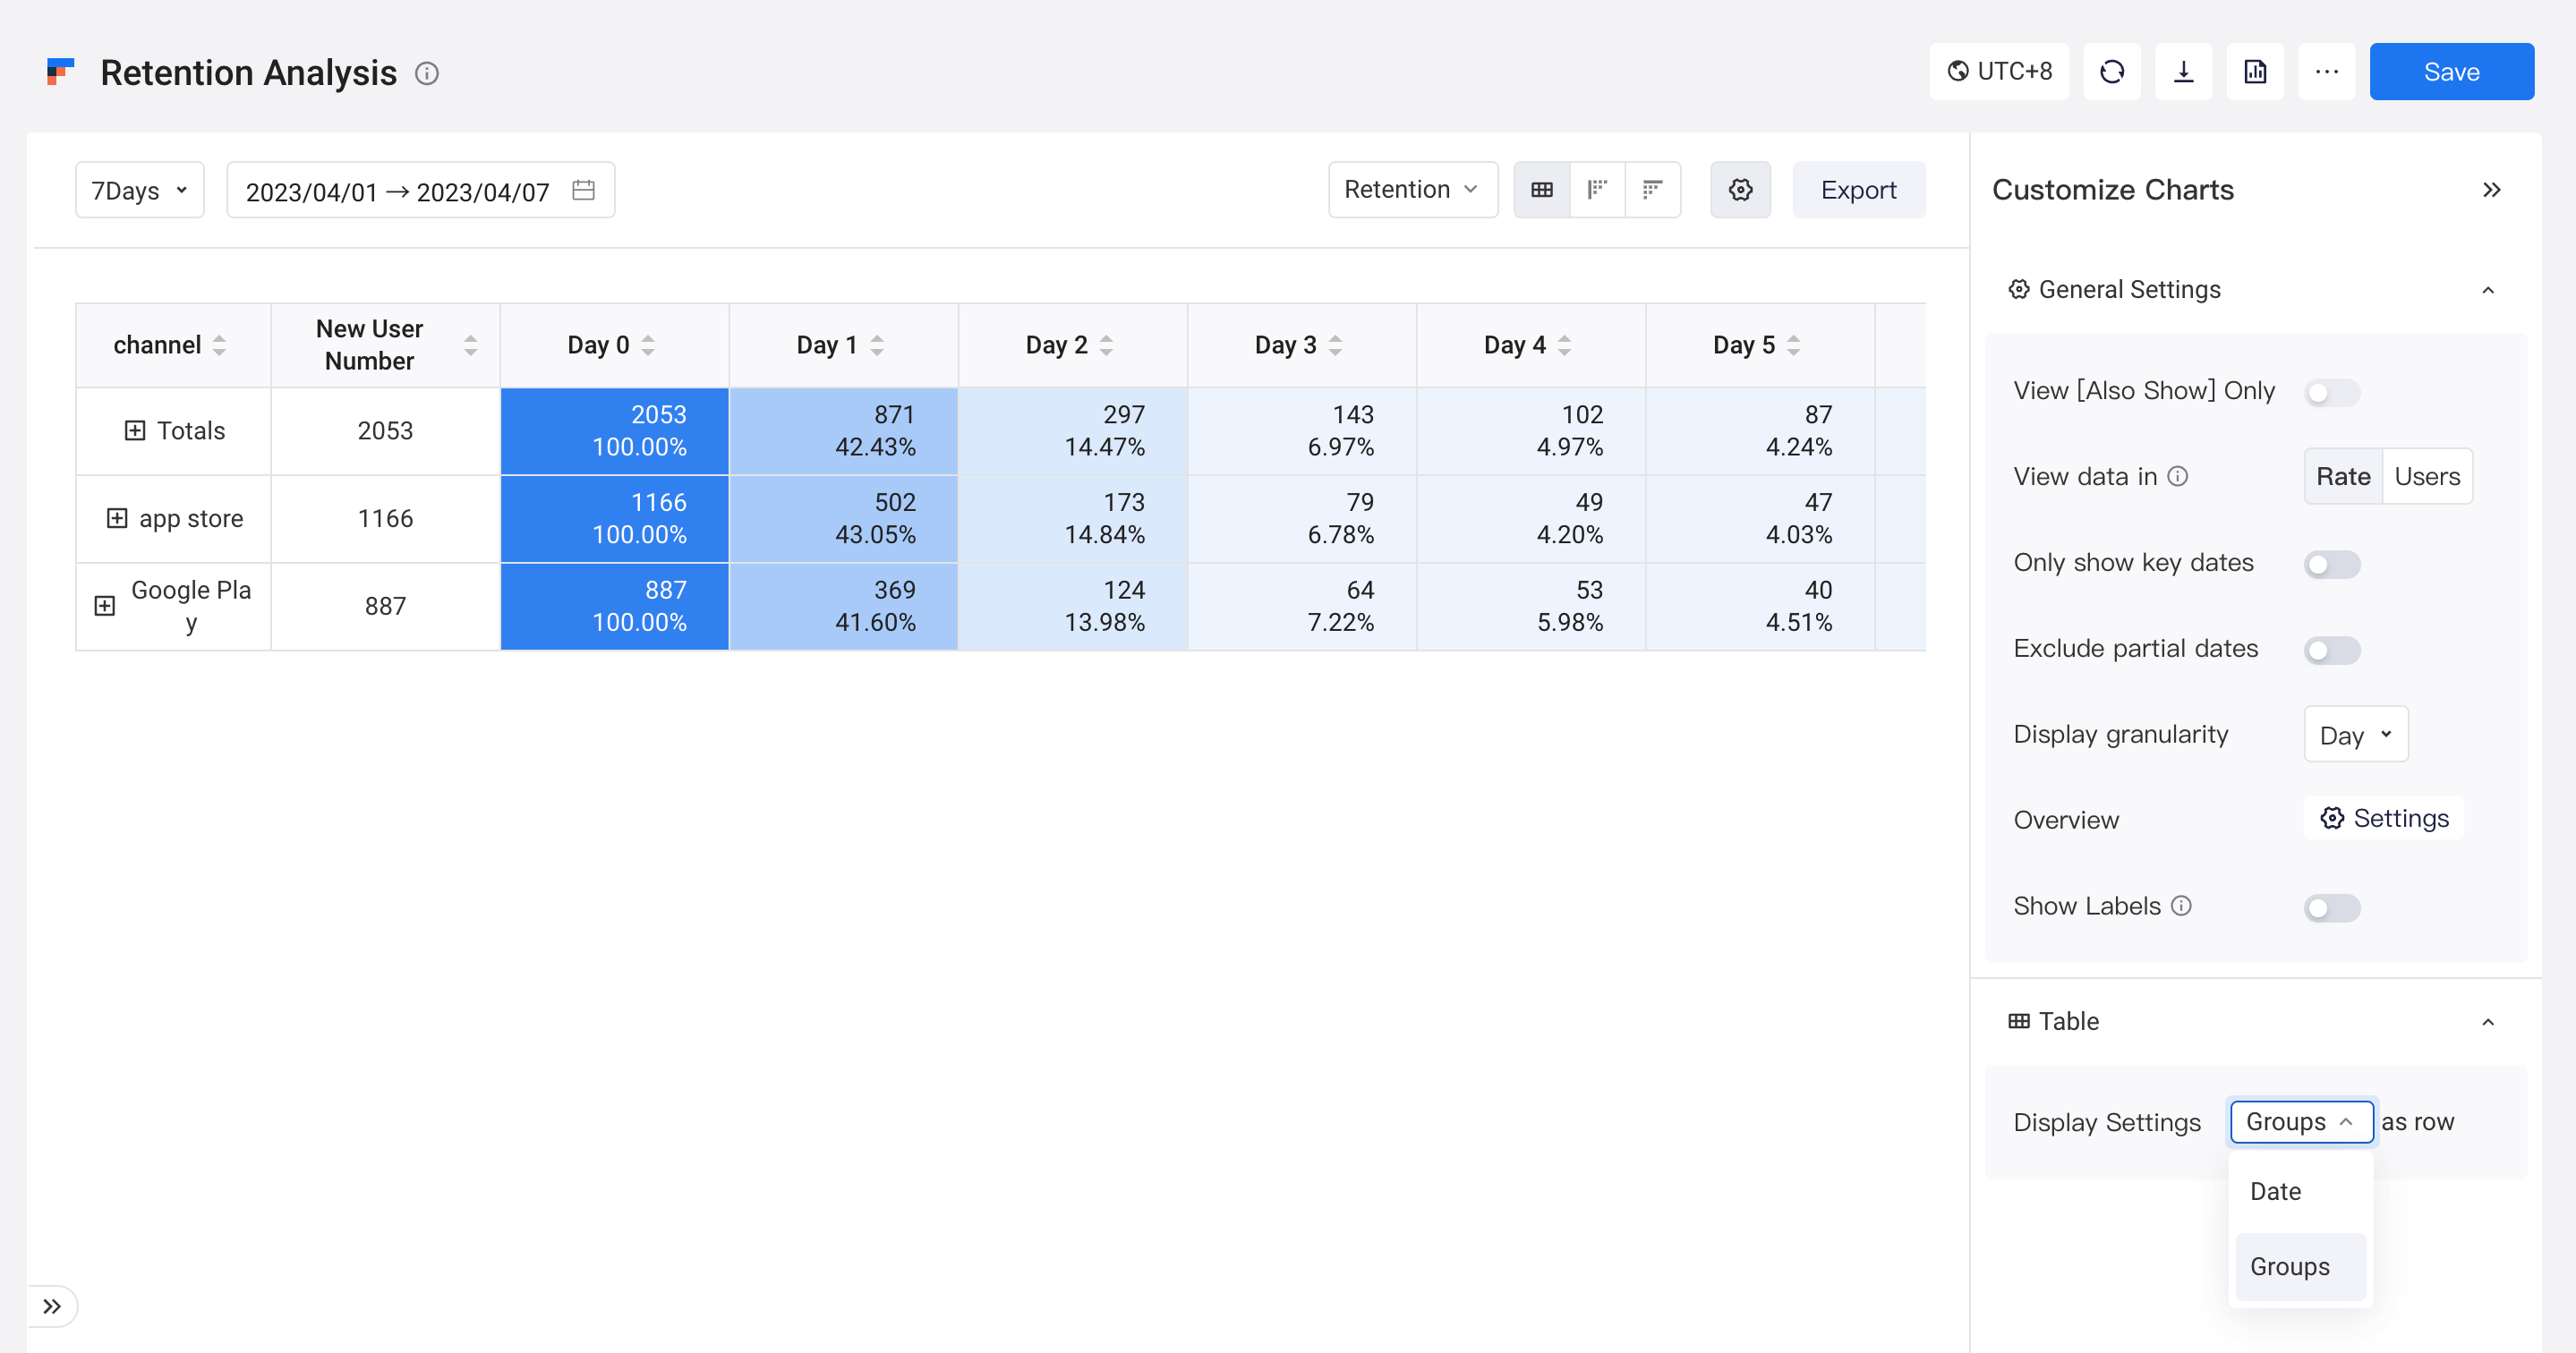
If you would like to compare data table performance of different groups more conveniently, you can switch the table display settings to "Groups as row". The table defaults to displaying Overview data for each group. You can click "+" to check data performance of different dates of the group in the pop-up window.
It should be noted that cells involving data of "today" is labeled with a (*) because it is still changing.
For example, when checking retention rate data on January 7, cells falling in the 2nd day of January 6, the 3rd day of January 5 and the 4th day of January 4 will all be labeled with a (*).
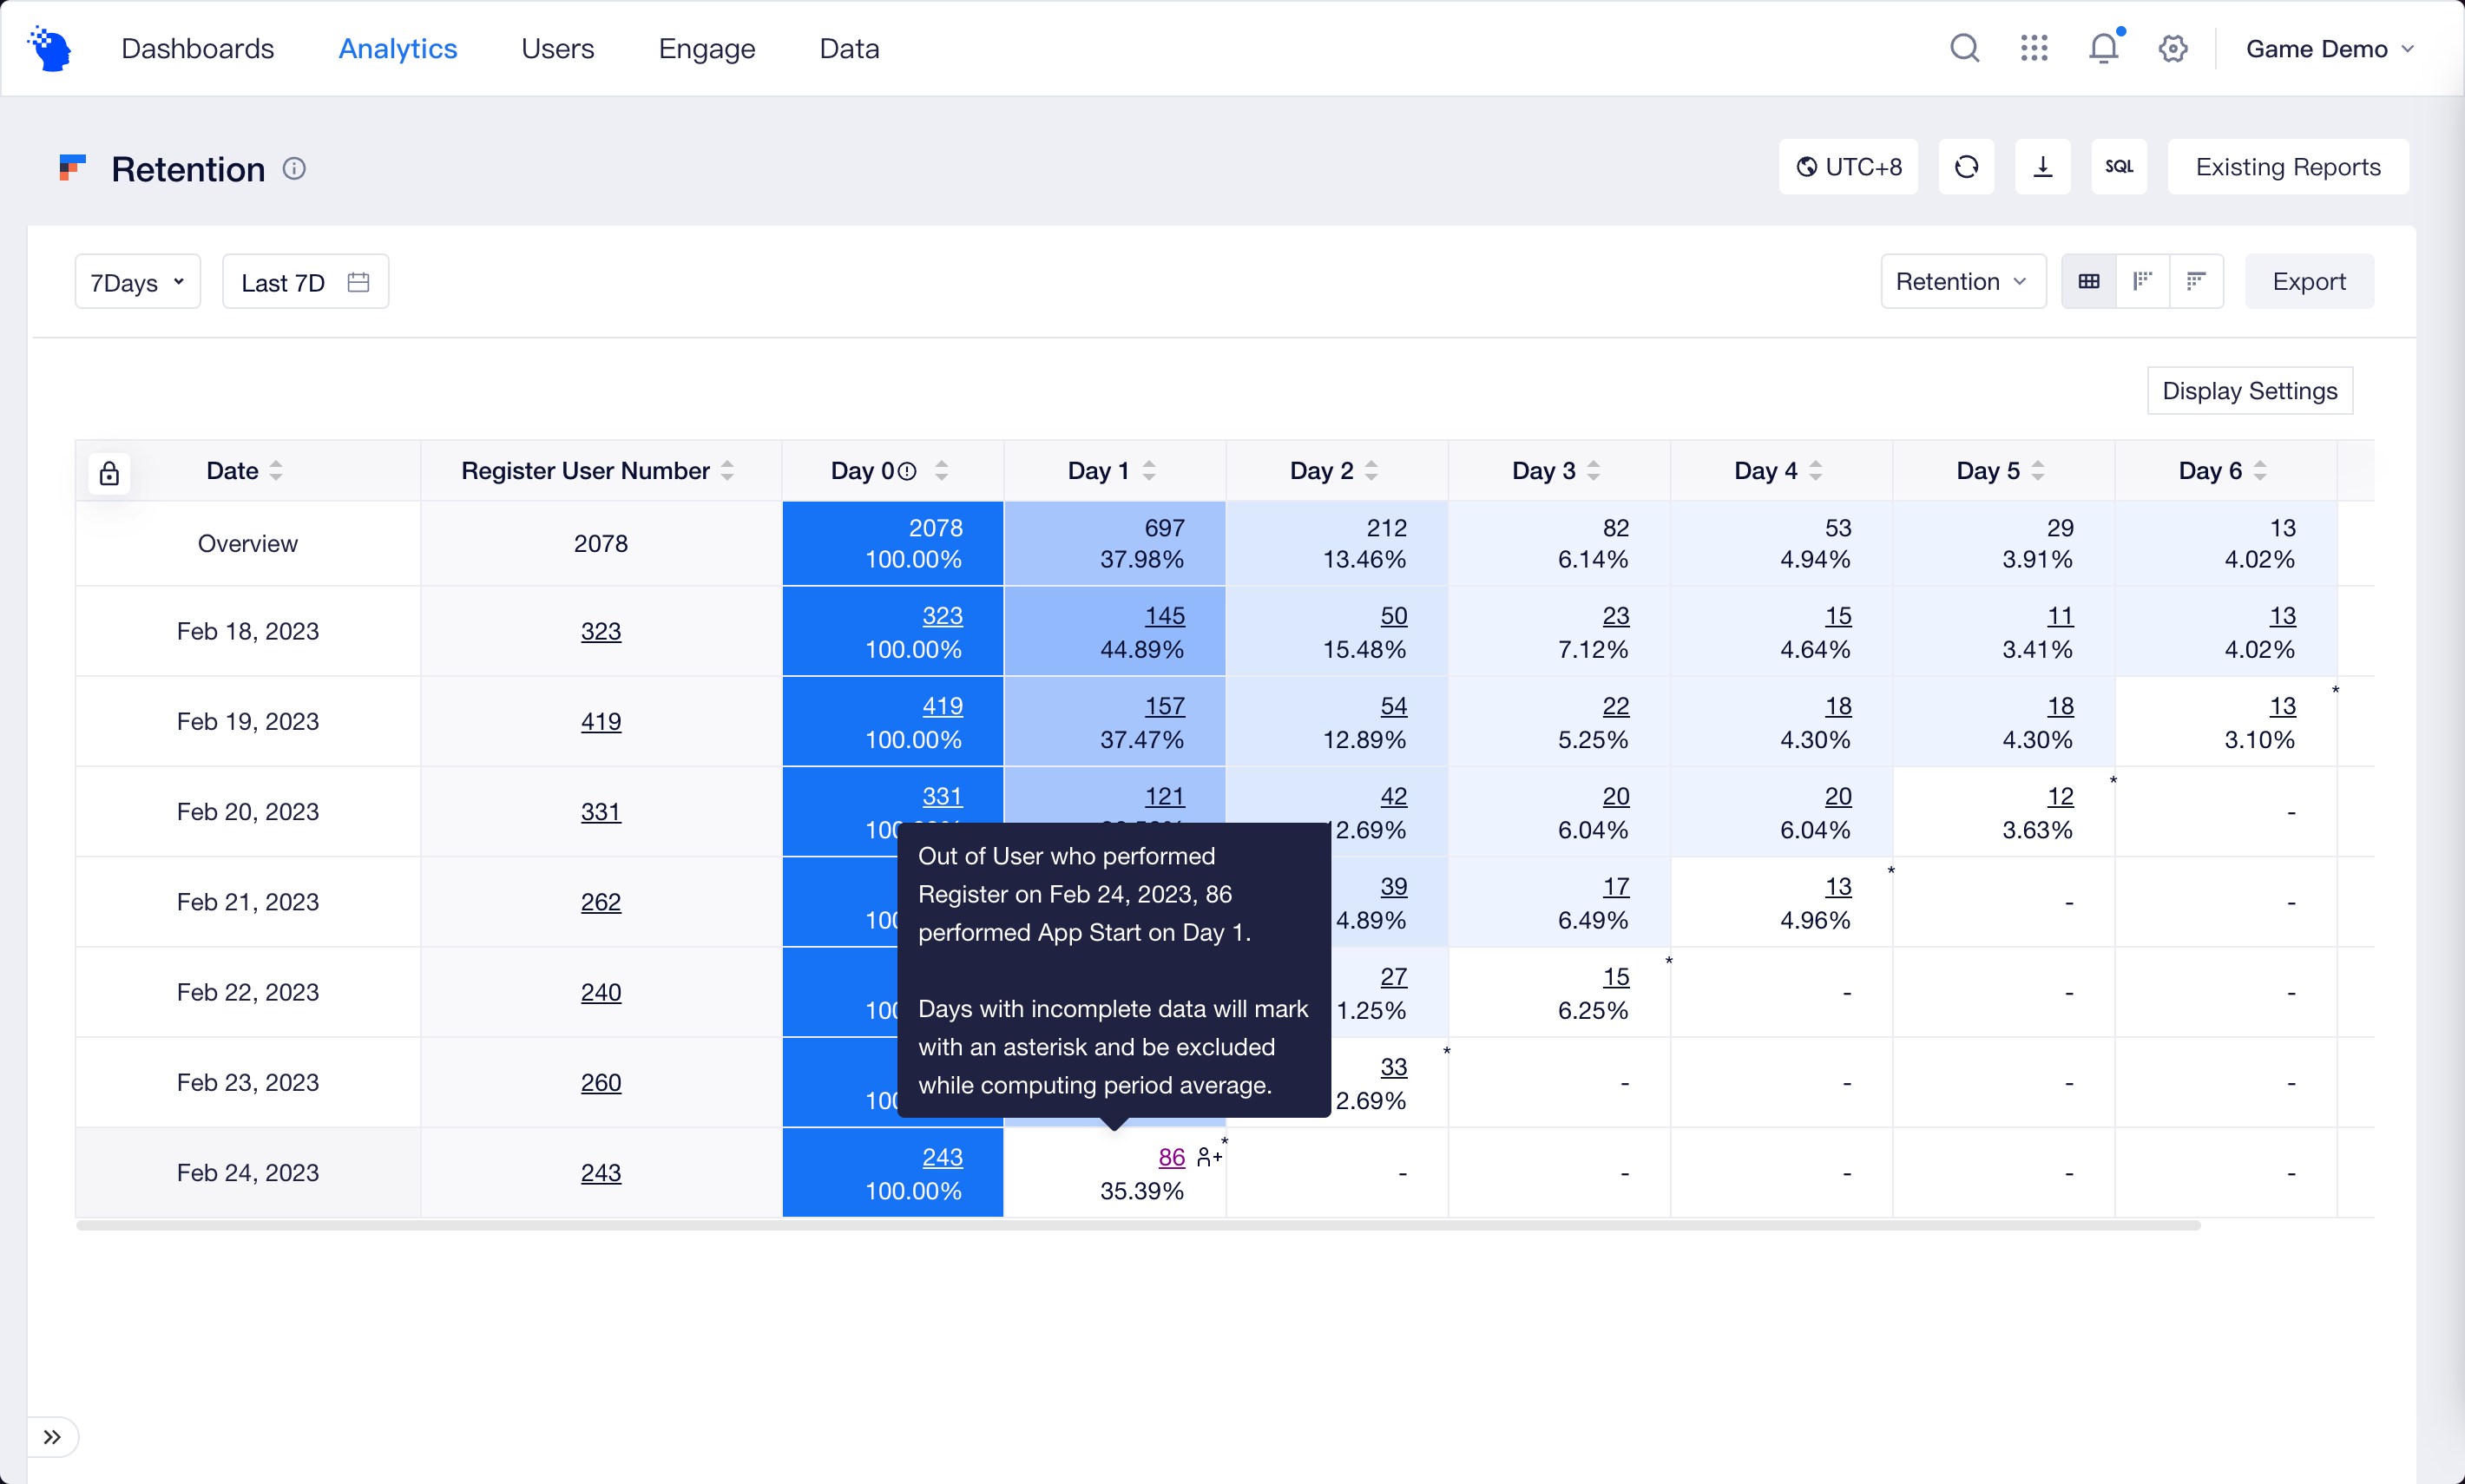
You can exclude the intervention of on-changing data by using "Exclude partial dates". It will affect the table display, data export and download.
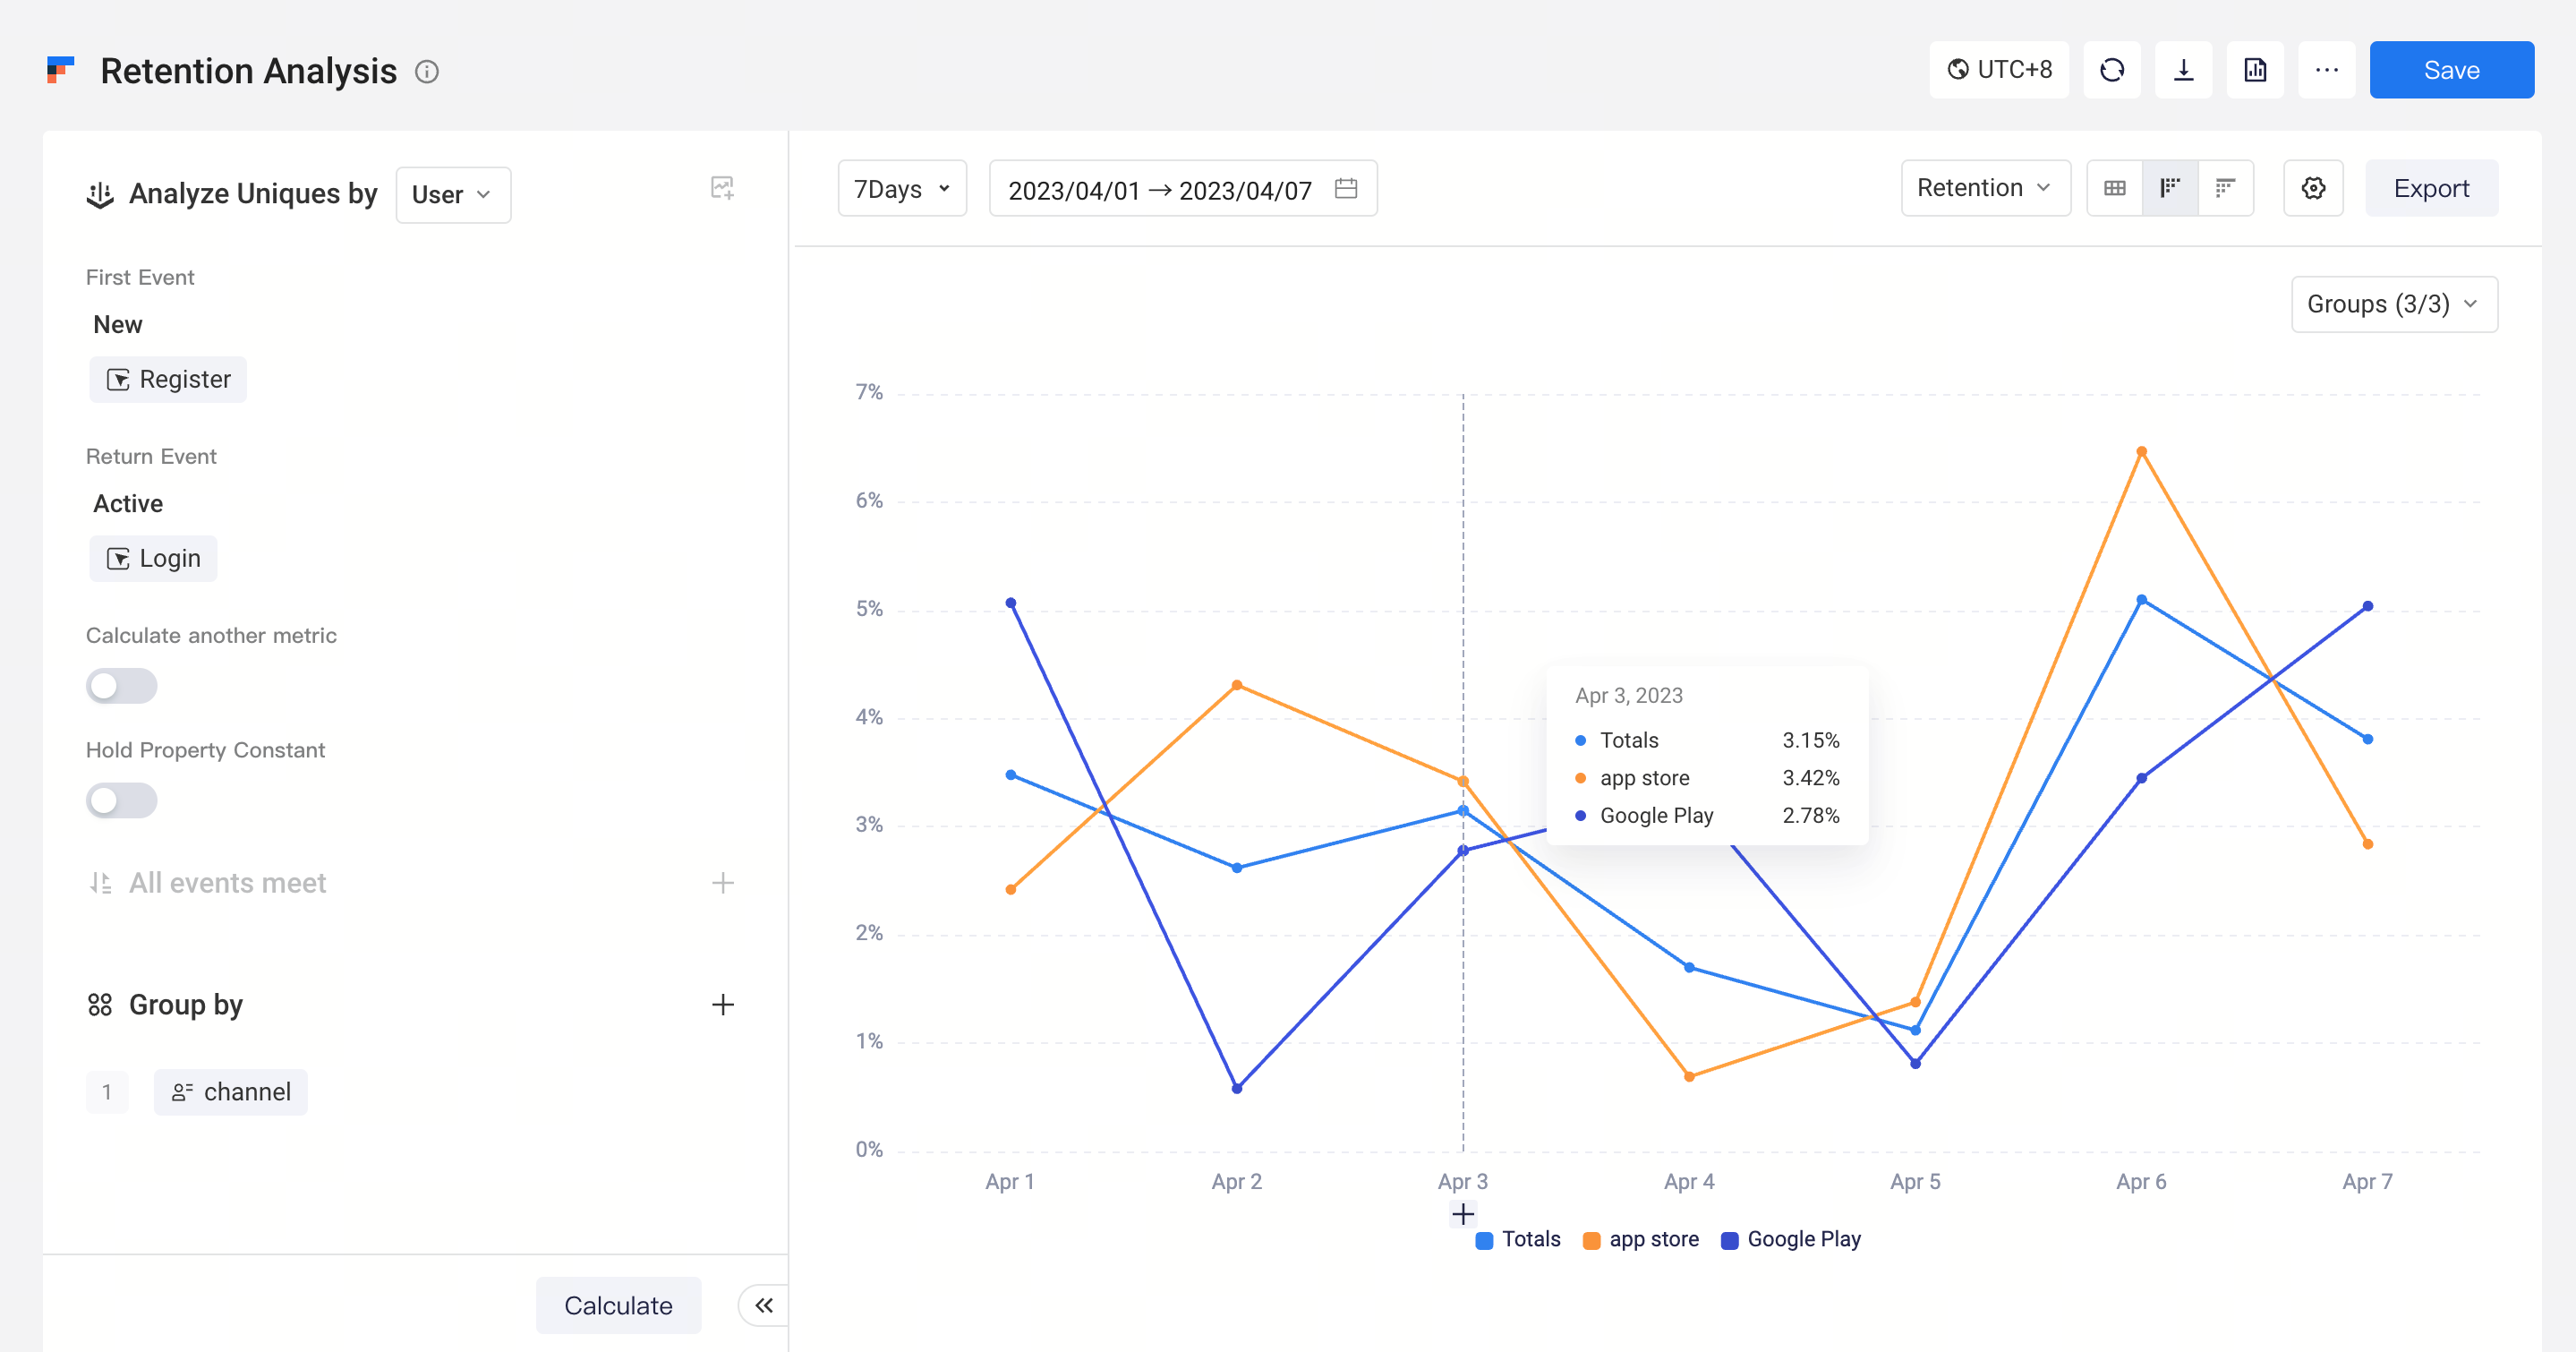
- Day N Retention
Day N Retention displays the change of changes in retention/churn on the Day N over time in the form of a line chart. Compared with tables, it allows you to identify the date of exceptional First Event more easily.
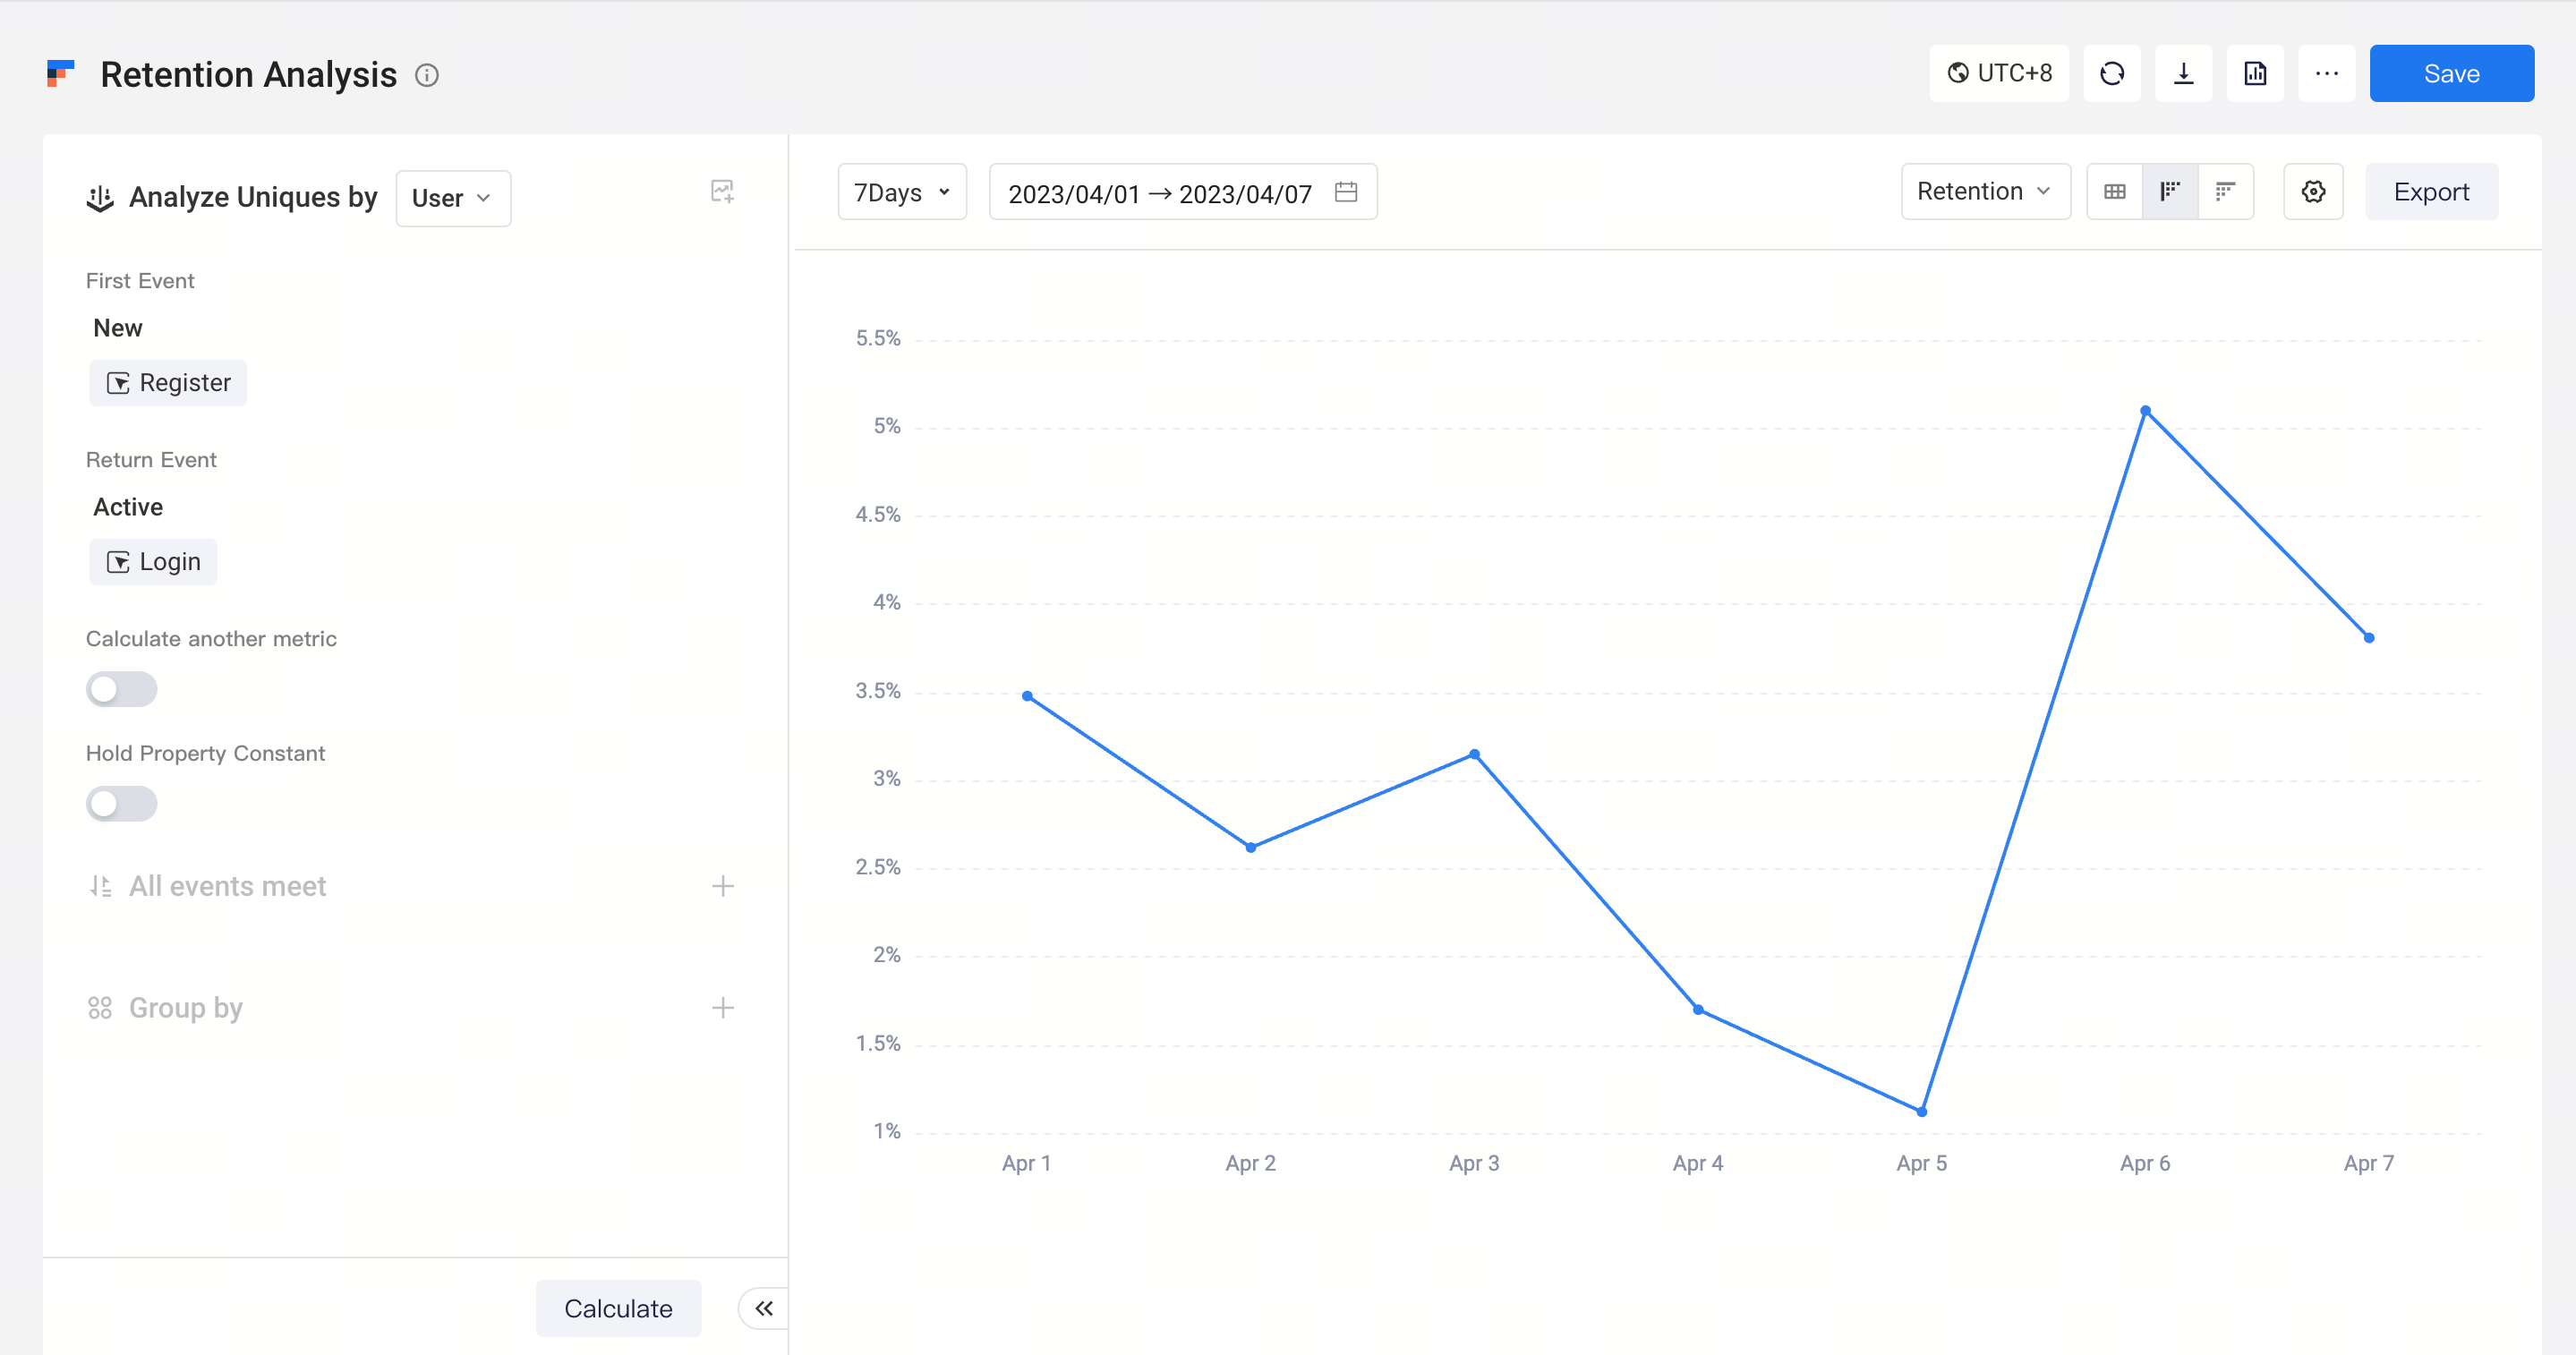
The X-axis of the Day N Retention is the dates of First Event, and each line represents the data of a group item.
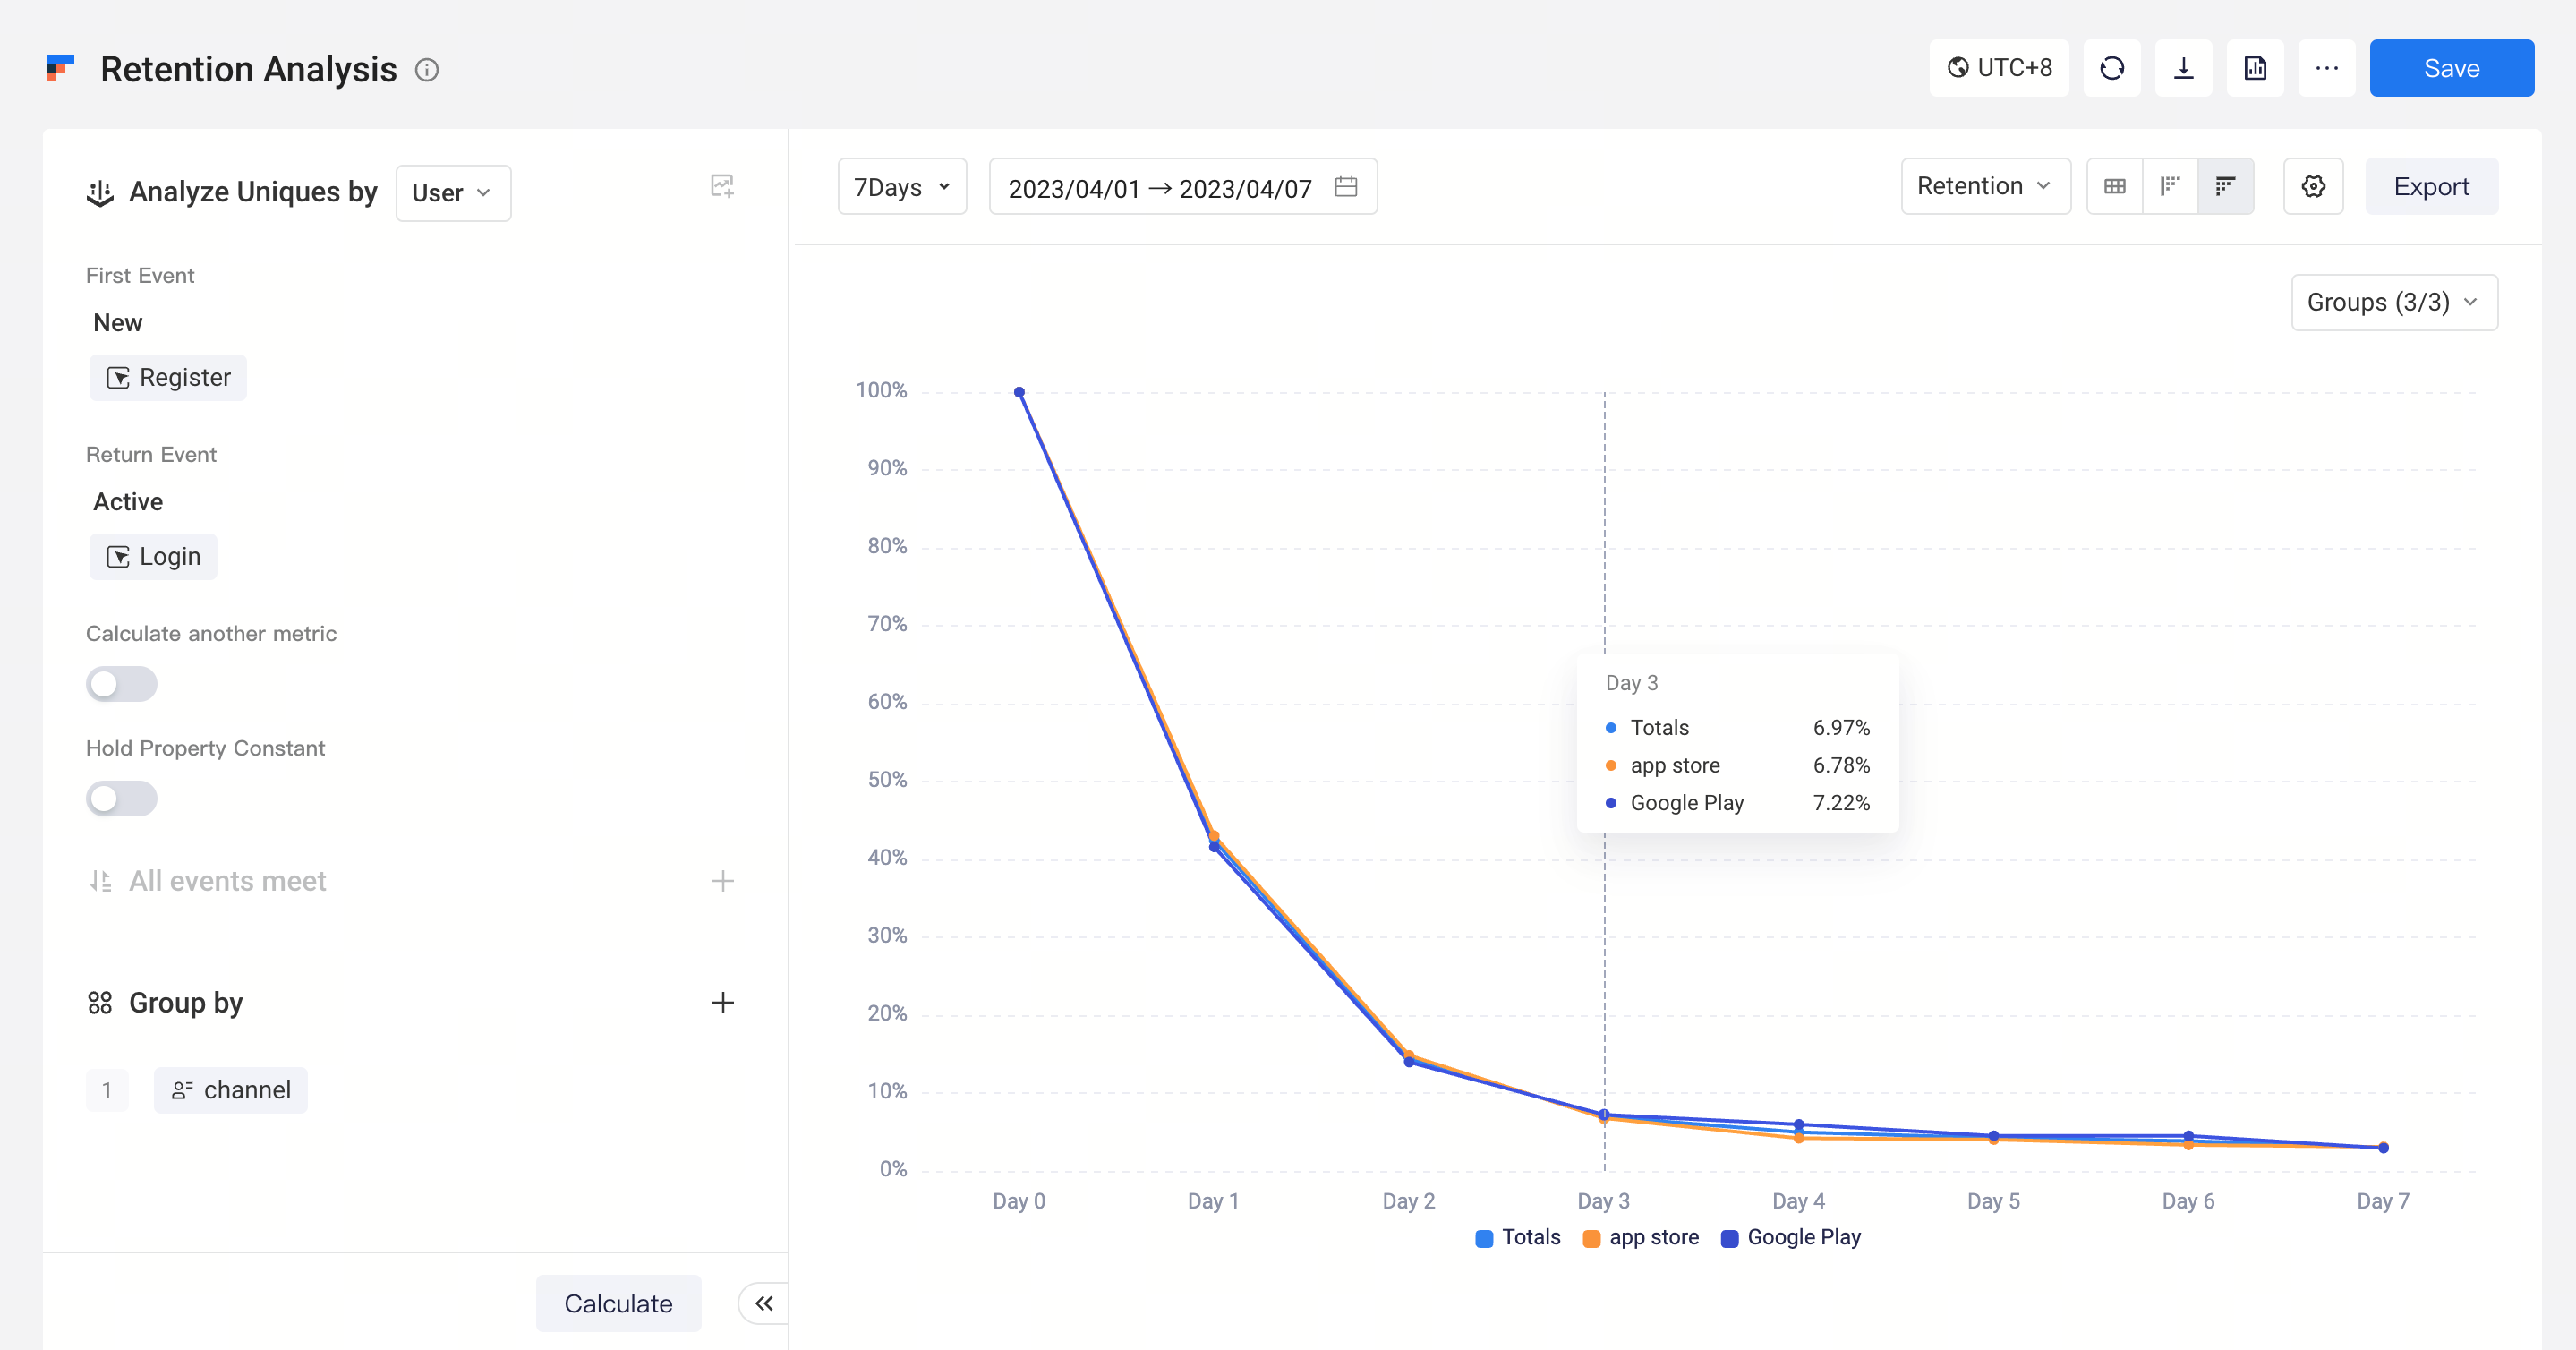
- Daily Retention
Using Daily Retention, you will be able to compare retentions of users competing First Event at different dates at the subsequent Day 1, Day 2 to Day N.
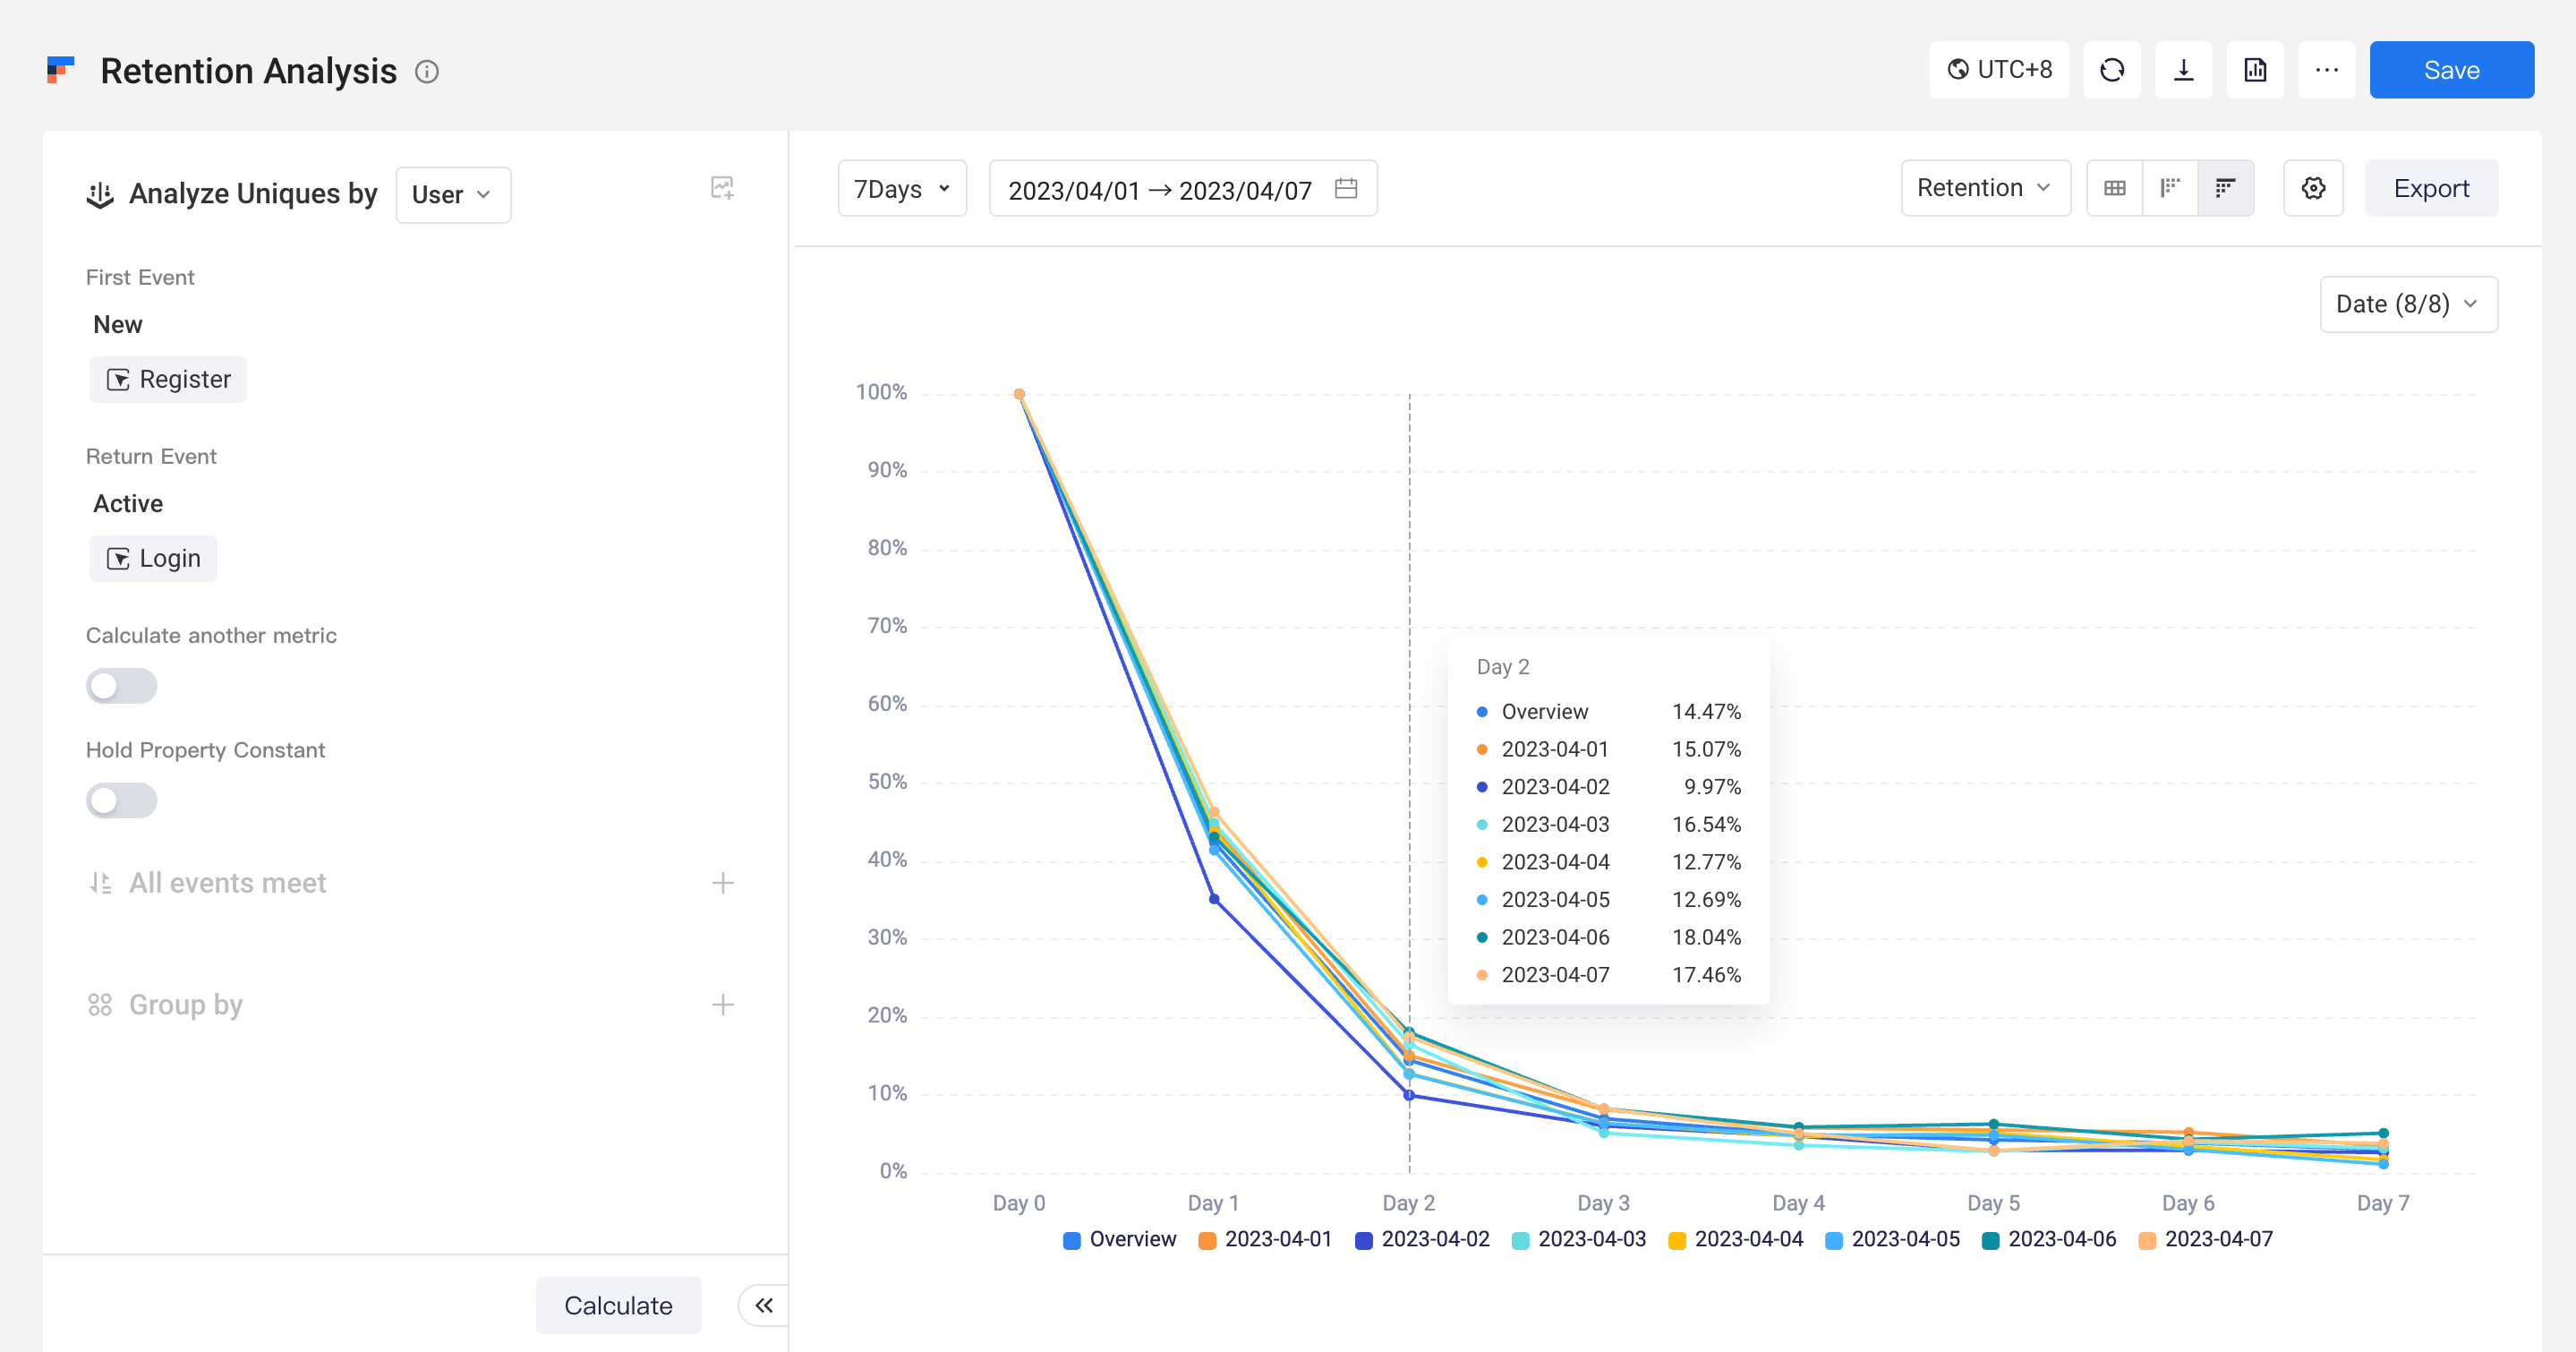
Unlike the Day N Retention, the X-axis of Daily Retention represents the N-th day, and each line represents the date of a First Event. If you have configured the group item, then each line represents Overview values of each group item.