# Group by
Comparison is a common method in analysis, such as horizontal performance comparison of different dimensions on the same date. You can do this using "Group by" in the analysis model. If you want to compare the data on different dates, you can add comparison intervals into the event analysis.
# Function Description
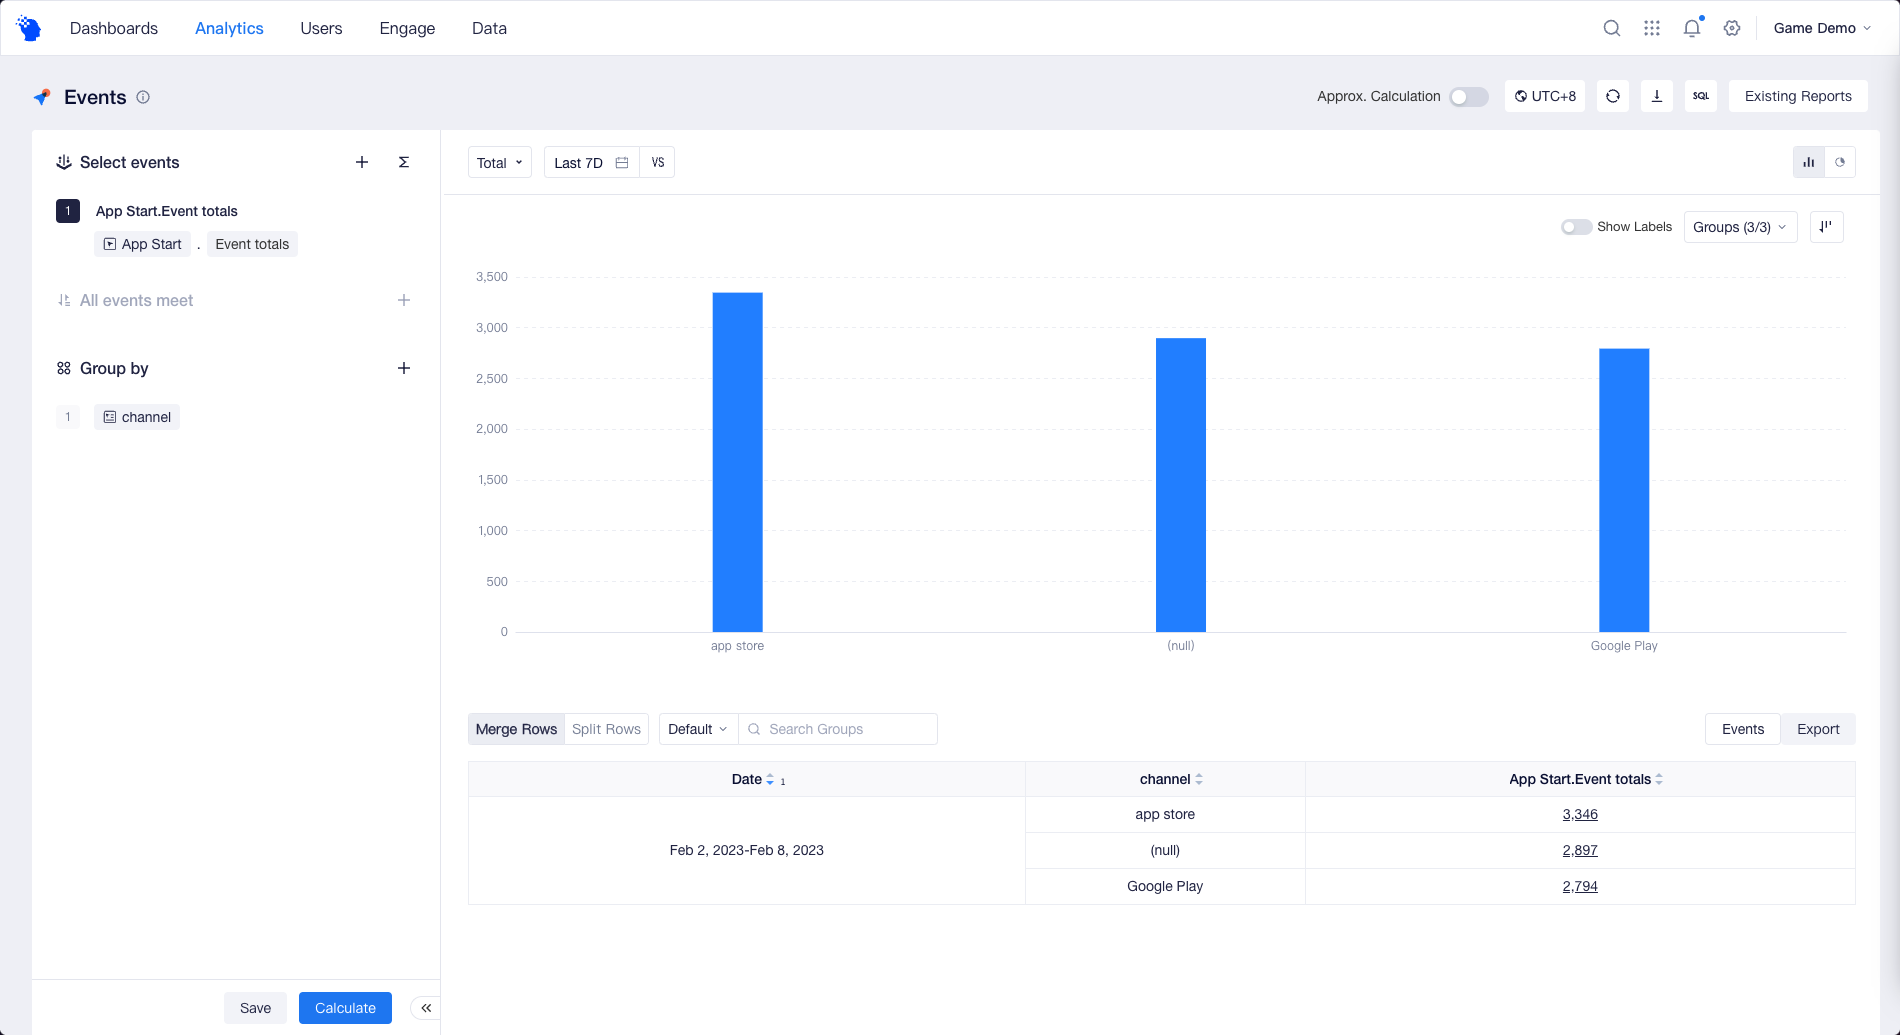
"Group by" can help you view the data results based on different subgroup values. Event properties, user properties, tags, cohorts can be used as grouping basis.
For example, if you choose "channel" for "Group by", which has subgroup values such as app store and Google Play, then you can obtain data results about the number of payment orders of each channel.
You can also add multiple properties for "Group by" to do cross-comparison of performance in multiple dimensions between subgroup values. Except for Funnel and Composition, up to 50 properties can be added for "Group by".
# Sum by
If the data type of the property added for "Group by" is Number, List or Date, as there may be many subgroup values, you can set the grouping method to combine different subgroup values into one group.
- Number
| Grouping methods | Logic behind calculation |
|---|---|
| Default Value |
Determined automatically based on the number of grouping property values
|
| Discrete value | Grouped on the basis of actual values. But if the number of grouping property values is ≥ 500, all values will be divided into 12 intervals according to the maximum and minimum values, etc. |
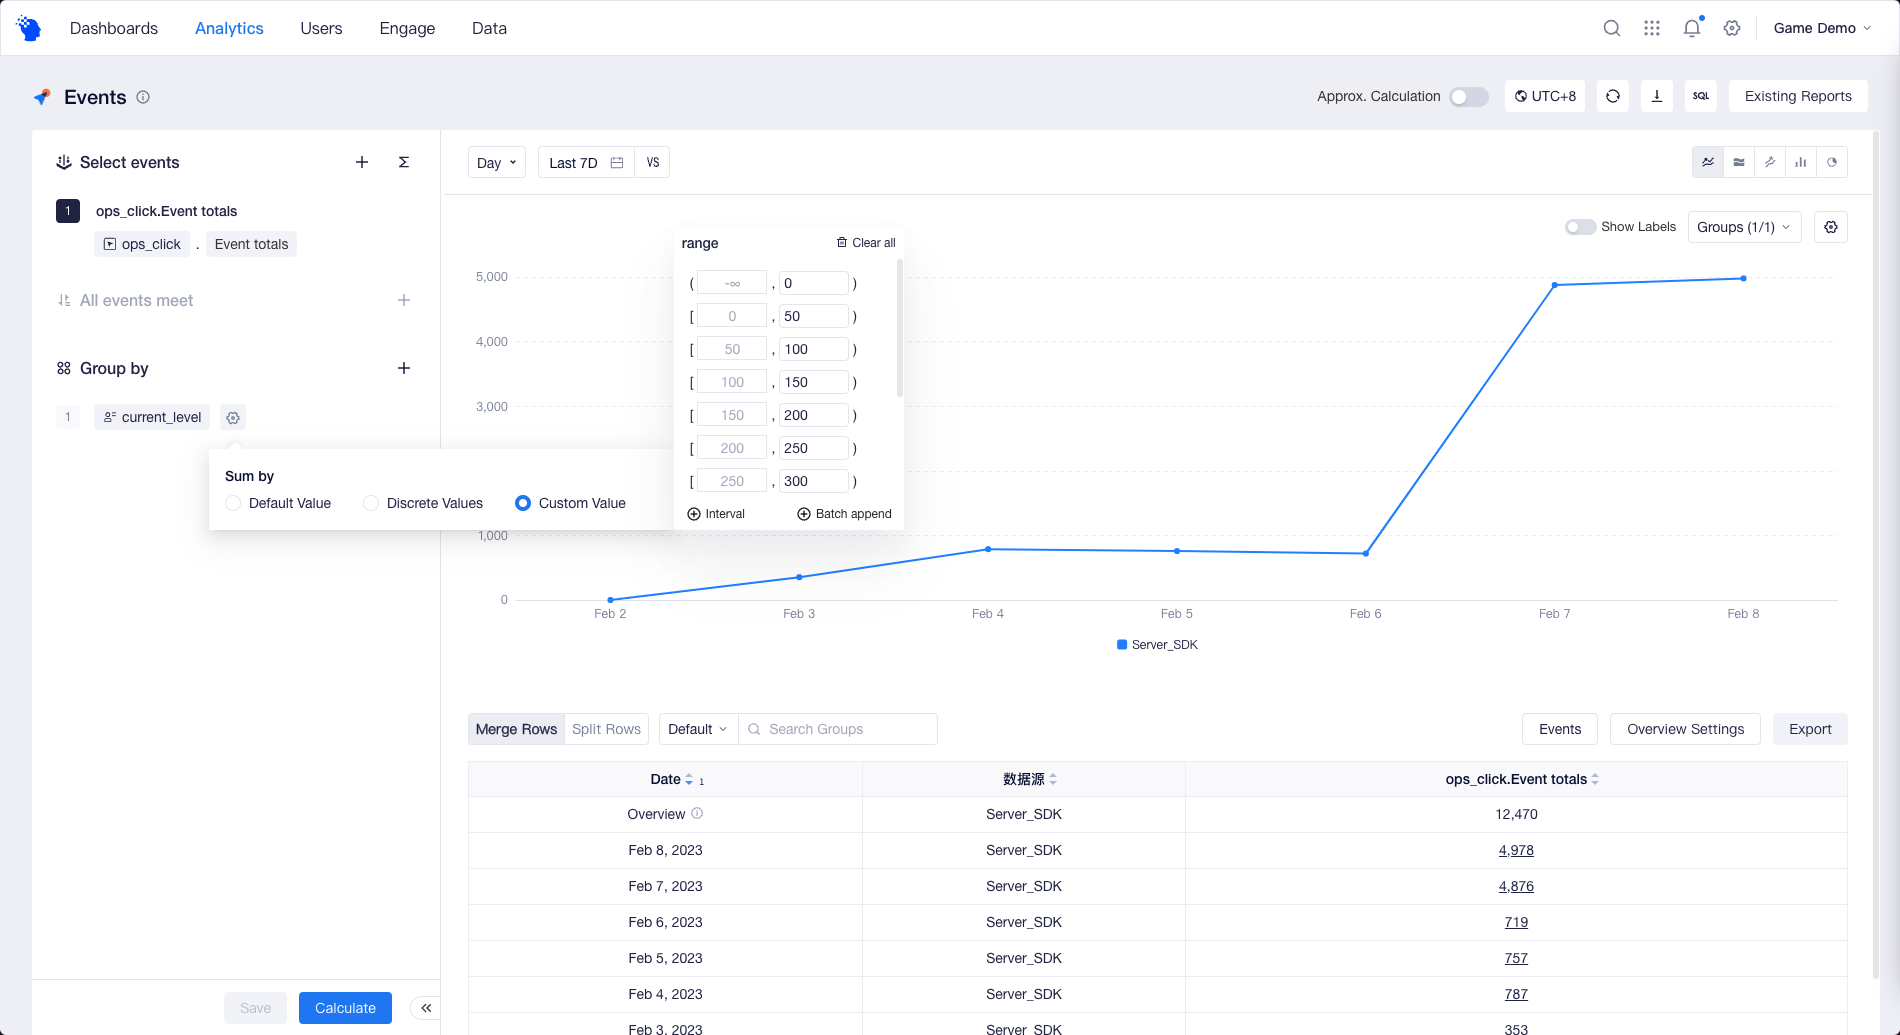
| Custom Value | Divided manually as needed, with all intervals being left-closed and right-open. |
If the grouping property selected by you has clearly defined intervals in business, for example, players of levels 1~12 are newbies, you can use "Custom Value" to divide such intervals. When you do further analysis on the data within a certain interval, you can select "Discrete value" to compare the performance of different subgroup values more easily.
- Date
| Grouping methods | Logic behind calculation |
|---|---|
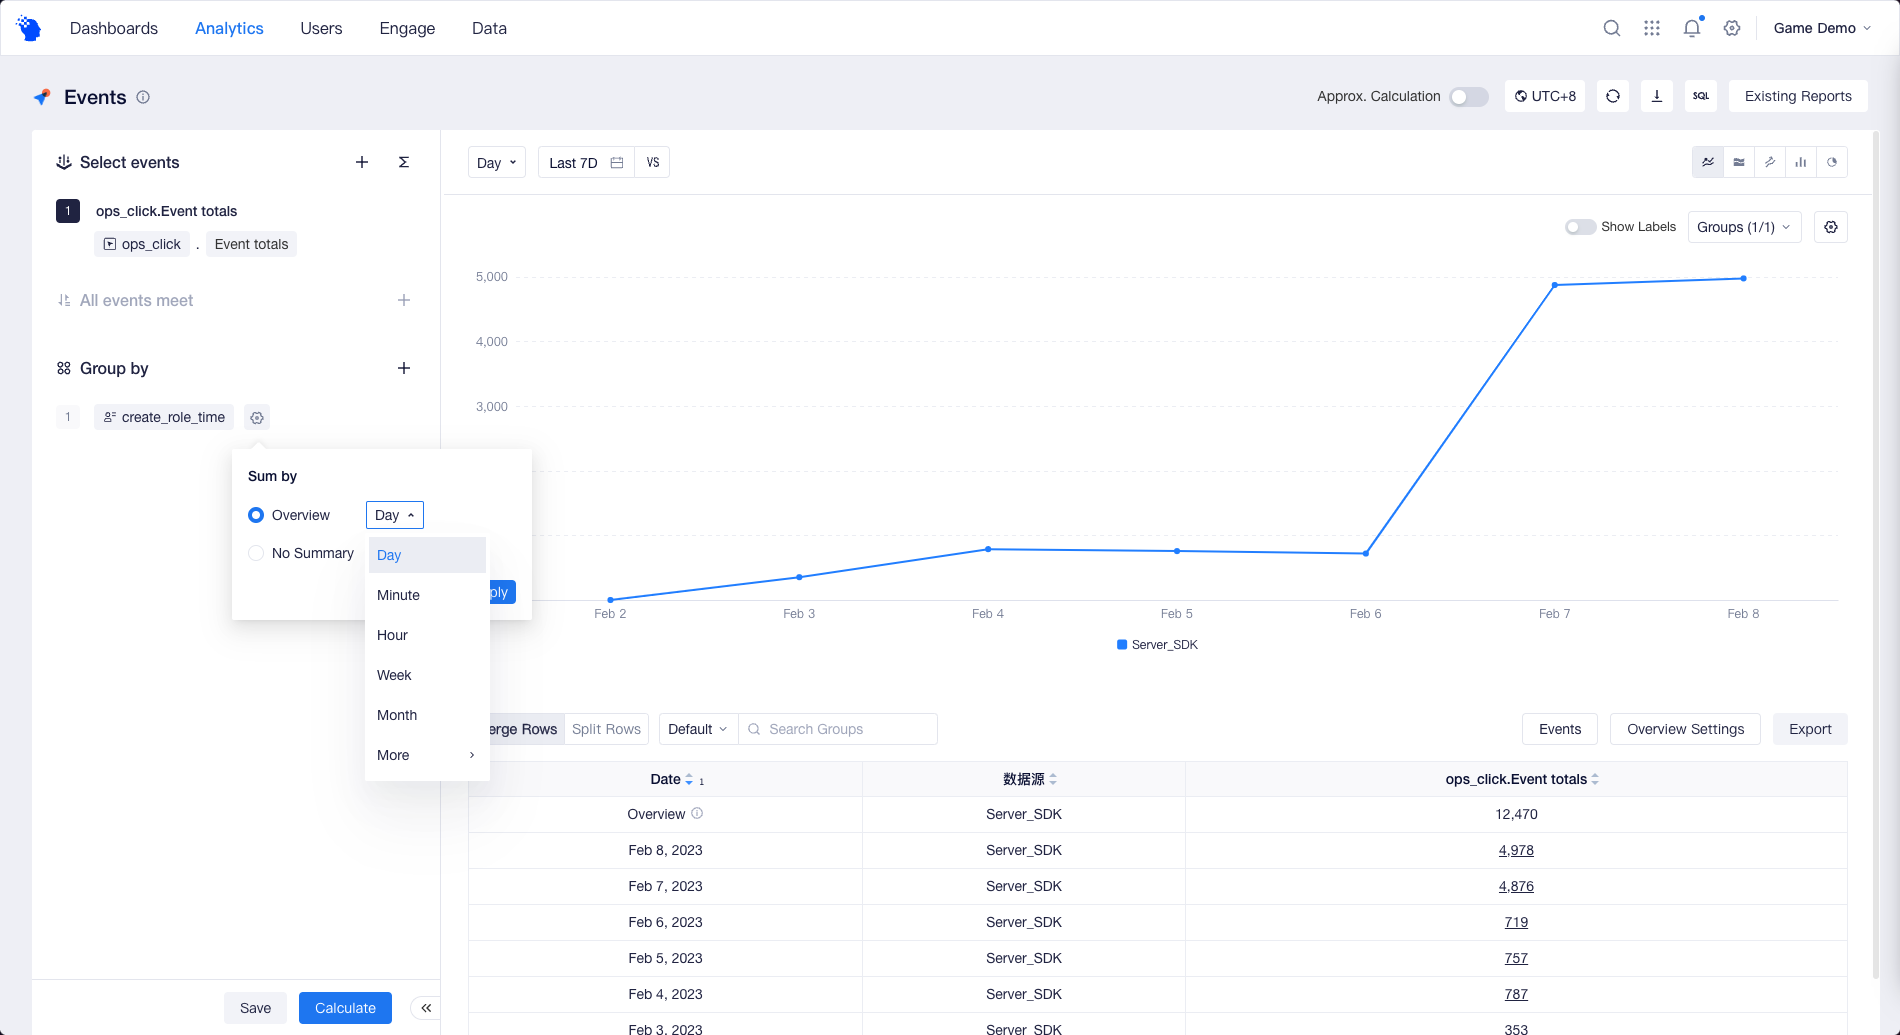
| Overview | Data of the same day, week, month, etc. are automatically aggregated into one group according to the selected granularity for aggregation. |
| No Summary | Data are grouped according to the actual reported time/date. |
As time properties generally have values in seconds or milliseconds, with many values, it is recommended that you choose "Overview" when analyzing; for example, when grouping registration time/date, you can choose to aggregate "Day" to do period cohort analysis; or, if you want to roll out the detailed data directly, you can choose "No Summary".
- List
| Grouping method | Logic behind calculation |
|---|---|
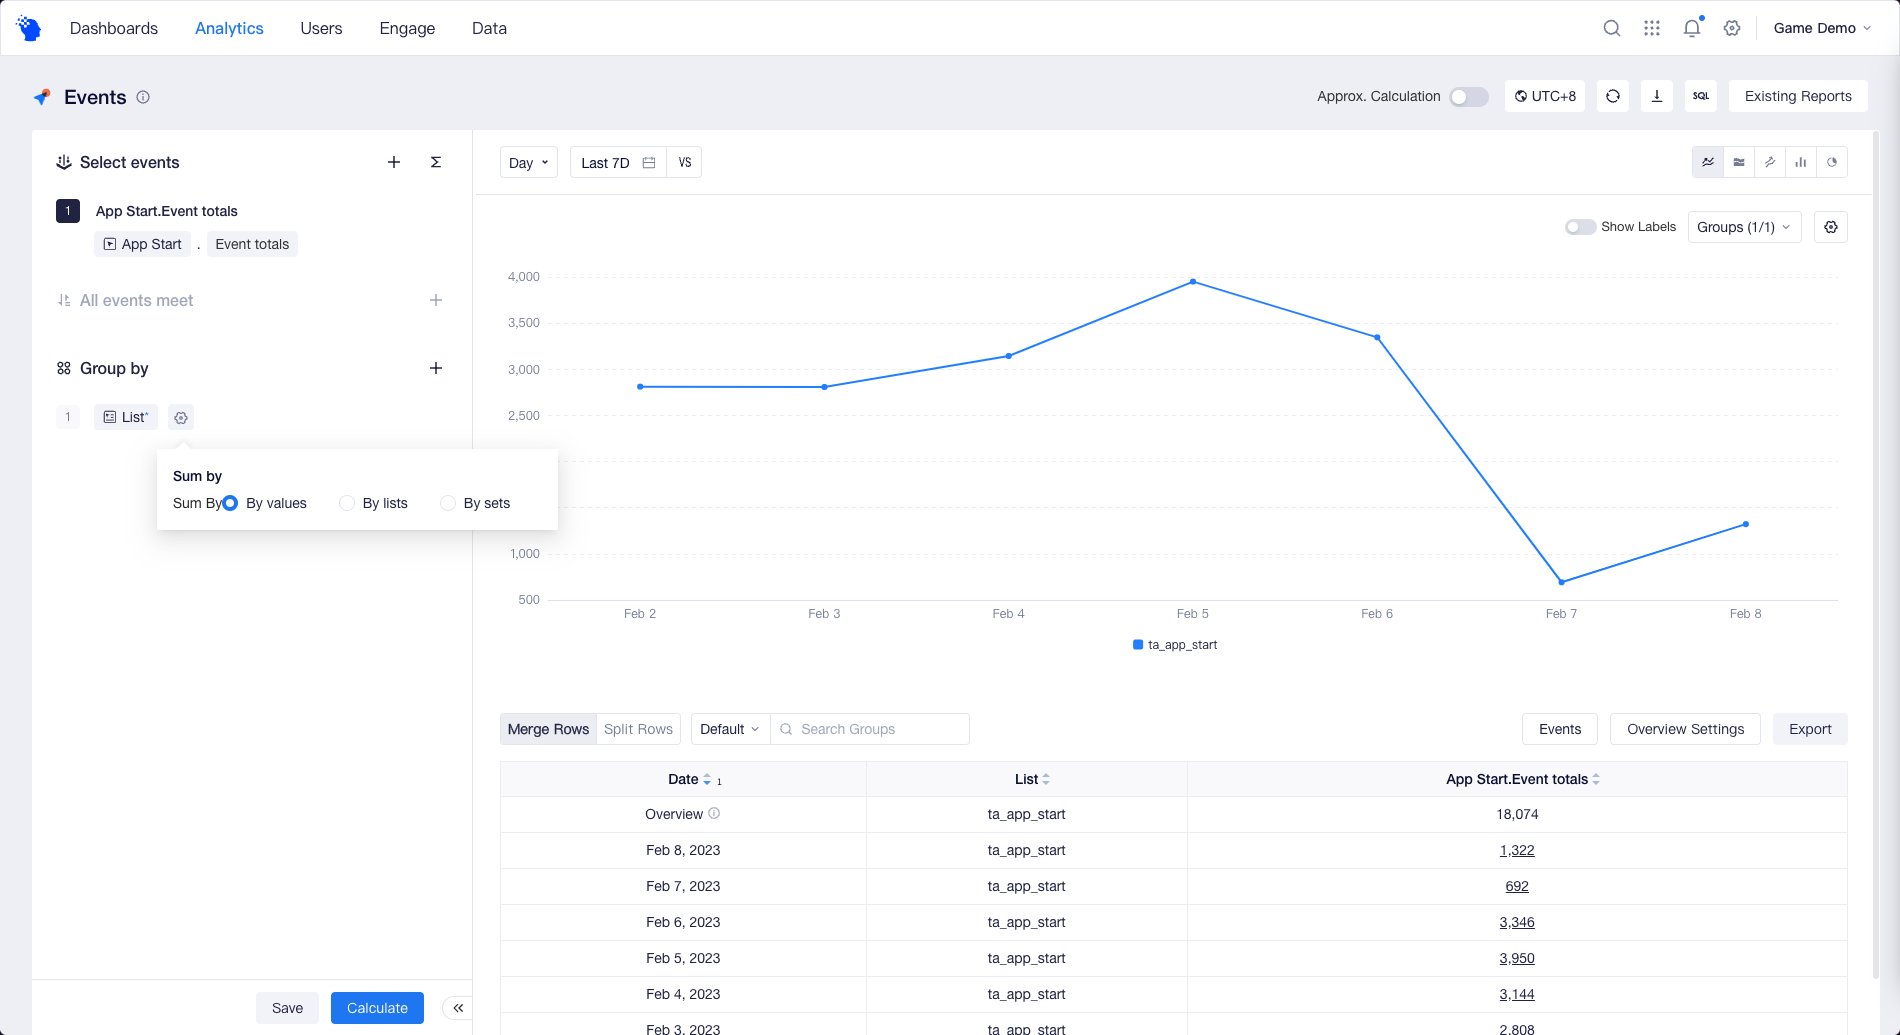
| By values | Lists are divided into elements, and an event will be counted for each element group. |
| By lists | A list is treated as a whole, and the same lists are divided into one group. |
| By sets | Unique elements in each list are reordered to get the sets, and the same sets are divided into a group. |
For games, it is common to record hero IDs included in lineups using a list property. You can choose the appropriate grouping method according to the appropriate grouping method according to the analysis scenario:
- If you want to compare how many times different heroes are sent to combats, you can choose to group "By values"; or
- If you want to compare how many times different lineups (hero combinations) are used, you can choose to group "By lists" or "By sets" depending on whether the repeated appearances of the same hero or the order of the heroes being sent into combat needs to be considered.
Notes
If multiple list properties are used as grouping features, grouping "By values" can be conducted for one of these properties only, unless all other list-type properties are dimension properties of that property.