# Retention Analysis Display Settings
In addition to configuring retention, you can also"Customize charts"to get data presentation more adapted to analytical needs.

# Only show key dates
If you want to analyze 30-day retention, data results spanning from the following day to the 30th day will be displayed by default. However, if you want to pay more attention to data across key time nodes, such as the 2nd, 3rd, 7th and 30th day, you can tick "Only show key dates" on the setting page to filter out data of unselected dates.
At this point, the table will retain columns corresponding to key dates. You can also rapidly compare data performance of different batches of new users across key dates from "Daily Retention".


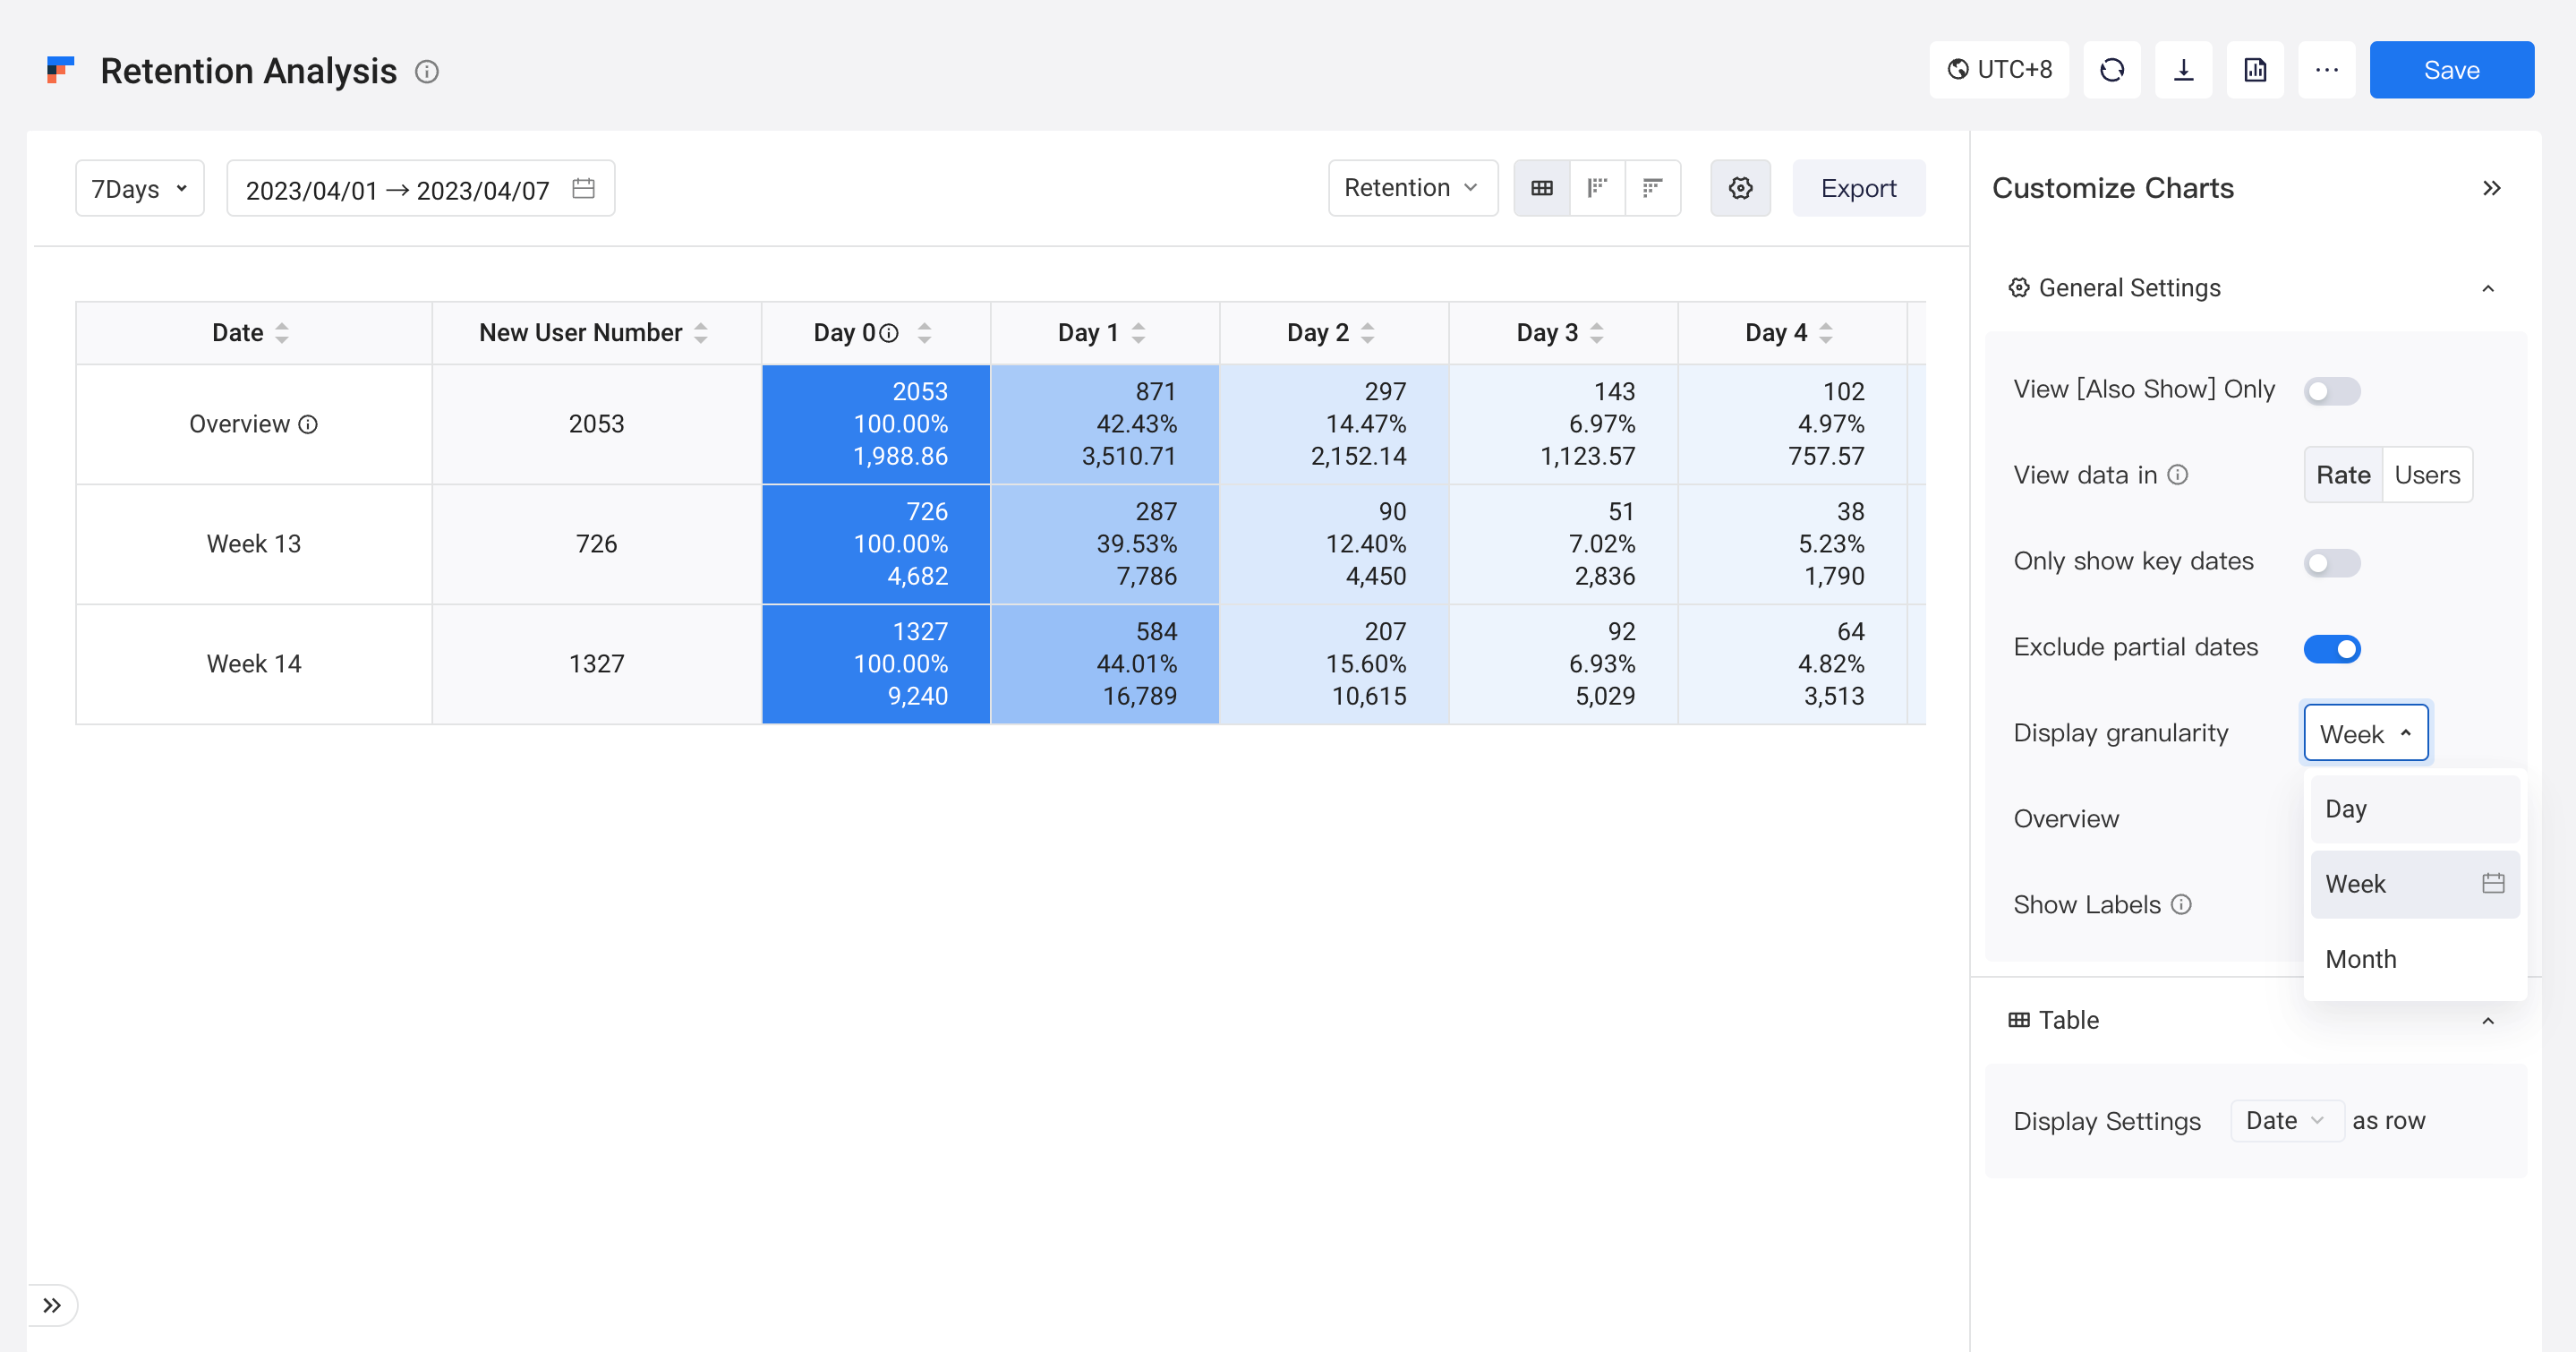
# Adjust "Display granularity"
In actual businesses, there is little volatility in daily retention data. Generally, problematic weeks will be first identified before a drill-down analysis of specific dates. In this case, you may analyze retention by date and then "aggregate it by weeks". You may also aggregated display and rapidly compare the secondary and tertiary retention across different weeks/months.
Different analysis metrics involve different computational logics in aggregated display, which are superficially as follows:
Analysis metric | Computational logic |
|---|---|
| First Event Number | Simple addition of daily data of the current week/month |
| Rentention Number | Simple addition |
| Retention Rate | Weighted average, that is, simple addition of the number of users retained/simple addition of the number of users entailing trigger action |
| Churn Number | Simple addition |
| Churn Rate | Weighted average, that is, simple addition of the number of users churning out/simple addition of the number of users entailing trigger action |
| Metric on Initial date | If the metric is not an equation, the computational logic is simple addition. If the metric is an equation, the computational logic is weighted mean. |
| Another metric | ibid. |
It should be noted that aggregated display is only based on the time range currently selected. Different weeks/months apply when the date of trigger action is selected, and there might be incomplete weeks or months.
For example, if the time period you select for the analysis is January 1 to January 7, with January 1 being a Wednesday. Then when aggregation is conducted by weeks, the period will be divided into two "weeks":
- The week of December 30: including data from January 1 to January 5
- The week of January 6: including data from January 6 to January 7