# Heatmap
Heatmap is specifically designed for Game map type analytical requirements; through it, you can analyze the distribution of player behaviors on the map, and compare the differences of different user groups. Through Heatmap, you can verify whether the player's behaviors under the current map design meets expectations, thereby adjusting subsequent game updates.
With the Heatmap, you can get the answers to the following pain points:
- As a map planner, I want to understand how users move within the map, and whether it aligns with the designed expectations.
- As a numerical planner, I want to understand what the resource acquisition is like for users in different areas of the map.
- As a game operator, I want to compare that do users of different levels take different paths in the game, and do they require different resources? Are there any opportunities for operation?
# Heatmap setting

The setting for Heatmap Analytics should include the following elements:
Heat event: An event used for analysis in the map, supports the use of custom events, see for event filtering.
Calculate (Metrics): The metrics constructed using Heatmap event, serve as the calculation metrics for the heatmap values within the map, which are built in the same way as the other existing analysis models.
Coordinates: The properties linking the heat event and the map coordinates, which can be the event properties (Heatmap event corresponding property) or user properties.
Map file:The target map for Heatmap analysis.
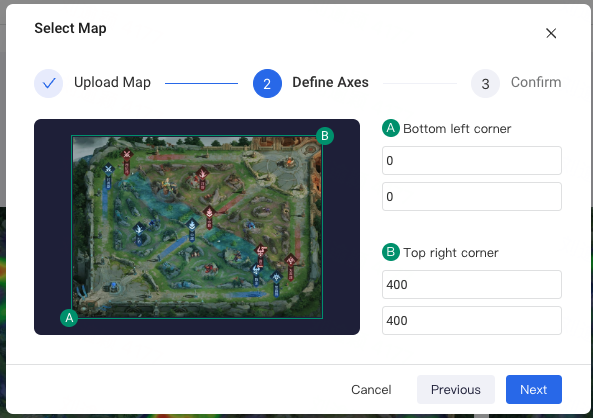
Selecting a map supports two methods: uploading a map file, or selecting a previously used one.
A map file supports jpg, png formats, not exceeding 10Mb.
After the map is uploaded, it is necessary to specify the coordinates of the bottom left and top right corners of the map, in order to align with the Coordinates in the model setting.
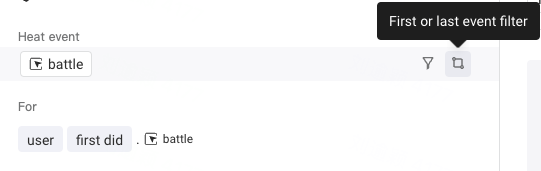
Heat events support a new event processing method: First/ Last events.
- First did, Last did
- Each user's First/Last event within the selected time window
- Max by, Min by
- You need to select an event property, and its type is number or time.
- Within the selected time window, the event with the maximum/minimum value of the selected property.
First/ Last events will process Heat events according to the selected method, retaining only the "First" (last, maximum, minimum) event for each "User" and use this event to generate the corresponding Metrics.
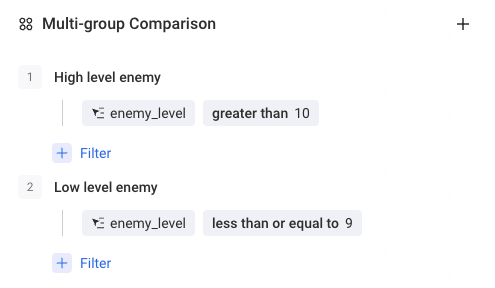
If you want to compare the distribution of Metrics across different user groups on a map, you can achieve this by adding Comparison group.
- There must be at least two groups to be compared.
- Different groups are formed by adding filter conditions.
- When the filter condition is empty, the group represents all users.
- If you want to compare heatmaps in different time intervals, you can achieve this by firltering "Event Time".
# View the Calculation Results

After configuring all the settings, click the "Calculate" button, and you will obtain the heatmap calculation results on the right side, and generate the map rendering results:
How the result is calculated: After processing and filtering the Heat event, according to the rules of Metrics and the selected x-axis and y-axis coordinate properties, aggregate metrics into the result value for each coordinate position, and return the result value.
Heatmap rendering: The heatmap component aggregates result values according to the relationship between coordinate positions and assigns colors based on the current radius.
Cursor position value: Corresponds to the calculation result of the metrics for the current axis.

Heatmap bottom right corner, provides Visualization setting tools
You can zoom in and zoom out and drag map areas to view key regions.
Color schemes can be modified, and currently, there are 4 color schemes available for selection.
Adjustable transparency and radius, to achieve the desired presentation effect of the heatmap.

In the case of multiple comparison groups, the top right corner of the Visualization area can be checked for "sync zoom":
- When checked: All groups sync to zoom in and out, and also sync to drag the map display area.
- When not checked: Each group can be operated independently.