# Instructions on Operators of Analysis Model
When using models to carry out analyses, you can adjust some operators to obtain data results more adapted to your needs. This chapter present an explanation of the logic behind some of the operators.

# Approx. Calculation
When using computational methods like unique user, total per user, user average and distinct count, the analysis model is defaulted as conducting "accurate computation". As distinct counting computation consumes a large amount of computational resources, you can enable "Approx. Calculation"(1) to improve query efficiency. TE will replace the distinct function with approx_distinct to significantly reduce overhead in computational resources. Compared with accurate computation, approximation incurs about a 4‰ error.
# Manual refresh
To reduce resource overhead, the analysis model will keep data results of computation in cache for 10 minutes. If no changes occur to the query conditions, then clicking the "Calculate" button will yield the same data results within 10 minutes.
If the time range you select includes "Today", the cached data results may be inaccurate. In this case, you can click "Manual Refresh"(2) to obtain the newest data results.
# Download data
To improve rendering performance and optimize data viewing experience, TE displays data results of the first 1000 groups by default.
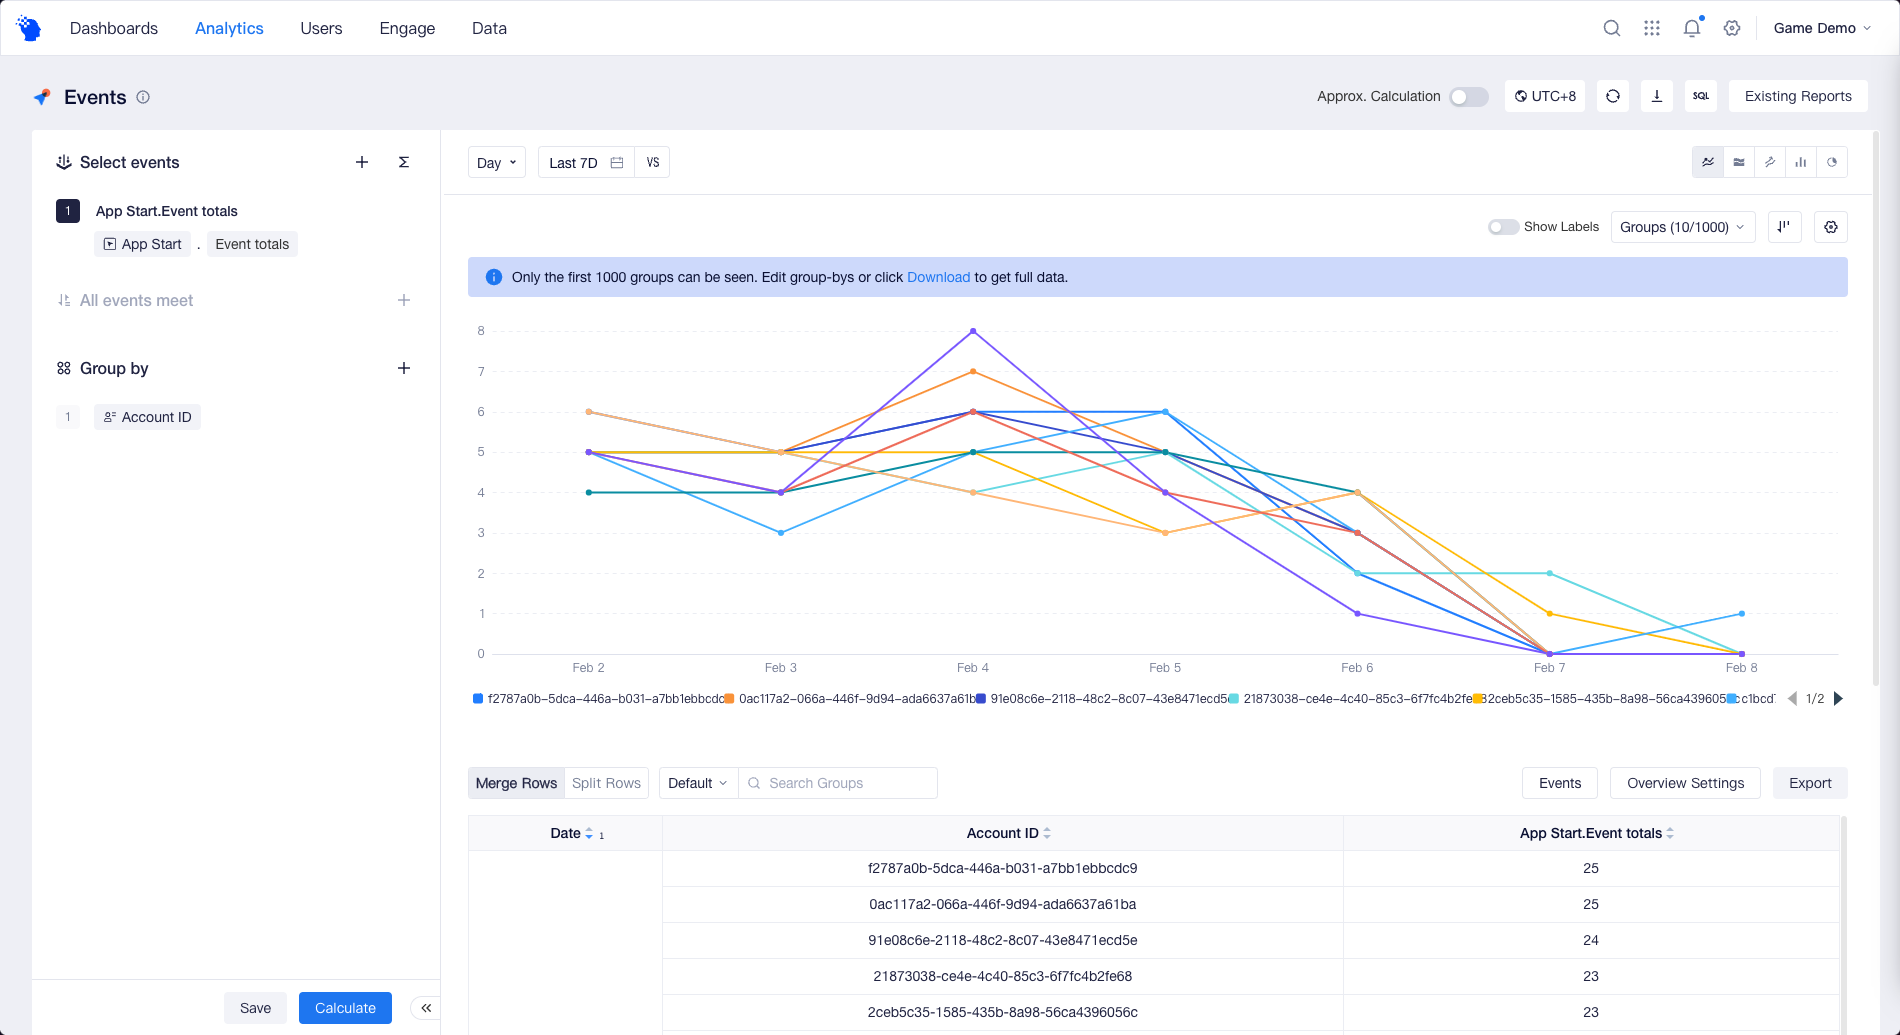
If the number of groups exceeds 1,000, you may see a reminder from the Analysis model interface. In this case, clicking "Export" will only lead to exportation of the CSV file of the data displayed on the interface, that is, the data of the first 1,000 groups. If you want to analyze full data, you can use "Download data"(3) to download the CSV file based on the full data.
# Sort groups
If you have set grouping or event decomposition, you can change the sort mode for different group values in chart(4). Sorting groups only applies to charts. If you want to adjust the sort modes of tables, you can click the header of a table to sort it.
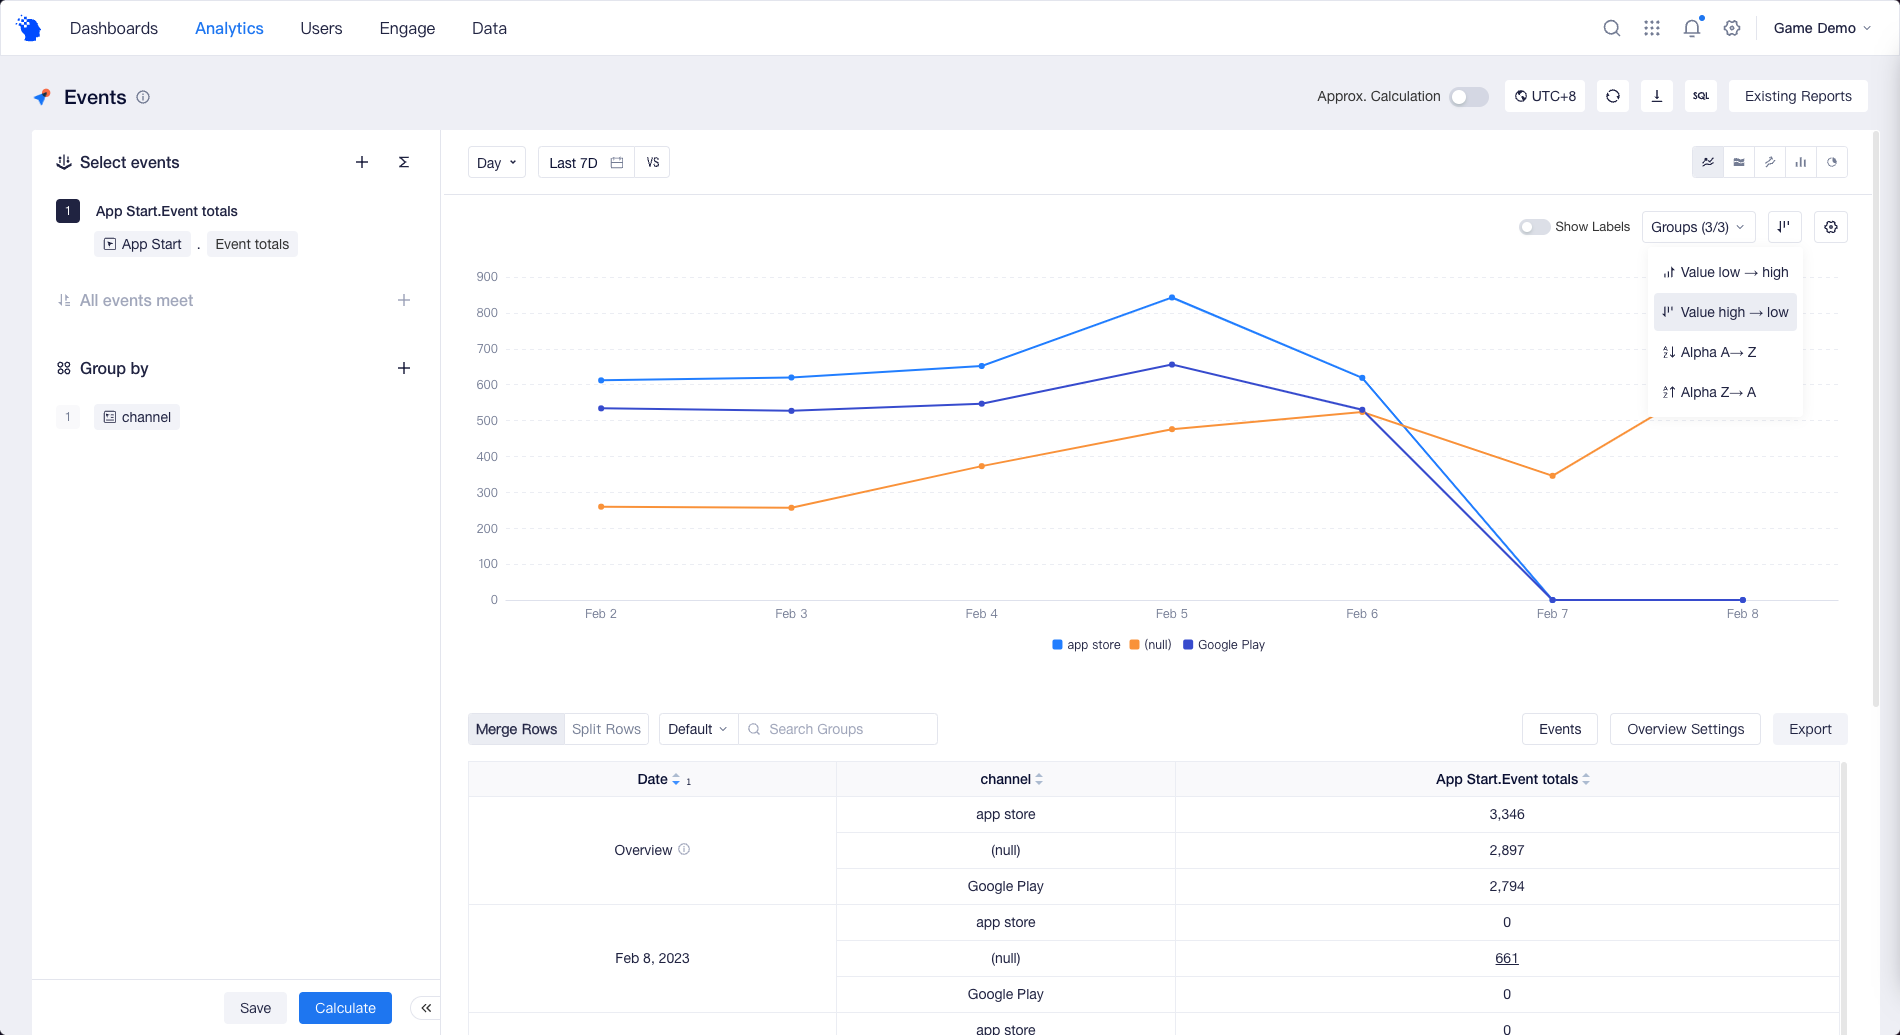
- Value low → high: Ascending by the value of the first metric
- Value high → low: Descending order by the value of the first metric, and groups with good data performances are arranged on top
- Alpha A → Z: Ascending order by the dictionary sequence (letter sequence) of names, and if the names are numerical, it is arranged from small to large numbers
- Alpha Z → A: Descending order by the dictionary sequence of names, and if the names are numerical, it is arranged from large to small numbers
Notes
To improve rendering performance and optimize data viewing experience, TE displays data results of the first 1000 group values by default. The sort mode by groups only applies to this batch of group values instead of all group values. If you want to display more group values on the interface, please contact your client manager to adjust the upper limit of the display.