# Filebeat + Logstash 사용 가이드
이 섹션에서는 주로 데이터 전송 도구인 Filebeat와 Logstash의 사용 방법에 대해 설명합니다. 도킹을 시작하기 전에, 데이터 규칙, TE의 데이터 형식 및 데이터 규칙에 익숙해진 후 이 가이드를 읽고 도킹해야 합니다. LogBus로 업로드하는 데이터는 TE의 데이터 형식을 따라야 합니다.
참고: LogsTEsh의 처리량이 낮으므로 대량의 히스토리 데이터를 가져올 경우 DataX 엔진 또는 Logbus 도구를 사용하는 것이 좋습니다.
이 섹션에서는 주로 데이터 전송 툴 Filebeat+Logstash의 사용 방법에 대해 설명합니다.
# 1. Filebeat + Logstash 프로필
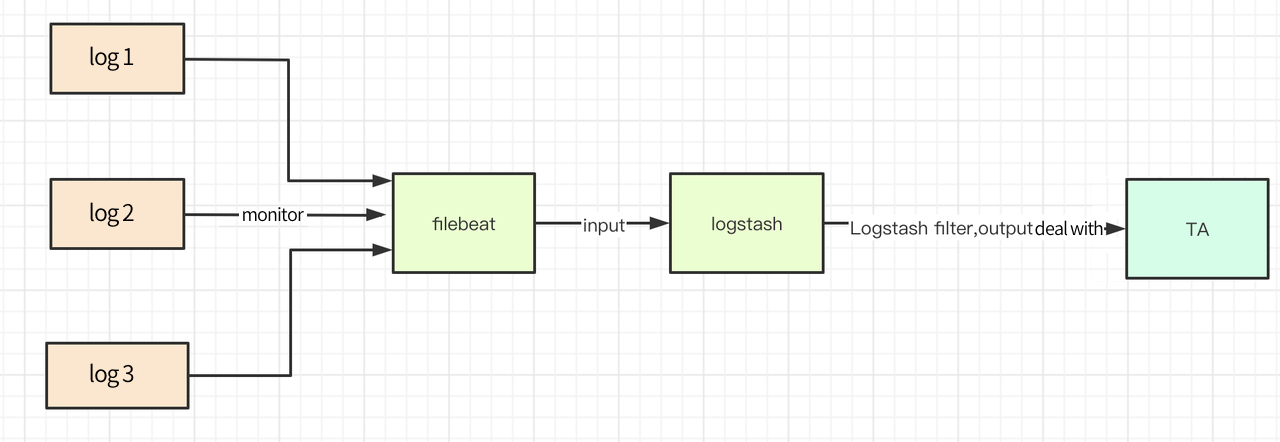
Filebeat + Logstash 도구는 주로 로그 데이터를 실시간으로 TE 백엔드로 가져오며, 서버 로그 디렉토리 아래의 텍스트 스트림을 모니터링하고, 디렉토리 아래의 임의의 로그 텍스트에 새로운 데이터가 생성될 때 실시간으로 TE 백엔드로 전송하는 데 사용됩니다. Logstash는 오픈 소스 서버 측 데이터 처리 파이프라인으로, 여러 소스에서 동시에 데이터를 수집하고 변환하여 선호하는 '저장소'로 전송할 수 있습니다. Logstash 공식 웹사이트 (opens new window)를 참조하십시오. Filebeat는 로그 디렉토리나 특정 로그 파일을 모니터링하는 로컬 문서의 로그 데이터 수집기입니다. Filebeat는 로그와 문서를 전송하고 집계하는 경량 방법을 제공합니다. Filebeat 공식 웹사이트 (opens new window)를 참조하십시오.
아래는 Filebeat + Logstash 기반의 수집 플로우 차트입니다.
# 2. Filebeat + Logstash 다운로드 및 설치
주의: Logstash 6.x 이상 버전에서는 서버에 JDK 환경이 필요합니다.
# 2.2 Logstash 다운로드 및 설치
Logstash 공식 설치 문서 (opens new window)를 참조하십시오.
# 2.3 logstash-output-thinkingdata 플러그인
최신 버전: 1.0.0
업데이트 시간: 2020-06-09
# 2.3.1 logstash-output-thinkingdata 플러그인의 설치와 삭제
이 플러그인은 데이터가 json 데이터인지를 확인하고, 패키지 데이터를 TE로 전송합니다.
logstash 디렉토리에서 실행:
bin/logstash-plugin install logstash-output-thinkingdata
설치하는 데 시간이 걸릴 수 있지만, 설치가 성공한 후에 실행을 기다립니다.
bin/logstaEsh-plugin list
리스트에 logstash-output-thinkingdata가 있으면, 설치가 성공한 것입니다.
기타 명령은 다음과 같습니다.
플러그인을 업그레이드할 수 있습니다:
bin/logstash-plugin update logstash-output-thinkingdata
플러그인을 제거할 수 있습니다:
bin/logstash-plugin uninstall logstash-output-thinkingdata
# 2.3.2 변경 로그
# v1.0.0 2020/06/09
- Logstash에서 event로 전달된 메시지를 TE로 전송
# 2.4 Filebeat 다운로드 및 설치
Filebeat 공식 설치 문서 (opens new window)를 참조하여, 다운로드 방법을 선택하세요.
# 3. Filebeat+Logstash 사용 설명서
# 3.1 데이터 준비
- 먼저 전송할 데이터를 ETL하여 TE의 데이터 형식에 맞게 하고, 로컬에 쓰거나 Kafka 클러스터로 전송합니다. Java 등 서비스 측 SDK의 Kafka나 로컬 텍스트를 쓰는 consumer를 사용하는 경우, 데이터는 이미 올바른 형식이므로 변환할 필요가 없습니다.
- 업로드된 데이터의 디렉토리 또는 Kafka의 주소와 topic을 특정하고, Filebeat + Logstash의 구성을 설정합니다. 그러면 Filebeat + Logstash는 디렉토리 내의 변경을 모니터링합니다(새로운 또는 기존 텍스트를 모니터링)하거나 Kafka의 데이터를 구독합니다.
- 모니터링 디렉토리에 저장되고 업로드된 데이터 로그의 이름을 직접 변경하지 마십시오. 이름 변경 로그는 새 텍스트에 해당하며, Filebeat는 이러한 텍스트를 다시 업로드하여 데이터 중복을 일으킬 수 있습니다.
# 3.2 Logstash 설정
# 3.2.1 Logstash 파이프라인 구성
Logstash는 여러 파이프라인을 동시에 실행을 지원하며, 각 파이프라인 간에 서로 영향을 주지 않으며, 각각 독립적인 입출력 구성을 가지고 있습니다. 파이프라인 구성 텍스트는 config/pipelines.yml에 있습니다. 현재 Logstash를 사용하여 다른 로그 수집 작업을 수행하고 있다면, 원래 Logstash에 Pipeline을 추가하여 TE의 로그 데이터를 수집하고 TE로 전송하십시오.
새로운 파이프라인 구성은 다음과 같습니다.
#  Piping Configuration for Thinkingdata
- pipeline.id: thinkingdata-output
  #  If the core number of upload user attributes is set to 1, if only the upload event attributes can be set to be less than or equal to the number of native CPUs
  pipeline.workers: 1
  # Buffer queue type used
  queue.type: persisted
  # Using different input and output configurations
  path.config: "/home/elk/conf/ta_output.conf"
더 많은 파이프라인 설치 공식 사이트:Pipeline (opens new window)
# 3.2.2 Logstash 입력 출력 구성
TE_output.conf 참고 예:
주의: 여기에서 시나리오는 SDK에 의해 생성된 데이터 텍스트, Logstash의 출력 입력 구성입니다.
# Use beats as input
input {
    beats {
        port => "5044"
    }
}
# If it is not the generation of service-side SDK or data in TA format that requires filter to filter metadata, it is suggested here that Ruby plug-in filter be used. There is a case in Module 4.
#filter {
#   if "log4j" in [tags] {
#    ruby {
#      path => "/home/elk/conf/rb/log4j_filter.rb"
#    }
#  }
#}
# Use thinkingdata as output
output{
   thinkingdata {
        url => "http://Data Acquisition Address/logbus"
           appid =>"Your AppID"
    }
}
thinkingdaTE 파라미터 설명:
파라미터 이름 | 유형 | 필요 여부 | 기본값 | 설명 |
|---|---|---|---|---|
url | string | true | No | TE data receiving address |
appid | string | true | No | Project APPID |
flush_interval_sec | number | false | 2 | Trigger flush interval in seconds |
flush_batch_size | number | false | 500 | Json data that triggers flush, unit: bar |
compress | number | false | 1 | Compressed data, 0 means no compressed data, which can be set in the intranet; 1 means gzip compression, the default gzip compression |
uuid | boolean | false | false | Whether to turn on the UUID switch for possible deduplicate of network fluctuations at short intervals |
is_filebeat_status_record | boolean | false | true | Whether to turn on Filebeat to monitor log status, such as offset, file name, etc |
# 3.2.3 Logstash 실행 구성
Logstash는 기본적으로 config/logstash.yml 실행 구성을 사용합니다.
pipeline.workers: 1
queue.type: persisted
queue.drain: true
권장 사항
- user_set 사용자 속성을 보고할 때는 구성 pipeline.workers의 값을 1로 변경하십시오. workers의 값이 1보다 클 경우, 데이터를 처리하는 순서가 변경됩니다. track 이벤트는 1보다 크게 설정할 수 있습니다.
- 프로그램의 예기치 않은 종료로 데이터 전송이 손실되지 않도록 하려면 queue.type: persisted를 설정하십시오. 이는 Logstash가 사용하는 버퍼 큐의 유형을 나타내며, Logstash를 재시작한 후에도 버퍼 큐 내의 데이터를 계속해서 전송하도록 구성합니다.
(더 많은 데이터 지속성 관련 사항은 공식 사이트를 참조하십시오. persistent-queues (opens new window))
- 설정 queue.drain의 값을 true로 설정하면, Logstash는 정상적으로 종료하기 전에 모든 버퍼 큐 내의 모든 데이터를 전송합니다.
자세한 내용은 공식 사이트를 참조하십시오. logstash.yml (opens new window)
# 3.2.4 Logstash의 시작
Logstash 설치 디렉토리 아래에서
- 파이프라인 구성 및 실행 구성으로 config/pipelines.yml을 사용하여 직접 시작합니다.
bin/logstash
- 지정된 ta_output.conf는, 실행 구성으로 config/logstash.yml을 사용하여, 입력 및 출력 구성 책으로 시작합니다.
bin/logstash -f /youpath/ta_output.conf
- 백그라운드 시작
nohup bin/logstash -f /youpath/ta_output.conf > /dev/null 2>&1 &
더 많은 시작 방법은, Logstash 공식 시작 문서 (opens new window)를 참조하십시오.
# 3.3 Filebeat의 구성
# 3.3.1 Filebeat의 실행 구성
Filebeat는 백엔드 SDK 로그 북을 읽습니다. Filebeat의 기본 설정 텍스트는 다음과 같습니다 filebeat.yml. config/filebeat.yml 참조 구성은 다음과 같습니다.
#======================= Filebeat inputs =========================
filebeat.shutdown_timeout: 5s
filebeat.inputs:
- type: log
  enabled: true
  paths:
     - /var/log/log.*
    #- c:\programdata\elasticsearch\logs\*
#------------------------- Logstash output ----------------------------
output.logstash:
 # You can fill in either a single server process or a Logstash process on multiple servers
  hosts: ["ip1:5044","ip2:5044"]
  loadbalance: false
- shutdown_timeout (opens new window): Filebeat는, 닫기 전에, 퍼블리셔가 이벤트의 전송을 완료할 때까지 기다립니다.
- paths: 모니터링할 로그를 지정합니다. 현재, Go 언어의 glob 함수에 따라 처리됩니다.
- hosts: 전송 주소는 여러 Logstash hosts이며, loadbalance가 false인 경우는 프라이머리 기능과 같으며, true는 로드 밸런싱을 나타냅니다.
- loadbalance:
user_set에서 사용자 속성을 전송하는 경우 loadbalance: true를 설정하지 마십시오.
track이벤트만 가져오는 경우, 여러 Logstash 프로세스를 설정하고, loadbalance: true를 설정할 수 있습니다.
Filebeat의 기본 설정은 loadbalance: false입니다.
Filebeat 자료는 Filebeat 공식 문서 (opens new window)에서 확인할 수 있습니다.
# 3.3.2 Filebeat의 시작
filebeat 시작 후, 관련된 출력 정보를 표시합니다:
./filebeat -e -c filebeat.yml
백그라운드 시작
nohup ./filebeat -c filebeat.yml > /dev/null 2>&1 &
# 4. 케이스 배치 참고
# 4.1 filebeat는 다른 로그 포맷의 데이터 구성을 모니터링합니다.
개별 Filebeat의 filebeat.xml은 다음과 같이 설정할 수 있으며, 실행 메모리는 약 10 MB이며, 여러 filebeat 프로세스에서 다양한 로그 형식을 모니터링할 수도 있습니다. 자세한 내용은 공식 사이트를 참조하십시오.
#=========================== Filebeat inputs =============================

filebeat.inputs:
- type: log
  enabled: true
  #Monitoring Catalog
  paths:
     - /home/elk/sdk/*/log.*
  #Tag the data and match it with Logstash without filter processing
  tags: ["sdklog"]
 #Data split by special characters
- type: log
  enable: true
  paths: /home/txt/split.*
  #Tags the data, Logstash matches, filter processing is required
  tags: ["split"]
 # log4j Received data
- type: log
  enable: true
  paths: /home/web/logs/*.log
  # Filter processing required
  tags: ["log4j"]
   # log4j Received data
 # nginx Log data
- type: log
  enable: true
  paths: /home/web/logs/*.log
  tags: ["nginx"]
# 4.2 Logstash 구성
Logstash의 구성 책이 잘못되었는지 확인하십시오.
bin/logstash -f /home/elk/ta_output.conf --config.test_and_exit
주의:다음 스크립트는 모두 ruby 플러그인이 ruby 구문에 기반하여 작성되었으므로, java에 익숙한 경우는 logbus 디렉토리 아래의 커스텀 파서입니다.
# 4.2.1 서비스 측 SDK 로그
ta_output.conf는 다음과 같이 설정할 수 있습니다.
input {
    beats {
        port => "5044"
    }
}
# Use thinkingdata as output
output{
   thinkingdata {
        url => "url"
        appid =>"appid"
        # compress => 0
        # uuid => true
    }
}
# 4.2.2 log4j 로그
log4j 형식은 다음과 같이 설정할 수 있습니다.
 //Log format
 //[%d{yyyy-MM-dd HH:mm:ss.SSS}] The log matches the input time of TA, or it can be yyyy-MM-dd HH:mm:ss
//[%level{length=5}]    로그 레벨,debug、info、warn、error
 //[%thread-%tid]    Current thread information
 //[%logger] Current log information belongs to the full path of the class
 //[%X{hostName}]    Current Node Host Name. Requires definition via MDC
 //[%X{ip}]  Current node ip. Requires definition via MDC.
 //[%X{userId}]  Unique ID of user login, account_can be set Id, which can also be set to other values, account_is required in TA ID and distinct_ ID cannot be empty at the same time, you can set other properties to see the business settings. Requires definition via MDC.
//[%X{applicationName}] 현재 애플리케이션 명입니다. MDC를 통해 커스텀해야 합니다.
//[%F,%L,%C,%M] %F:현재 로그 정보가 속한 파일(클래스) 이름,% l: 해당 파일 내 로그 정보의 줄 번호,% C: 현재 로그가 속한 파일의 전체 클래스 이름,% m: 현재 로그가 속한 메소드 이름
 //[%m]  Log details
 //%ex   Abnormal information
 //%n    wrap
 <property name="patternLayout">[%d{yyyy-MM-dd HH:mm:ss.SSS}] [%level{length=5}] [%thread-%tid] [%logger] [%X{hostName}] [%X{ip}] [%X{userId}] [%X{applicationName}] [%F,%L,%C,%M] [%m] ## '%ex'%n
</property>
ta_output.conf 구성
input {
    beats {
        port => "5044"
    }
}
filter {
if "log4j" in [tags]{
    #Other filter data processing can also be performed
   ruby {
     path => "/home/conf/log4j.rb"
    }
 }
}
# Use thinkingdata as output
output{
  thinkingdata {
        url => "url"
        appid =>"appid"
    }
}
/home/conf/log4j.rb 스크립트는 다음과 같습니다.
# This is where the correct data format is regularized. If the error log is recommended to be placed in a separate file, the error log is too long without analyzing the scenario and crosses
def filter(event)
_message = event.get('message') #message는 당신이 업로드한 각 로그입니다
begin
  #This is where the correct data format is regularized. If the error log is recommended to be placed in a separate file, the error log is too long without analyzing the scenario and crosses
  #The data here is in a format similar to this _message ="[2020-06-08 23:19:56.003] [INFO] [main-1] [cn.thinkingdata] [x] [123.123.123.123] [x] [x] [StartupInfoLogger.java,50,o)] ## ''"
 mess = /\[(.*?)\] \[(.*?)\] \[(.*?)\] \[(.*?)\] \[(.*?)\] \[(.*?)\] \[(.*?)\] \[(.*?)\] \[(.*?)\] ## '(.*?)'/.match(_message)
time = mess[1]
level = mess[2]
thread = mess[3]
class_name_all = mess[4]
event_name = mess[5]
ip = mess[6]
account_id = mess[7]
application_name = mess[8]
other_mess = mess[9]
exp = mess[10]

if event_name.empty? || account_id.empty?
  return []
end

properties = {
      'level' => level,
      'thread' => thread,
      'application_name' => application_name,
      'class_name_all' => class_name_all,
      'other_mess' => other_mess,
      'exp' => exp
}

  data = {
      '#ip' => ip,
      '#time' => time,
      '#account_id'=>account_id,
      '#event_name'=>event_name,   #If type is track, it can be used if #event_is not available Name does not need to be uploaded
      '#type' =>'track',           #It can be retrieved in a file, if any, to confirm whether the reported data is a user or event attribute
      'properties' => properties
  }

  event.set('message',data.to_json)
  return [event]
  rescue
      # puts _message
      puts "Data does not conform to regular format"
      return [] #Do not report
  end
end
# 4.2.3 Nginx 로그
먼저 Nginx 로그의 포맷을 정의하고, json 형식으로 설정하십시오.
input {
    beats {
        port => "5044"
    }
}
filter {
#No tags need to be judged if the data is in the same format
if "nginx" in [tags]{
   ruby {
     path => "/home/conf/nginx.rb"
    }
 }
}
# Use thinkingdata as output
output{
  thinkingdata {
        url => "url"
        appid =>"appid"
    }
}
/home/conf/nginx.rb 스크립트는 다음과 같습니다.
  require 'date'
   def filter(event)
      #Extract similar log information
      # {"accessip_list":"124.207.82.22","client_ip":"123.207.82.22","http_host":"203.195.163.239","@timestamp":"2020-06-03T19:47:42+08:00","method":"GET","url":"/urlpath","status":"304","http_referer":"-","body_bytes_sent":"0","request_time":"0.000","user_agent":"s","total_bytes_sent":"180","server_ip":"10.104.137.230"}
      logdata= event.get('message')
       #Parse the log level and request time and save it to the event object
         #Parsing JSON format log
    #Get log content
    #Convert to JSON Object
    logInfoJson=JSON.parse logdata
    time = DateTime.parse(logInfoJson['@timestamp']).to_time.localtime.strftime('%Y-%m-%d %H:%M:%S')
    url = logInfoJson['url']
    account_id = logInfoJson['user_agent']
    #event_name
    #Account_ ID or #distinct_ Skip reporting when ID is null at the same time
    if url.empty? || url == "/" || account_id.empty?
      return []
    end
    properties = {
      "accessip_list" => logInfoJson['accessip_list'],
      "http_host"=>logInfoJson['http_host'],
      "method" => logInfoJson['method'],
      "url"=>logInfoJson['url'],
      "status" => logInfoJson['status'].to_i,
      "http_referer" => logInfoJson['http_referer'],
      "body_bytes_sent" =>logInfoJson['body_bytes_sent'],
      "request_time" =>  logInfoJson['request_time'],
      "total_bytes_sent" => logInfoJson['total_bytes_sent'],
      "server_ip" => logInfoJson['server_ip'],
    }
  data = {
      '#ip' => logInfoJson['client_ip'],#Can be null
      '#time' => time,   #can not be null
'#account_id'=>account_id, # account_id 와 distinct_id 는 동시에 not null이면 안 됩니다
      '#event_name'=>url,   #If type is track, it can be used if #event_is not available Name does not need to be uploaded
      '#type' =>'track',           #It can be retrieved in a file, if any, to confirm whether the reported data is a user or event attribute
      'properties' => properties
  }
   event.set('message',data.to_json)
   return [event]

  end
# 4.2.4 기타 로그
ta_output.conf 구성은 다음과 같이 설정할 수 있습니다.
input {
    beats {
        port => "5044"
    }
}
filter {
if "other" in [tags]{
    #Other filter data processing is possible
   ruby {
     path => "/home/conf/outher.rb"
    }
 }
}
# Use thinkingdata as output
output{
  thinkingdata {
        url => "url"
        appid =>"appid"
    }
}
/home/conf/other.rb 스크립트는 다음과 같습니다.
# def register(params)
#   # The parameters obtained here via params are via script_in the logstash file Params incoming
#   #@message = params["xx"]
# end
def filter(event)
  #Processing business data here, without a series of processing such as grok, get metadata directly from message for processing
  begin
  _message = event.get('message') #message is every log you upload
  #The logs processed here are data similar to the following
  #2020-06-01 22:20:11.222,123455,123.123.123.123,login,nihaoaaaaa,400
  time,account_id,ip,event_name,msg,intdata=_message.split(/,/)
  #Or by regularly matching or JSON data, the ruby grammar parses JSON and data can be processed and reported here
  #mess = /regular/.match(_message)
  #time = mess[1]
  #level = mess[2]
  #thread = mess[3]
  #class_name_all = mess[4]
  #event_name = mess[5]
  #account_id = mess[6]
  #api = mess[7]

  properties = {
      'msg' => msg,
      'int_data' => intdata.to_i #to_ I is type int, to_ F is a float type, to_ S is string type (default)
  }
  data = {
      '#time' => time,
      '#account_id'=>account_id,
      '#event_name'=>event_name,
      '#ip' => ip,
      '#type' =>'track',
      'properties' => properties
  }
  event.set('message',data.to_json)

  return [event]
  rescue
       #If you don't want a data past or error, this data can go back to null, such as account_ ID or distinct_ IDs are null returned directly []
       return []
  end
end