# Implementation
Implementation displays the basic information of the project. You can edit the project name and project picture.
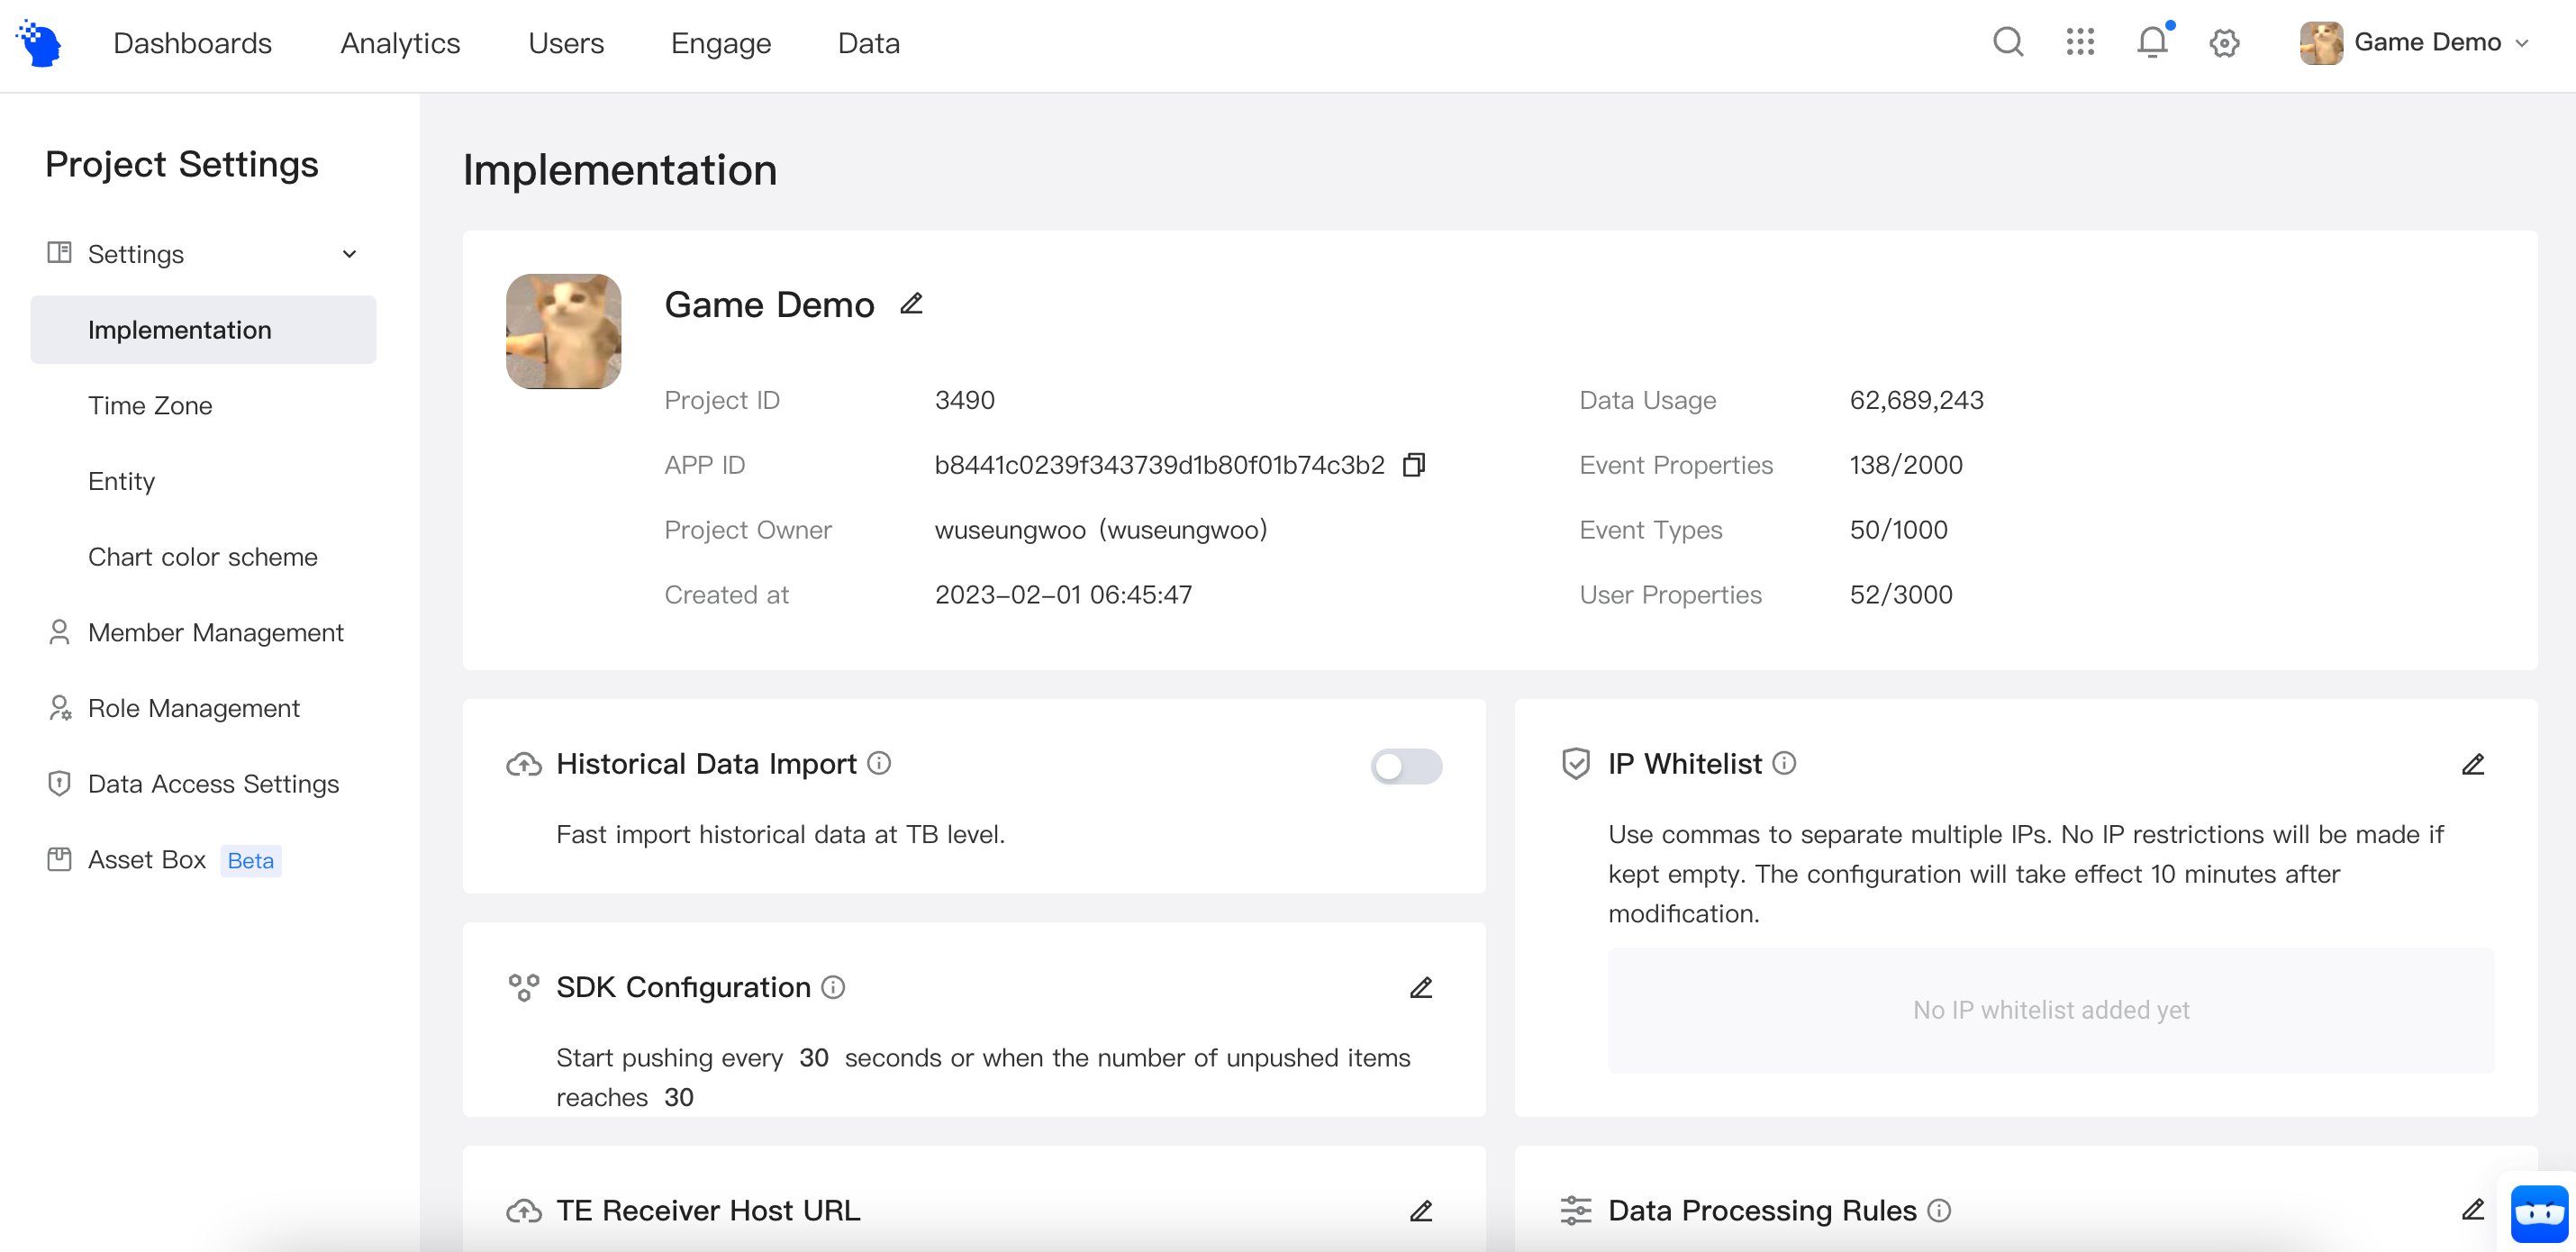
In [Implementation], you can also view and modify implement parameters, meta data overview and view the throughput usage data of the project.
In the meantime, you can perform multiple configurations for project implement on this page.
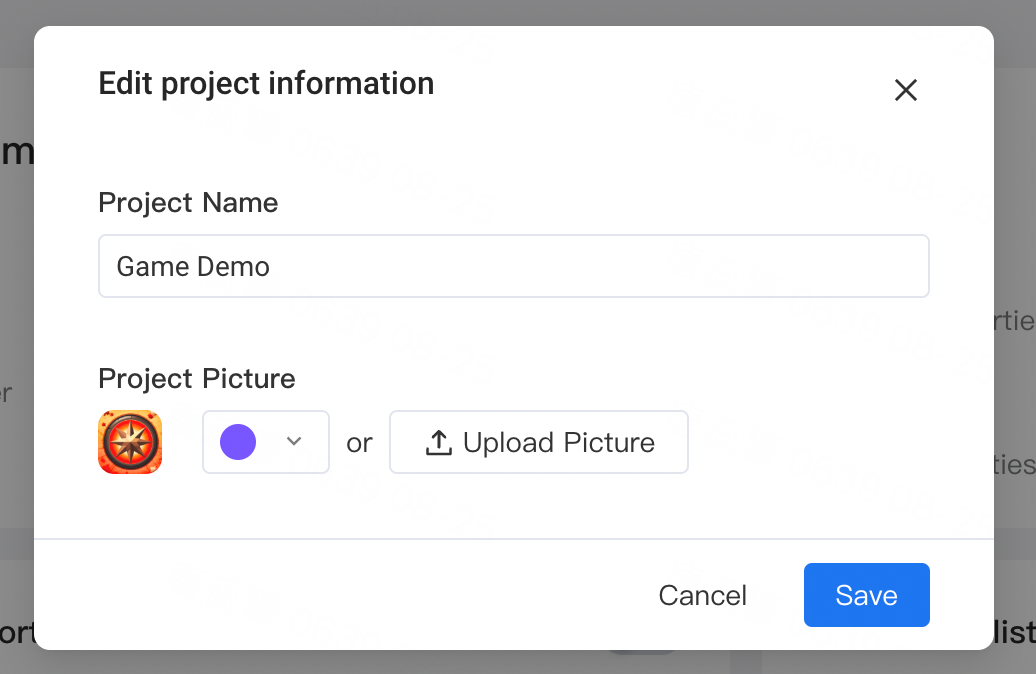
# Set Project Picture
You can upload your app picture to use as a project picture. If no picture is uploaded, TE will use the first letter as the profile picture. You may change the background color of a letter profile picture to help identify important projects.
# Historical data import
When a large amount of historical data is imported, you can enable the historical data import option and switch from real-time ingestion to batch ingestion every 3 hours and significantly increase ingestion efficiency. After enabling the option, ingestion of historical data will have a 3-hour latency.
# SDK configuration
By default, the reporting strategy of the client SDK triggers reporting every 30 seconds or when the number of local cached data exceeds 30. You can modify SDK configuration to adjust data reporting strategy from the client.
# Data processing rules
You can set data processing rules based on data tracking plan in order to control data quality from the source.
# Reporting and Receiving URL
Public addresses are suitable for reporting of client data and data ingestion from server in the public network environment; while private addresses are suitable for data ingestion and test in the intranet environment. You can learn about how to manage global reporting addresses from the Reporting Address Management page.
# IP White List
Setting IP white list is supported by server data ingestion configuration to limit IPs of data reported from the server. By default, all IPs can report data from the receiving interface of the server.
# Chart Color Scheme
You may change the color scheme of all the charts in the current project by switching between 4 color schemes.
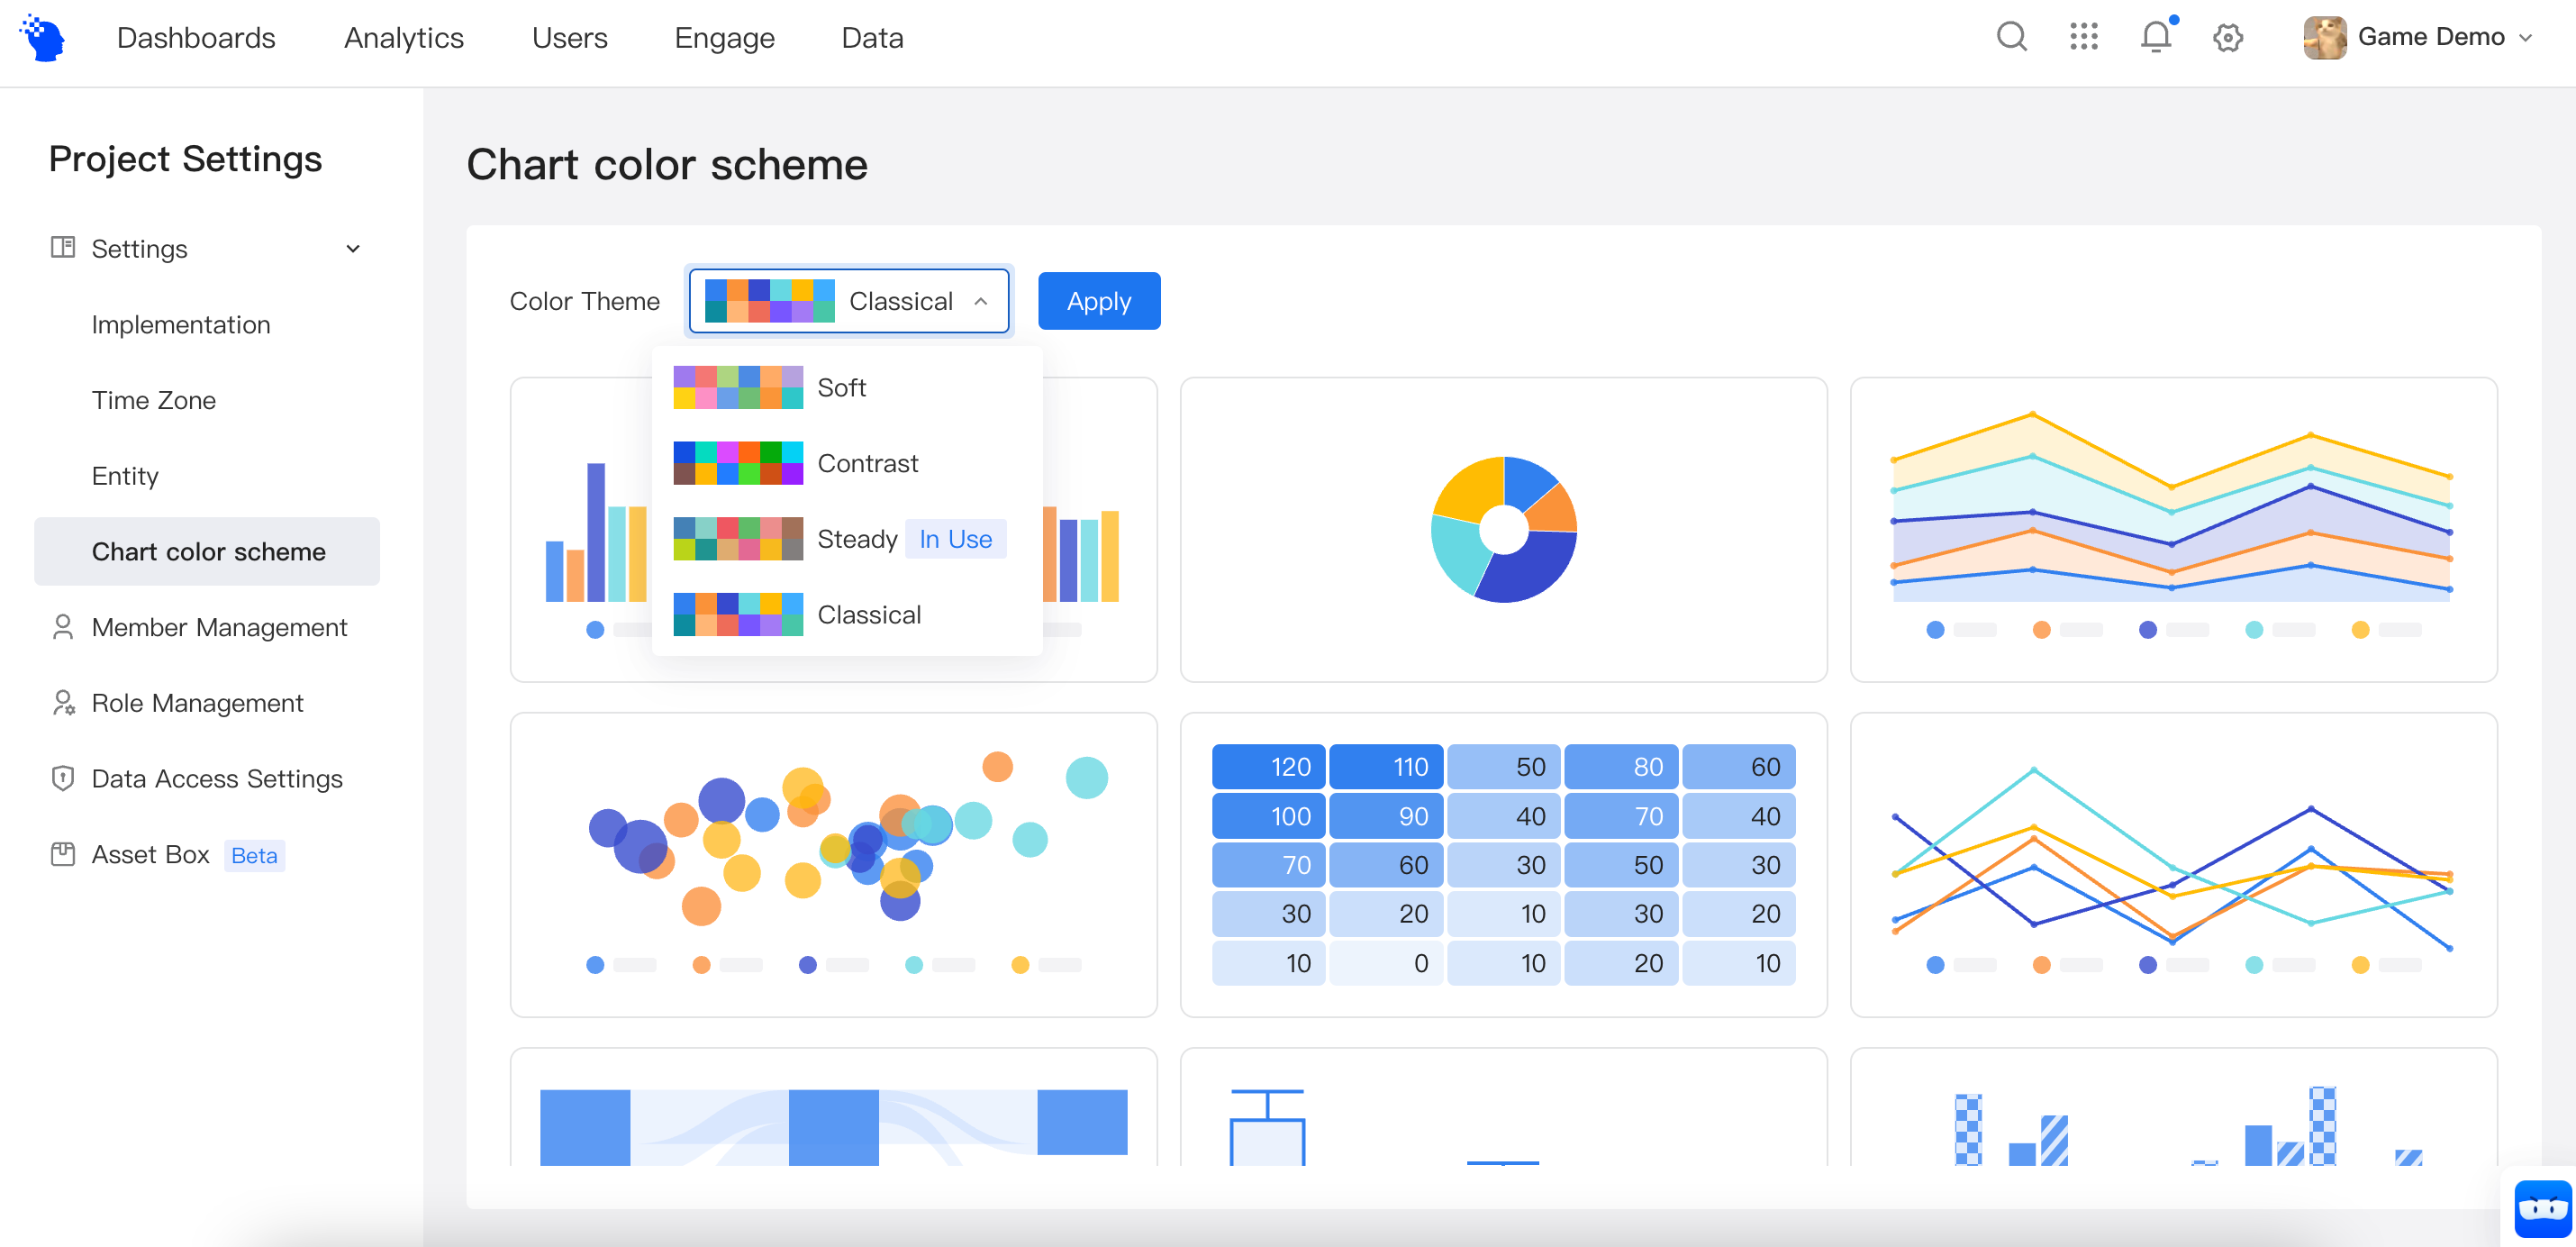
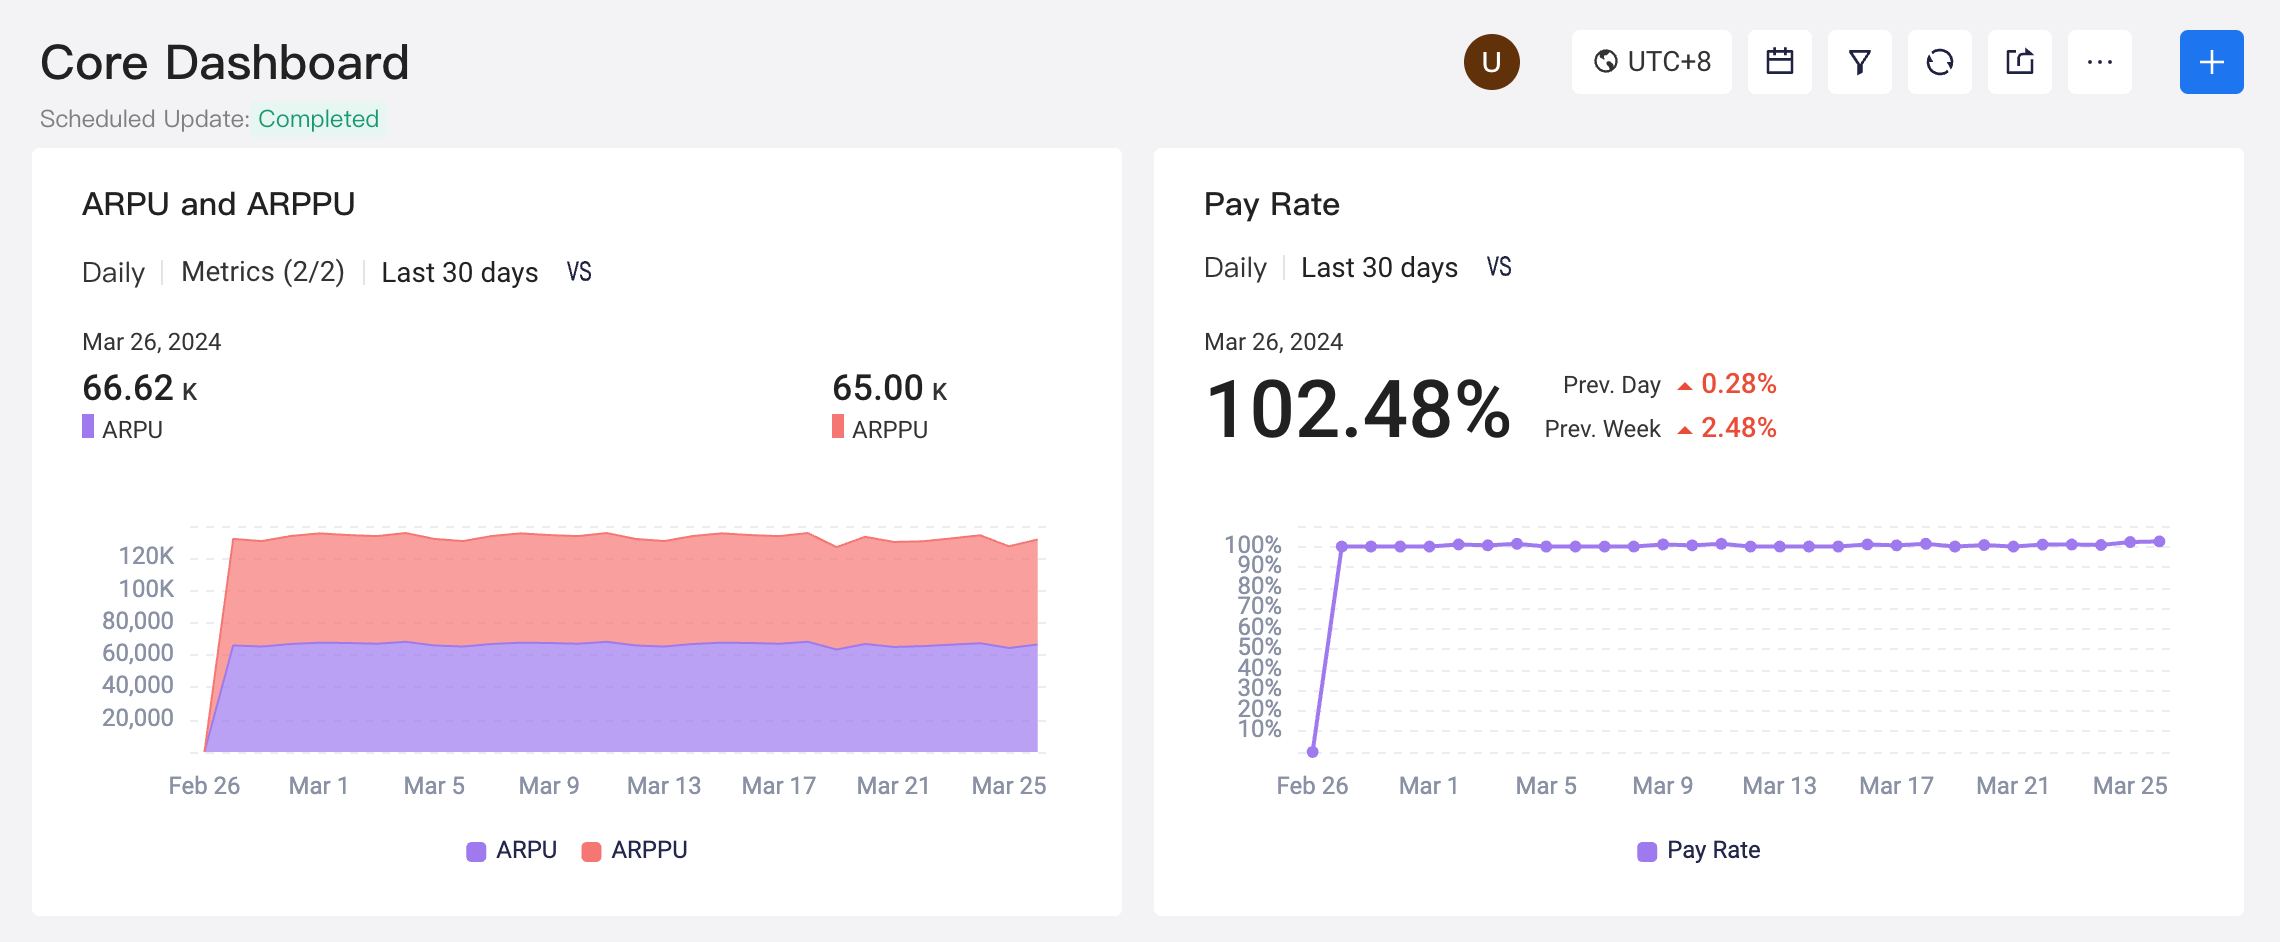
After clicking 'Apply', all charts on dashboards, reports, cohorts, tags, etc., will use the new color scheme. For example, charts in 'soft' scheme looks like the following on a dashbaord.