# Filebeat+Logstash 使用ガイド
このセクションでは、主にデータ転送ツール Filebeat+Logstash の使用方法について説明します
ドッキングを開始する前に、データルール、TEのデータ形式とデータルールに精通した後、このガイドを読んでドッキングする必要があります。
LogBusアップロードするデータは、TEのデータ形式に従う必要があります
注: LogsTEsh のスループットは低く、大量の履歴データをインポートする場合はDateX エンジンまたはLogbus ツール
# Filebeat+Logstash プロフィール
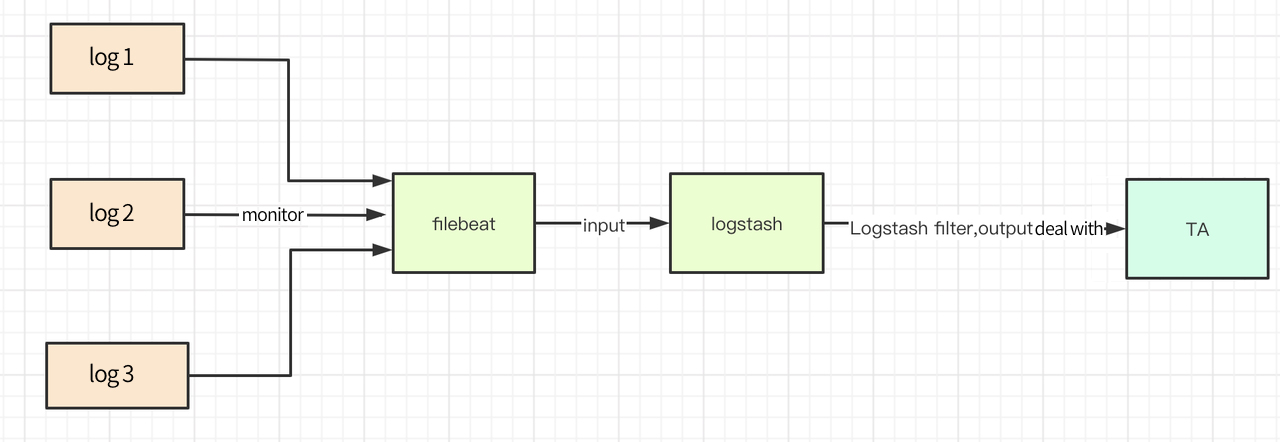
Filebeat+Logstash ツールは、主にログデータをリアルタイムで TE バックグラウンドにインポートし、サーバーログディレクトリの下のテキストストリームを監視し、ディレクトリの下の任意のログテキストに新しいデータが生成されたときにリアルタイムで TE バックグラウンドに送信するために使用されます。
Logstash はオープンソースのサーバー側データ処理パイプラインで、複数のソースから同時にデータを収集し、変換してお気に入りの「リポジトリ」に送信できます。Logstash 公式サイト (opens new window)
Filebeat は、ログディレクトリまたは特定のログファイルを監視するローカルドキュメントのログデータコレクターです。Filebeat は、ログとドキュメントを転送および集計するための軽量な方法を提供します。Filebeat 公式サイト (opens new window)
Filebeat+Logstash ベースの取得フローチャートを以下に示します
# Filebeat+Logstash のダウンロードとインストール
注意: Logstash-6. x 以上のバージョンでは、サーバーにJDK環境
# 2.2 Logstash のダウンロードとインストール
Logstashの公式インストールドキュメント (opens new window)を参照してください
# 2.3 logstash-output-thinkingdata プラグイン
最新バージョン: 1.0.0
更新時間は: 2020-06-09
# 2.3.1 logstash-output-thinkingdata プラグインのインストールとアンインストール
このプラグインはデータが json データかどうかをチェックし、パッケージデータを TE に
logstash ディレクトリで実行:
bin/logstash-plugin install logstash-output-thinkingdata
インストールには少し時間がかかりますが、インストールが成功した後に実行するのを待ってください
bin/logstaEsh-plugin list
リストに logstash-output-thinkingdata がある場合は、インストールが成功したことを表します。
その他のコマンドは次のとおりです。
アップグレードプラグインを実行できます:
bin/logstash-plugin update logstash-output-thinkingdata
アンインストールプラグインを実行できます:
bin/logstash-plugin uninstall logstash-output-thinkingdata
# 2.3.2 変更ログ
# v1.0.0 2020/06/09
- 受信 Logstash で event 渡した message を TE に送信
# 2.4 Filebeat のダウンロードとインストール
参照Filebeat 公式インストールドキュメント (opens new window)して、ダウンロード方法を選択してください
# Filebeat+Logstash 使用説明書
# 3.1 データ準備
1.まず転送するデータを ETL して TE のデータ形式、ローカルに書き込むか Kafka クラスタに転送するか、Java などのサービス側 SDK の Kafka やローカルテキストを書き込む consumer を使っている場合、データはすでに正しい形式であり、変換する必要はないです。
2.アップロードされたデータのディレクトリ、または Kafka のアドレスと topic を特定し、Filebeat+Logstash の構成を設定すると、Filebeat+Logstash はディレクトリ内の変更を監視します(新規または既存のテキストを監視します)、または Kafka のデータを購読します。
3.監視ディレクトリに保存され、アップロードされたデータログの名前を直接変更しないでください。名前変更ログは新しいテキストに相当し、Filebeat はこれらのテキストを再アップロードしてデータの重複を引き起こす可能性があります。
# 3.2 Logstash の設定
# 3.2.1 Logstash パイプライン構成
Logstash は複数のパイプラインを同時に実行することをサポートしており、各パイプライン間に影響を与えず、それぞれ独立した入出力構成を持っており、パイプラインの構成テキストは config/pipelines.yml にある。現在 Logstash を使用して他のログ収集作業を行っている場合は、元の Logstash に Pipeline を追加して TE のログデータを収集し、TE に送信します。
新しいパイプラインの構成は次のとおりです。
#  Piping Configuration for Thinkingdata
- pipeline.id: thinkingdata-output
  #  If the core number of upload user attributes is set to 1, if only the upload event attributes can be set to be less than or equal to the number of native CPUs
  pipeline.workers: 1
  # Buffer queue type used
  queue.type: persisted
  # Using different input and output configurations
  path.config: "/home/elk/conf/ta_output.conf"
より多くのパイプライン設定公式サイト:Pipeline (opens new window)
# 3.2.2 Logstash 入出力構成
TE_output.conf 参考例:
注:ここでシナリオは、SDKによって生成されたデータのテキスト、Logstash の出力入力構成
# Use beats as input
input {
    beats {
        port => "5044"
    }
}
# If it is not the generation of service-side SDK or data in TA format that requires filter to filter metadata, it is suggested here that Ruby plug-in filter be used. There is a case in Module 4.
#filter {
#   if "log4j" in [tags] {
#    ruby {
#      path => "/home/elk/conf/rb/log4j_filter.rb"
#    }
#  }
#}
# Use thinkingdata as output
output{
   thinkingdata {
        url => "http://Data Acquisition Address/logbus"
           appid =>"Your AppID"
    }
}
thinkingdaTE パラメータ説明:
| パラメータ名 | タイプ | 必要 | デフォルト値 | 説明 |
|---|---|---|---|---|
| url | string | true | No | TE data receiving address |
| appid | string | true | No | Project APPID |
| flush_interval_sec | number | false | 2 | Trigger flush interval in seconds |
| flush_batch_size | number | false | 500 | Json data that triggers flush, unit: bar |
| compress | number | false | 1 | Compressed data, 0 means no compressed data, which can be set in the intranet; 1 means gzip compression, the default gzip compression |
| uuid | boolean | false | false | Whether to turn on the UUID switch for possible deduplicate of network fluctuations at short intervals |
| is_filebeat_status_record | boolean | false | true | Whether to turn on Filebeat to monitor log status, such as offset, file name, etc |
# 3.2.3 Logstash 実行構成
Logstash はデフォルトでconfig/logstash.yml実行構成として使用します。
pipeline.workers: 1
queue.type: persisted
queue.drain: true
推奨事項
- user_set ユーザープロパティを報告するときは、構成 pipeline.workers の値を 1 に変更してください。workers の値が 1 より大きいと、データを処理する順序が変化する。track イベントは 1 より大きく設定できます。
- プログラムの予期しない終了によってデータの転送が失われないようにするには設定してください queue.type: persisted、Logstash が使用するバッファーキューの種類を表しますので、LogsTEsh を再起動した後もバッファーキュー内のデータを送信し続けるように構成します。
より多くのデータ持続性関連は公式サイトをご覧ください persistent-queues (opens new window)
- 設定 queue.drain の値を true に設定すると、Logstash は正常に終了する前にすべてのバッファキュー内のすべてのデータを送信します。
詳細は公式サイトをご覧ください logstash.yml (opens new window)
# 3.2.4 Logstash の起動
Logstash インストールディレクトリの下 1.パイプライン構成および実行構成として config/pipelines.yml を使用して直接起動します
bin/logstash
2.指定された ta_output.conf は、実行構成として config/logstash.yml を使用して、入力および出力構成ブックとして起動します
bin/logstash -f /youpath/ta_output.conf
3.バックグラウンド起動
nohup bin/logstash -f /youpath/ta_output.conf > /dev/null 2>&1 &
より多くの起動は、Logstash公式起動ドキュメント (opens new window)
# 3.3 Filebeat の構成
# 3.3.1 Filebeat の実行構成
Filebeat はバックエンド SDK ログブックを読み込みます。Filebeat のデフォルトの設定テキストは次のとおりです filebeat.yml。config/filebeat.yml 参照構成は次のとおりです。
#======================= Filebeat inputs =========================
filebeat.shutdown_timeout: 5s
filebeat.inputs:
- type: log
  enabled: true
  paths:
     - /var/log/log.*
    #- c:\programdata\elasticsearch\logs\*
#------------------------- Logstash output ----------------------------
output.logstash:
 # You can fill in either a single server process or a Logstash process on multiple servers
  hosts: ["ip1:5044","ip2:5044"]
  loadbalance: false
- shutdown_timeout (opens new window): Filebeat は、クローズする前に、パブリッシャーがイベントの送信を完了するのを待っています。
- paths:監視するログを指定します。現在、Go 言語の glob 関数に従って処理されています。
- hosts:送信アドレスは複数の Logstash hosts で、loadbalance が false の場合はプライマリ機能と同様、true は負荷分散を表します。
- loadbalance: user_setでユーザープロパティを送信する場合は loadbalance : true を設定しないてください。
trackイベントをインポートするだけの場合、複数の Logstash プロセスを設定し、loadbalance: true を設定できます。
Filebeat のデフォルト設定は loadbalance: false
Filebeat 資料が閲覧可能:Filebeat 公式ドキュメント (opens new window)
# 3.3.2 Filebeat の起動
filebeat 起動後、関連する出力情報を表示:
./filebeat -e -c filebeat.yml
バックグラウンド起動
nohup ./filebeat -c filebeat.yml > /dev/null 2>&1 &
# ケース配置参考
# 4.1 filebeat は異なるログフォーマットのデータ構成を監視
個々の Filebeat の filebeat.xml は以下のように設定でき、実行メモリは約 10 MB で、複数の filebeat プロセスから異なるログ形式を監視することもでき、具体的には公式サイトを参照してください
#=========================== Filebeat inputs =============================

filebeat.inputs:
- type: log
  enabled: true
  #Monitoring Catalog
  paths:
     - /home/elk/sdk/*/log.*
  #Tag the data and match it with Logstash without filter processing
  tags: ["sdklog"]
 #Data split by special characters
- type: log
  enable: true
  paths: /home/txt/split.*
  #Tags the data, Logstash matches, filter processing is required
  tags: ["split"]
 # log4j Received data
- type: log
  enable: true
  paths: /home/web/logs/*.log
  # Filter processing required
  tags: ["log4j"]
   # log4j Received data
 # nginx Log data
- type: log
  enable: true
  paths: /home/web/logs/*.log
  tags: ["nginx"]
# 4.2 Logstash 構成
Logstash の構成ブックが間違っているかどうかをチェックします。
bin/logstash -f /home/elk/ta_output.conf --config.test_and_exit
注意:次のスクリプトはすべて ruby プラグインが ruby 構文に基づいて書かれているので、java に詳しい場合はlogbusディレクトリの下のカスタムパーサです。
# 4.2.1 サービス側 SDK ログ
ta_output.conf は以下のように設定できます
input {
    beats {
        port => "5044"
    }
}
# Use thinkingdata as output
output{
   thinkingdata {
        url => "url"
        appid =>"appid"
        # compress => 0
        # uuid => true
    }
}
# 4.2.2 log4j ログ
log4j 形式は次のように設定できます
 //Log format
 //[%d{yyyy-MM-dd HH:mm:ss.SSS}] The log matches the input time of TA, or it can be yyyy-MM-dd HH:mm:ss
 //[%level{length=5}]    log level,debug、info、warn、error
 //[%thread-%tid]    Current thread information
 //[%logger] Current log information belongs to the full path of the class
 //[%X{hostName}]    Current Node Host Name. Requires definition via MDC
 //[%X{ip}]  Current node ip. Requires definition via MDC.
 //[%X{userId}]  Unique ID of user login, account_can be set Id, which can also be set to other values, account_is required in TA ID and distinct_ ID cannot be empty at the same time, you can set other properties to see the business settings. Requires definition via MDC.
 //[%X{applicationName}] 当前应用程序名。需要通过MDC来自定义。
 //[%F,%L,%C,%M] %F:The file (class) name to which the current log information belongs,% l: the line number of the log information in the file to which it belongs,% C: the full class name of the file to which the current log belongs,% m: the method name to which the current log belongs
 //[%m]  Log details
 //%ex   Abnormal information
 //%n    wrap
 <property name="patternLayout">[%d{yyyy-MM-dd HH:mm:ss.SSS}] [%level{length=5}] [%thread-%tid] [%logger] [%X{hostName}] [%X{ip}] [%X{userId}] [%X{applicationName}] [%F,%L,%C,%M] [%m] ## '%ex'%n
</property>
ta_output.conf 構成
input {
    beats {
        port => "5044"
    }
}
filter {
if "log4j" in [tags]{
    #Other filter data processing can also be performed
   ruby {
     path => "/home/conf/log4j.rb"
    }
 }
}
# Use thinkingdata as output
output{
  thinkingdata {
        url => "url"
        appid =>"appid"
    }
}
/home/conf/log4j.rb スクリプトは以下の通りです
# This is where the correct data format is regularized. If the error log is recommended to be placed in a separate file, the error log is too long without analyzing the scenario and crosses
def filter(event)
  _message = event.get('message') #message 是你的上传的每条日志
begin
  #This is where the correct data format is regularized. If the error log is recommended to be placed in a separate file, the error log is too long without analyzing the scenario and crosses
  #The data here is in a format similar to this _message ="[2020-06-08 23:19:56.003] [INFO] [main-1] [cn.thinkingdata] [x] [123.123.123.123] [x] [x] [StartupInfoLogger.java,50,o)] ## ''"
 mess = /\[(.*?)\] \[(.*?)\] \[(.*?)\] \[(.*?)\] \[(.*?)\] \[(.*?)\] \[(.*?)\] \[(.*?)\] \[(.*?)\] ## '(.*?)'/.match(_message)
time = mess[1]
level = mess[2]
thread = mess[3]
class_name_all = mess[4]
event_name = mess[5]
ip = mess[6]
account_id = mess[7]
application_name = mess[8]
other_mess = mess[9]
exp = mess[10]

if event_name.empty? || account_id.empty?
  return []
end

properties = {
      'level' => level,
      'thread' => thread,
      'application_name' => application_name,
      'class_name_all' => class_name_all,
      'other_mess' => other_mess,
      'exp' => exp
}

  data = {
      '#ip' => ip,
      '#time' => time,
      '#account_id'=>account_id,
      '#event_name'=>event_name,   #If type is track, it can be used if #event_is not available Name does not need to be uploaded
      '#type' =>'track',           #It can be retrieved in a file, if any, to confirm whether the reported data is a user or event attribute
      'properties' => properties
  }

  event.set('message',data.to_json)
  return [event]
  rescue
      # puts _message
      puts "Data does not conform to regular format"
      return [] #Do not report
  end
end
# 4.2.3 Nginx ログ
まずは Nginx ログのフォーマットを定義し、json 形式に設定してください
input {
    beats {
        port => "5044"
    }
}
filter {
#No tags need to be judged if the data is in the same format
if "nginx" in [tags]{
   ruby {
     path => "/home/conf/nginx.rb"
    }
 }
}
# Use thinkingdata as output
output{
  thinkingdata {
        url => "url"
        appid =>"appid"
    }
}
/home/conf/nginx.rb スクリプトは次のとおりです
  require 'date'
   def filter(event)
      #Extract similar log information
      # {"accessip_list":"124.207.82.22","client_ip":"123.207.82.22","http_host":"203.195.163.239","@timestamp":"2020-06-03T19:47:42+08:00","method":"GET","url":"/urlpath","status":"304","http_referer":"-","body_bytes_sent":"0","request_time":"0.000","user_agent":"s","total_bytes_sent":"180","server_ip":"10.104.137.230"}
      logdata= event.get('message')
       #Parse the log level and request time and save it to the event object
         #Parsing JSON format log
    #Get log content
    #Convert to JSON Object
    logInfoJson=JSON.parse logdata
    time = DateTime.parse(logInfoJson['@timestamp']).to_time.localtime.strftime('%Y-%m-%d %H:%M:%S')
    url = logInfoJson['url']
    account_id = logInfoJson['user_agent']
    #event_name
    #Account_ ID or #distinct_ Skip reporting when ID is null at the same time
    if url.empty? || url == "/" || account_id.empty?
      return []
    end
    properties = {
      "accessip_list" => logInfoJson['accessip_list'],
      "http_host"=>logInfoJson['http_host'],
      "method" => logInfoJson['method'],
      "url"=>logInfoJson['url'],
      "status" => logInfoJson['status'].to_i,
      "http_referer" => logInfoJson['http_referer'],
      "body_bytes_sent" =>logInfoJson['body_bytes_sent'],
      "request_time" =>  logInfoJson['request_time'],
      "total_bytes_sent" => logInfoJson['total_bytes_sent'],
      "server_ip" => logInfoJson['server_ip'],
    }
  data = {
      '#ip' => logInfoJson['client_ip'],#Can be null
      '#time' => time,   #can not be null
      '#account_id'=>account_id, # account_id 和distinct_id can not be null at the same time
      '#event_name'=>url,   #If type is track, it can be used if #event_is not available Name does not need to be uploaded
      '#type' =>'track',           #It can be retrieved in a file, if any, to confirm whether the reported data is a user or event attribute
      'properties' => properties
  }
   event.set('message',data.to_json)
   return [event]

  end
# 4.2.4 その他のログ
ta_output.conf 構成は以下の通り設定できます
input {
    beats {
        port => "5044"
    }
}
filter {
if "other" in [tags]{
    #Other filter data processing is possible
   ruby {
     path => "/home/conf/outher.rb"
    }
 }
}
# Use thinkingdata as output
output{
  thinkingdata {
        url => "url"
        appid =>"appid"
    }
}
/home/conf/outher.rb スクリプトは次のとおりです。
# def register(params)
#   # The parameters obtained here via params are via script_in the logstash file Params incoming
#   #@message = params["xx"]
# end
def filter(event)
  #Processing business data here, without a series of processing such as grok, get metadata directly from message for processing
  begin
  _message = event.get('message') #message is every log you upload
  #The logs processed here are data similar to the following
  #2020-06-01 22:20:11.222,123455,123.123.123.123,login,nihaoaaaaa,400
  time,account_id,ip,event_name,msg,intdata=_message.split(/,/)
  #Or by regularly matching or JSON data, the ruby grammar parses JSON and data can be processed and reported here
  #mess = /regular/.match(_message)
  #time = mess[1]
  #level = mess[2]
  #thread = mess[3]
  #class_name_all = mess[4]
  #event_name = mess[5]
  #account_id = mess[6]
  #api = mess[7]

  properties = {
      'msg' => msg,
      'int_data' => intdata.to_i #to_ I is type int, to_ F is a float type, to_ S is string type (default)
  }
  data = {
      '#time' => time,
      '#account_id'=>account_id,
      '#event_name'=>event_name,
      '#ip' => ip,
      '#type' =>'track',
      'properties' => properties
  }
  event.set('message',data.to_json)

  return [event]
  rescue
       #If you don't want a data past or error, this data can go back to null, such as account_ ID or distinct_ IDs are null returned directly []
       return []
  end
end