# デバッキング
SDK でデータアクセスを実装する中で、IDE コントローラー中のログまたは TE の Debug 機能を利用してでバッキングできます。
# SDK ログをプリント
ThinkingAnalyticsSDK.enableTrackLog(true);
ログを有効にすると、IDE 中で ThinkingAnalytics に関するログをフィルターリングして SDK のデータ送信をでバッキングできます。
# Debug モードを起動
Debug モードは以下の 2 ステップで操作可能です
- クライアントで Debug モードを起動
以下はクライアントで Debug モードを起動するコード例:
// obtain TDConfig instance
TDConfig config = TDConfig.getInstance(this, TE_APP_ID, TE_SERVER_URL);
/*
Set the operation mode as the Debug mode
NORMAL mode: the data would be saved in caches and reported according to relevant cache policies under the NORMAL mode by default. It is recommended to use the mode in an online environment
Debug mode: report data item by item. If problems occur, the user would be notified with logs and anomalies. It is recommended to use the Debug mode in an online environment
DebugOnly mode: data would be verified without being stored; it is not recommended to use the DebugOnly mode in an online environment
 */
config.setMode(TDConfig.ModeEnum.DEBUG);
// initialize SDK
instance = ThinkingAnalyticsSDK.sharedInstance(config);
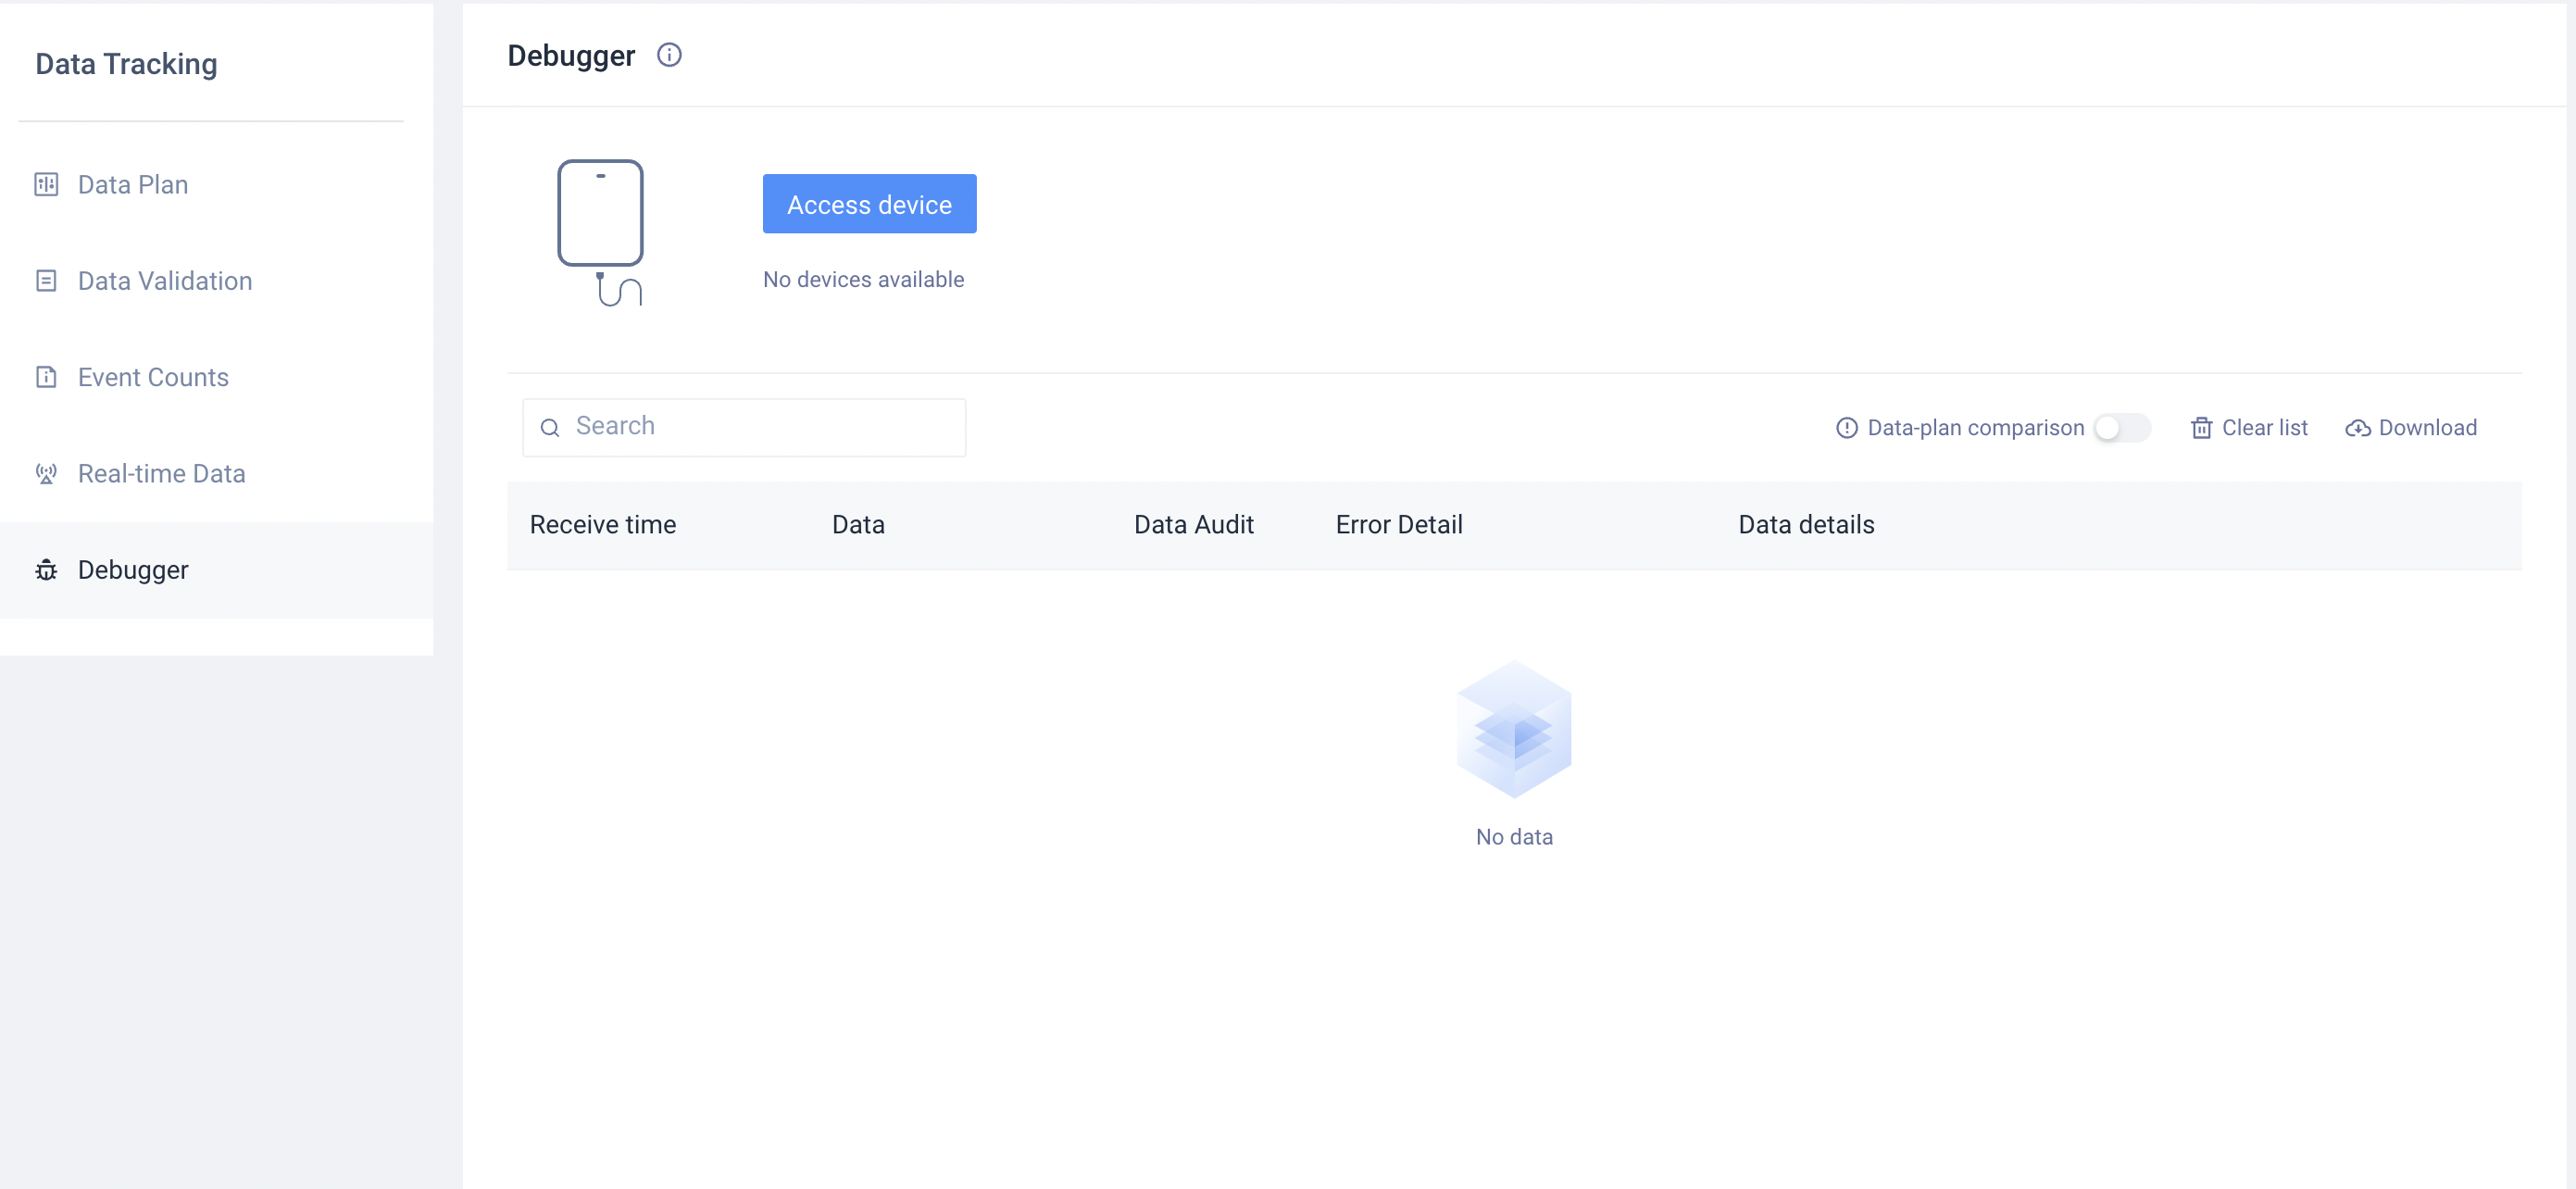
- TE システム内で Debug デバイスを追加
Debug モードを本番環境でリリースしてしまうことを避けるため、特定のデバイスのみ Debug モードが起動できます。
クライアントで Debug モードを起動し、デバイス ID を TE システムの「データ管理」→「デバッグモード」で追加した上で Debug モードに起動できます。
デバイス ID は以下の 3 種の方法で取得可能です。
- TE システムのイベントデータの#device_id
- クライアントログ:SDK 初期化完了後にプリントした DeviceId
- 呼び出しで取得:デバイス ID 取得
Debug モードはデータ収集の質と App の安定性に影響しますため、データ検証のみお使いください。