# How to Customize Table Display
Tables are convenient tools to display specific values of analysis metrics. In TE, you can customize them as needed.
# Table Styles
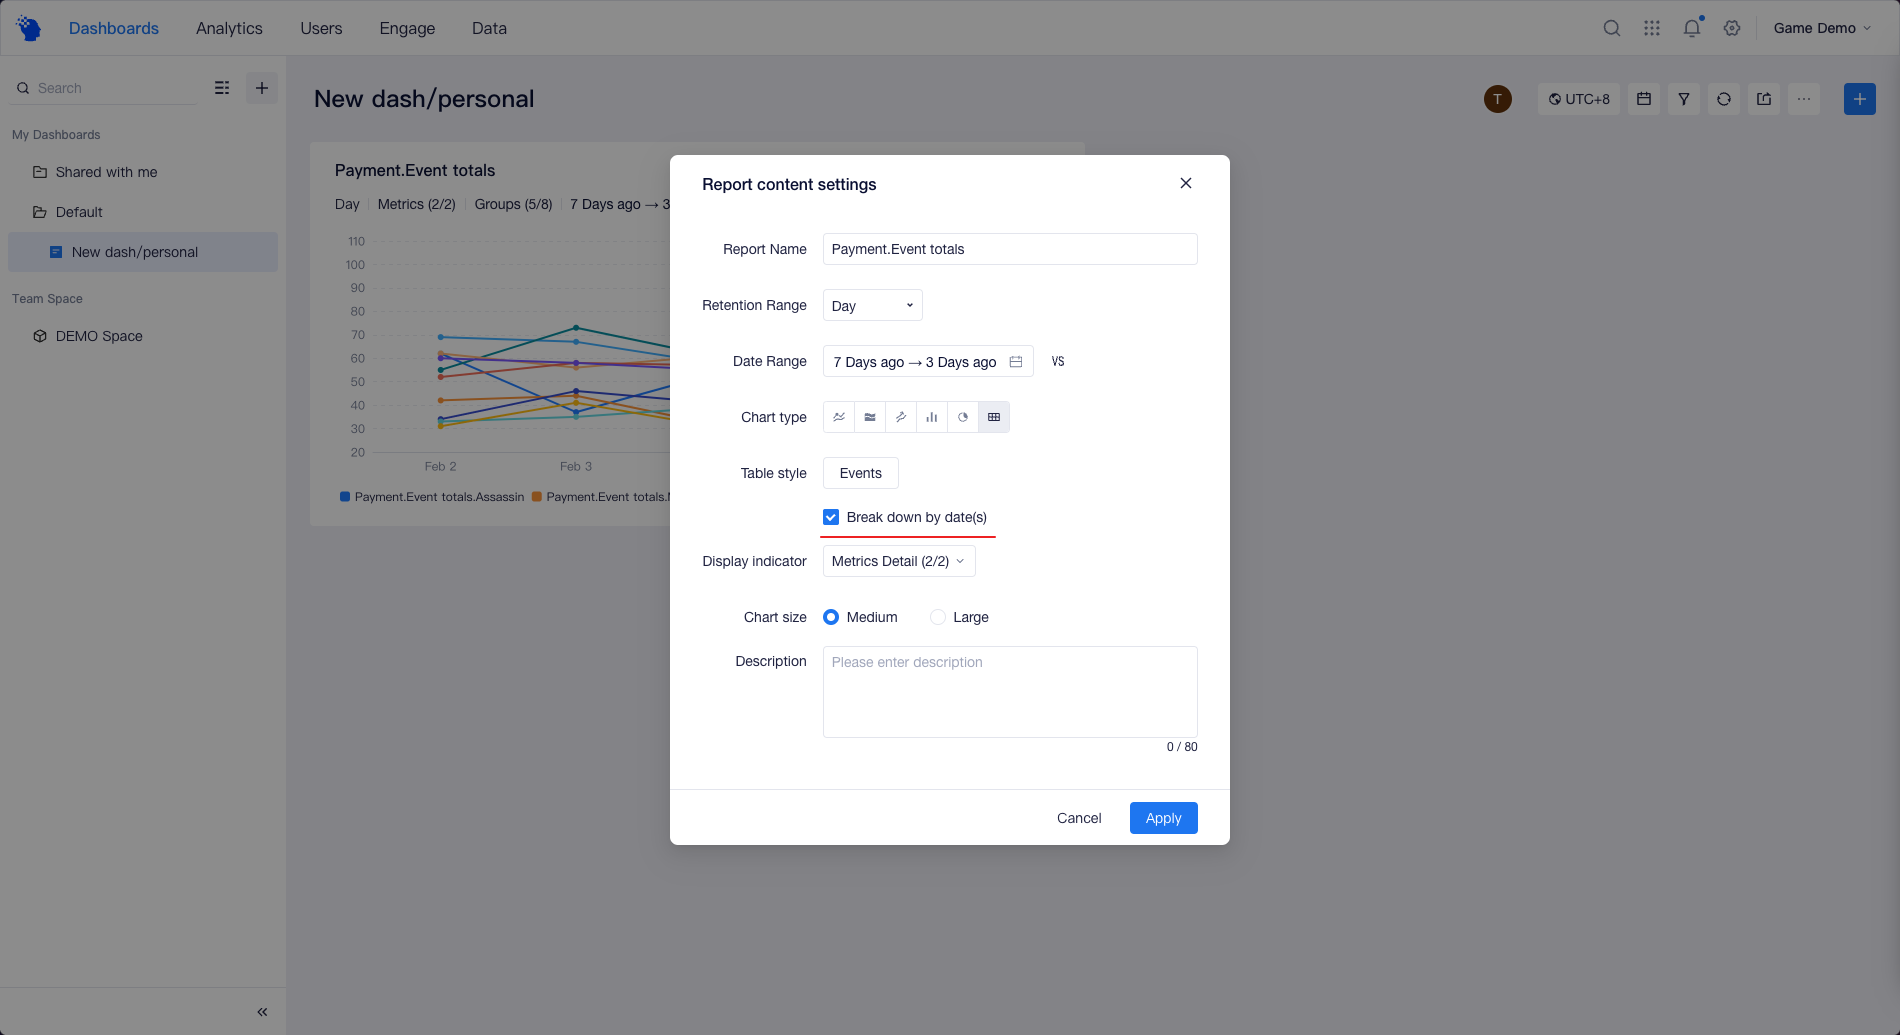
The default table style is "Date > Ascending", with data of different dates being displayed in an ascending date order and each date corresponding to a column in the table. If you want to see the data of the latest date first, you can adjust the table style to "Date > Descending".
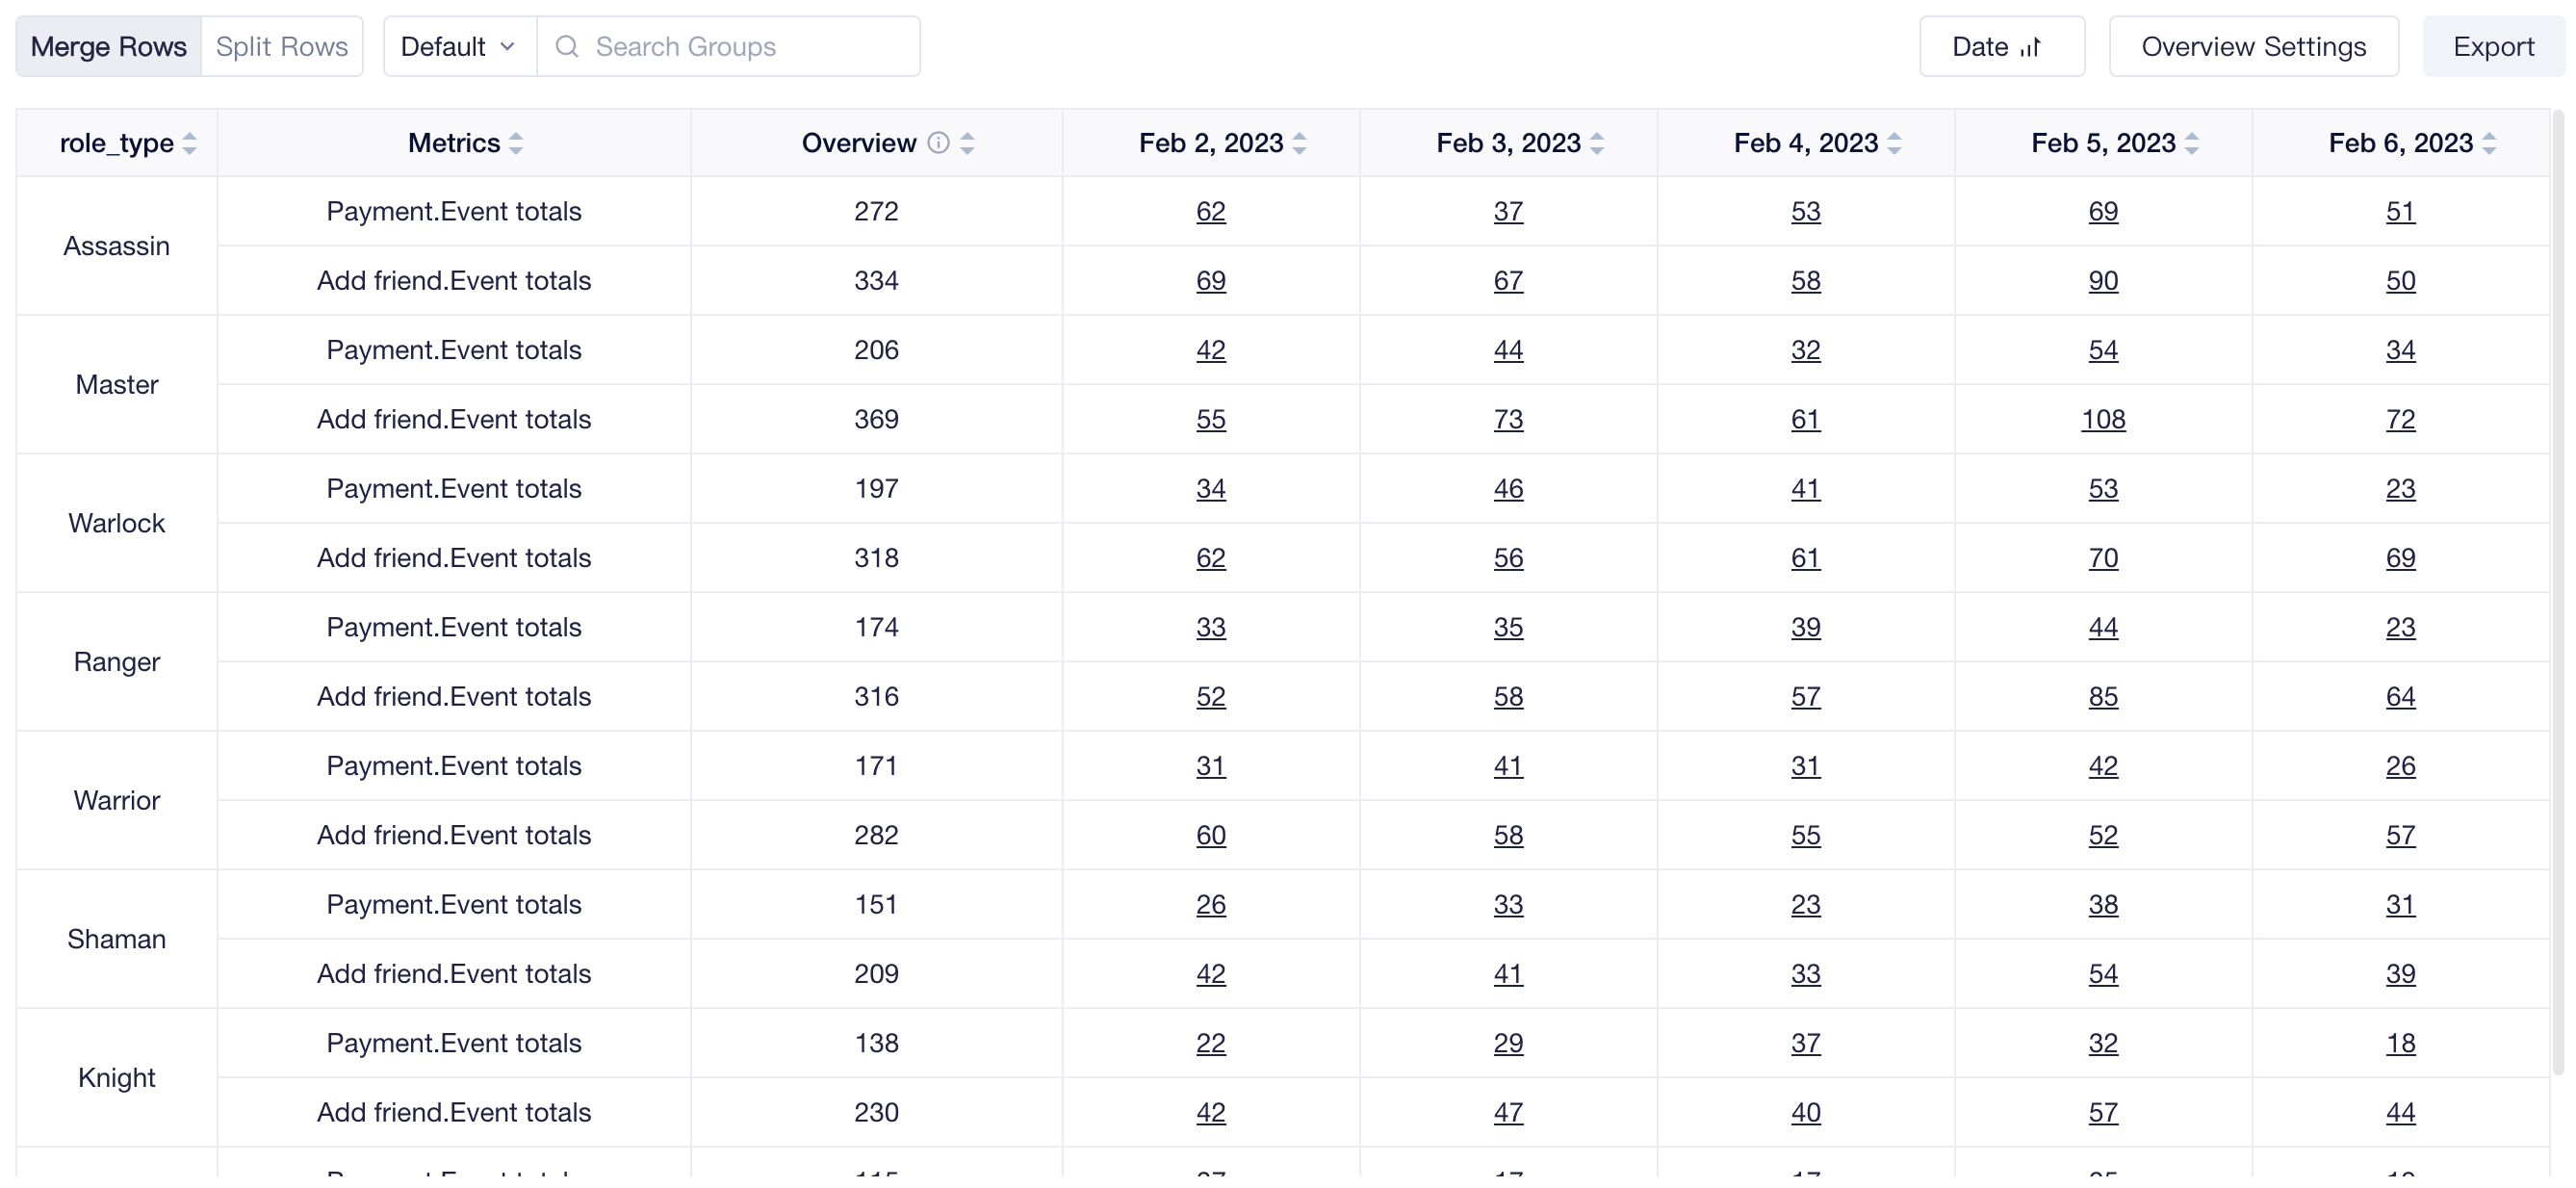
In addition to table with data sorted "Date", you can also view data by "Event". In this type of table, rows and columns are transposed when compared to the default table style, each analysis metric corresponds to a column in the table, and each row represents the data of one date.
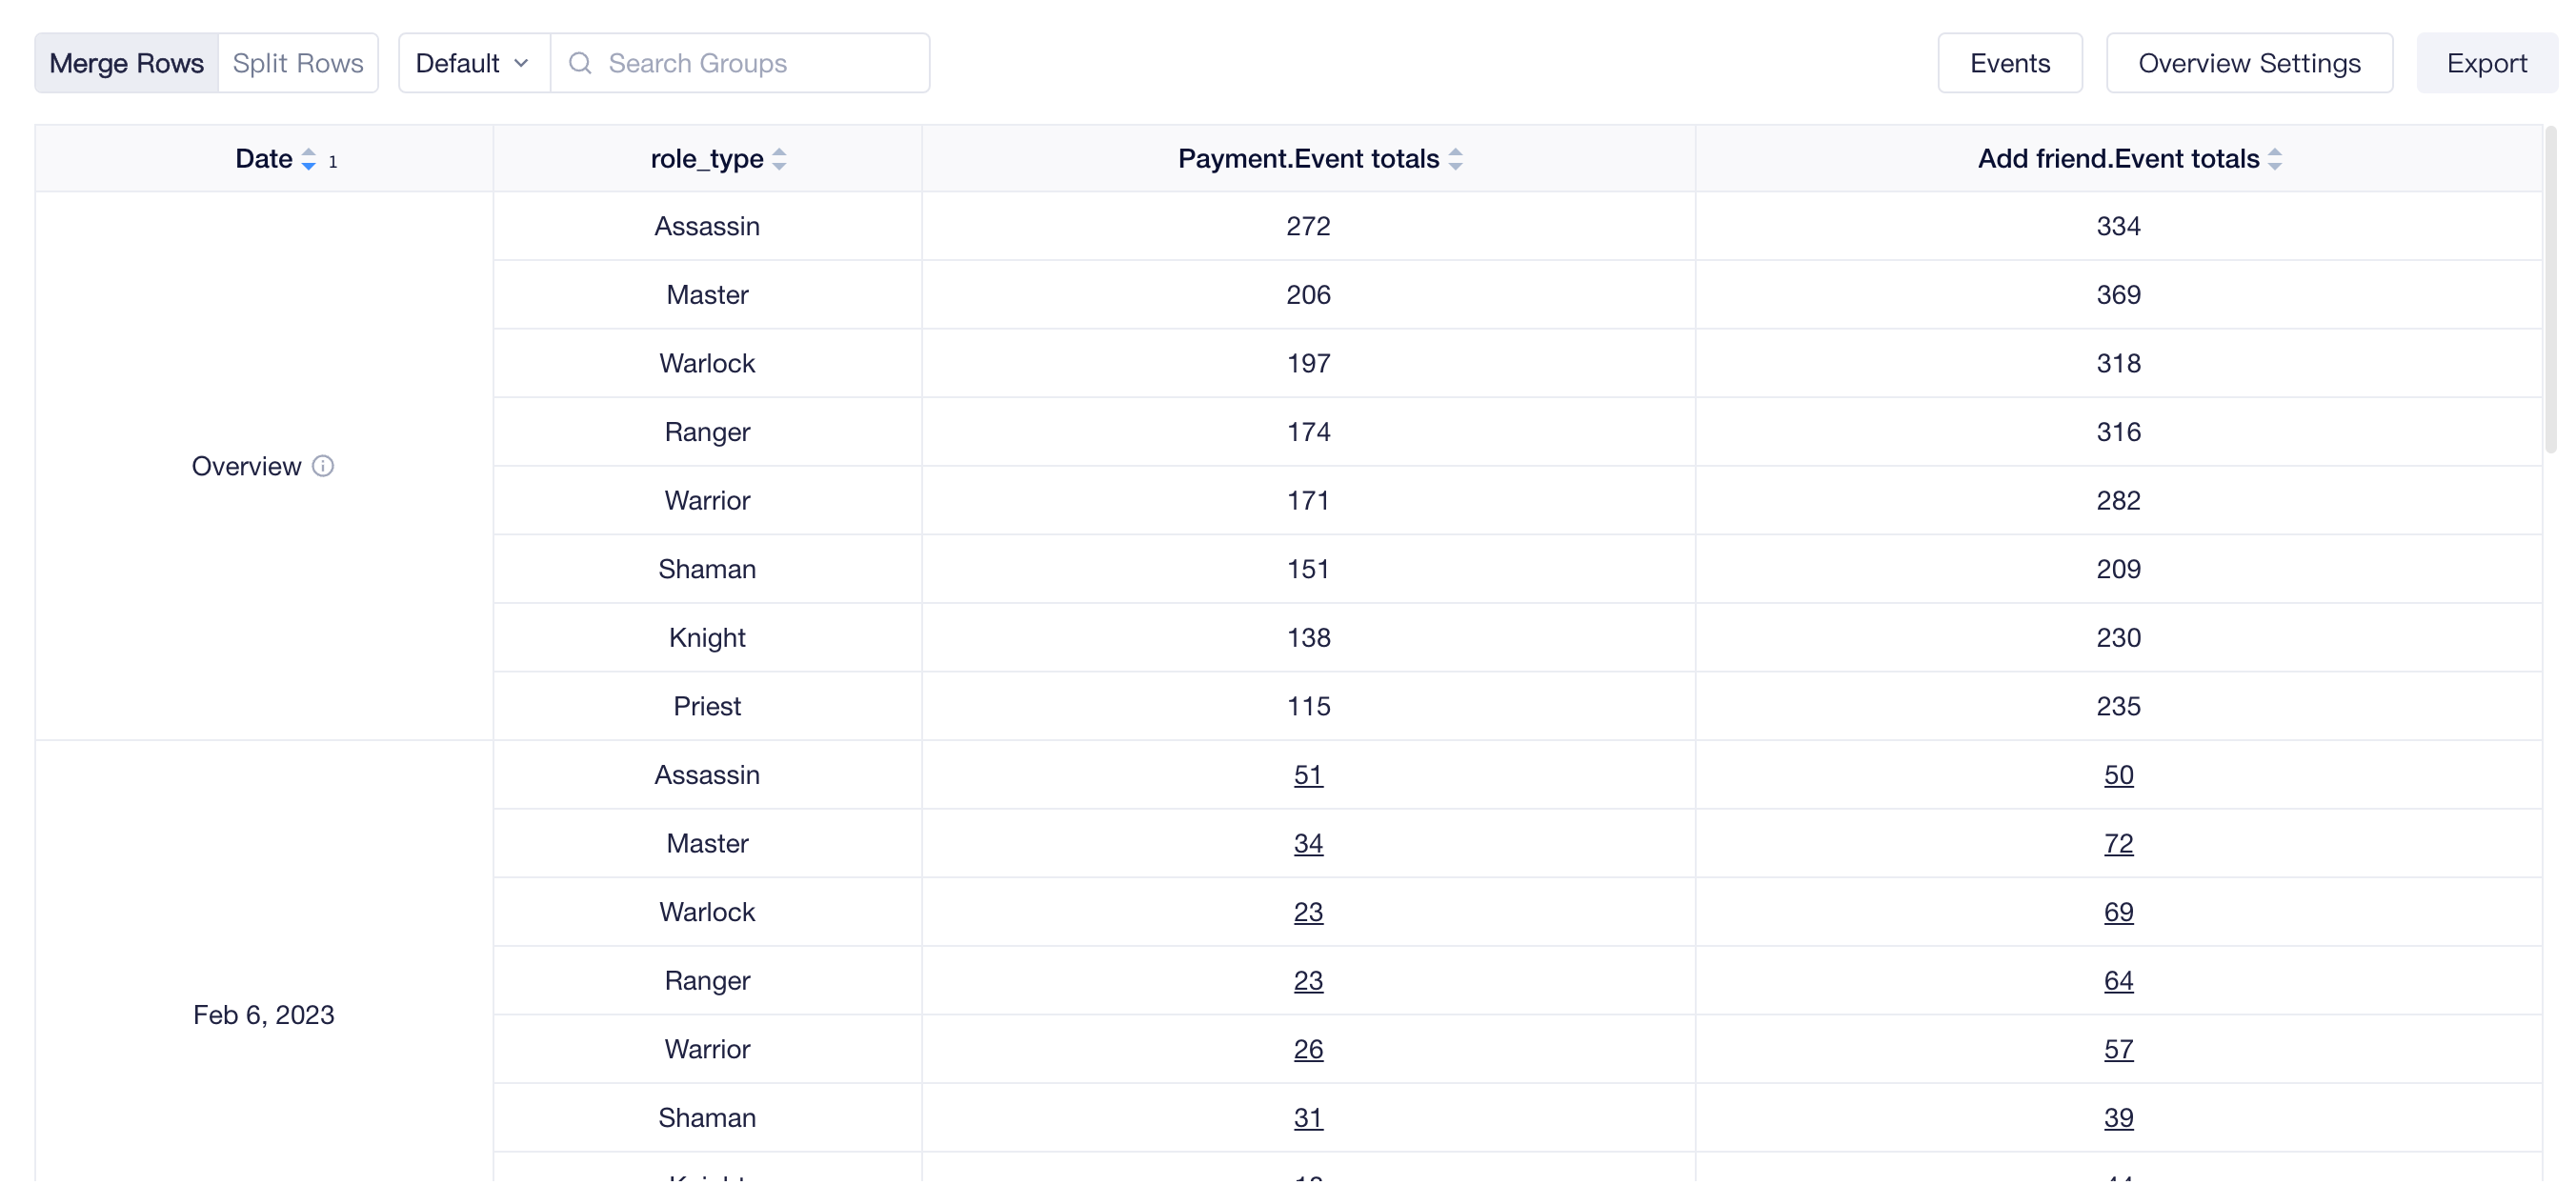
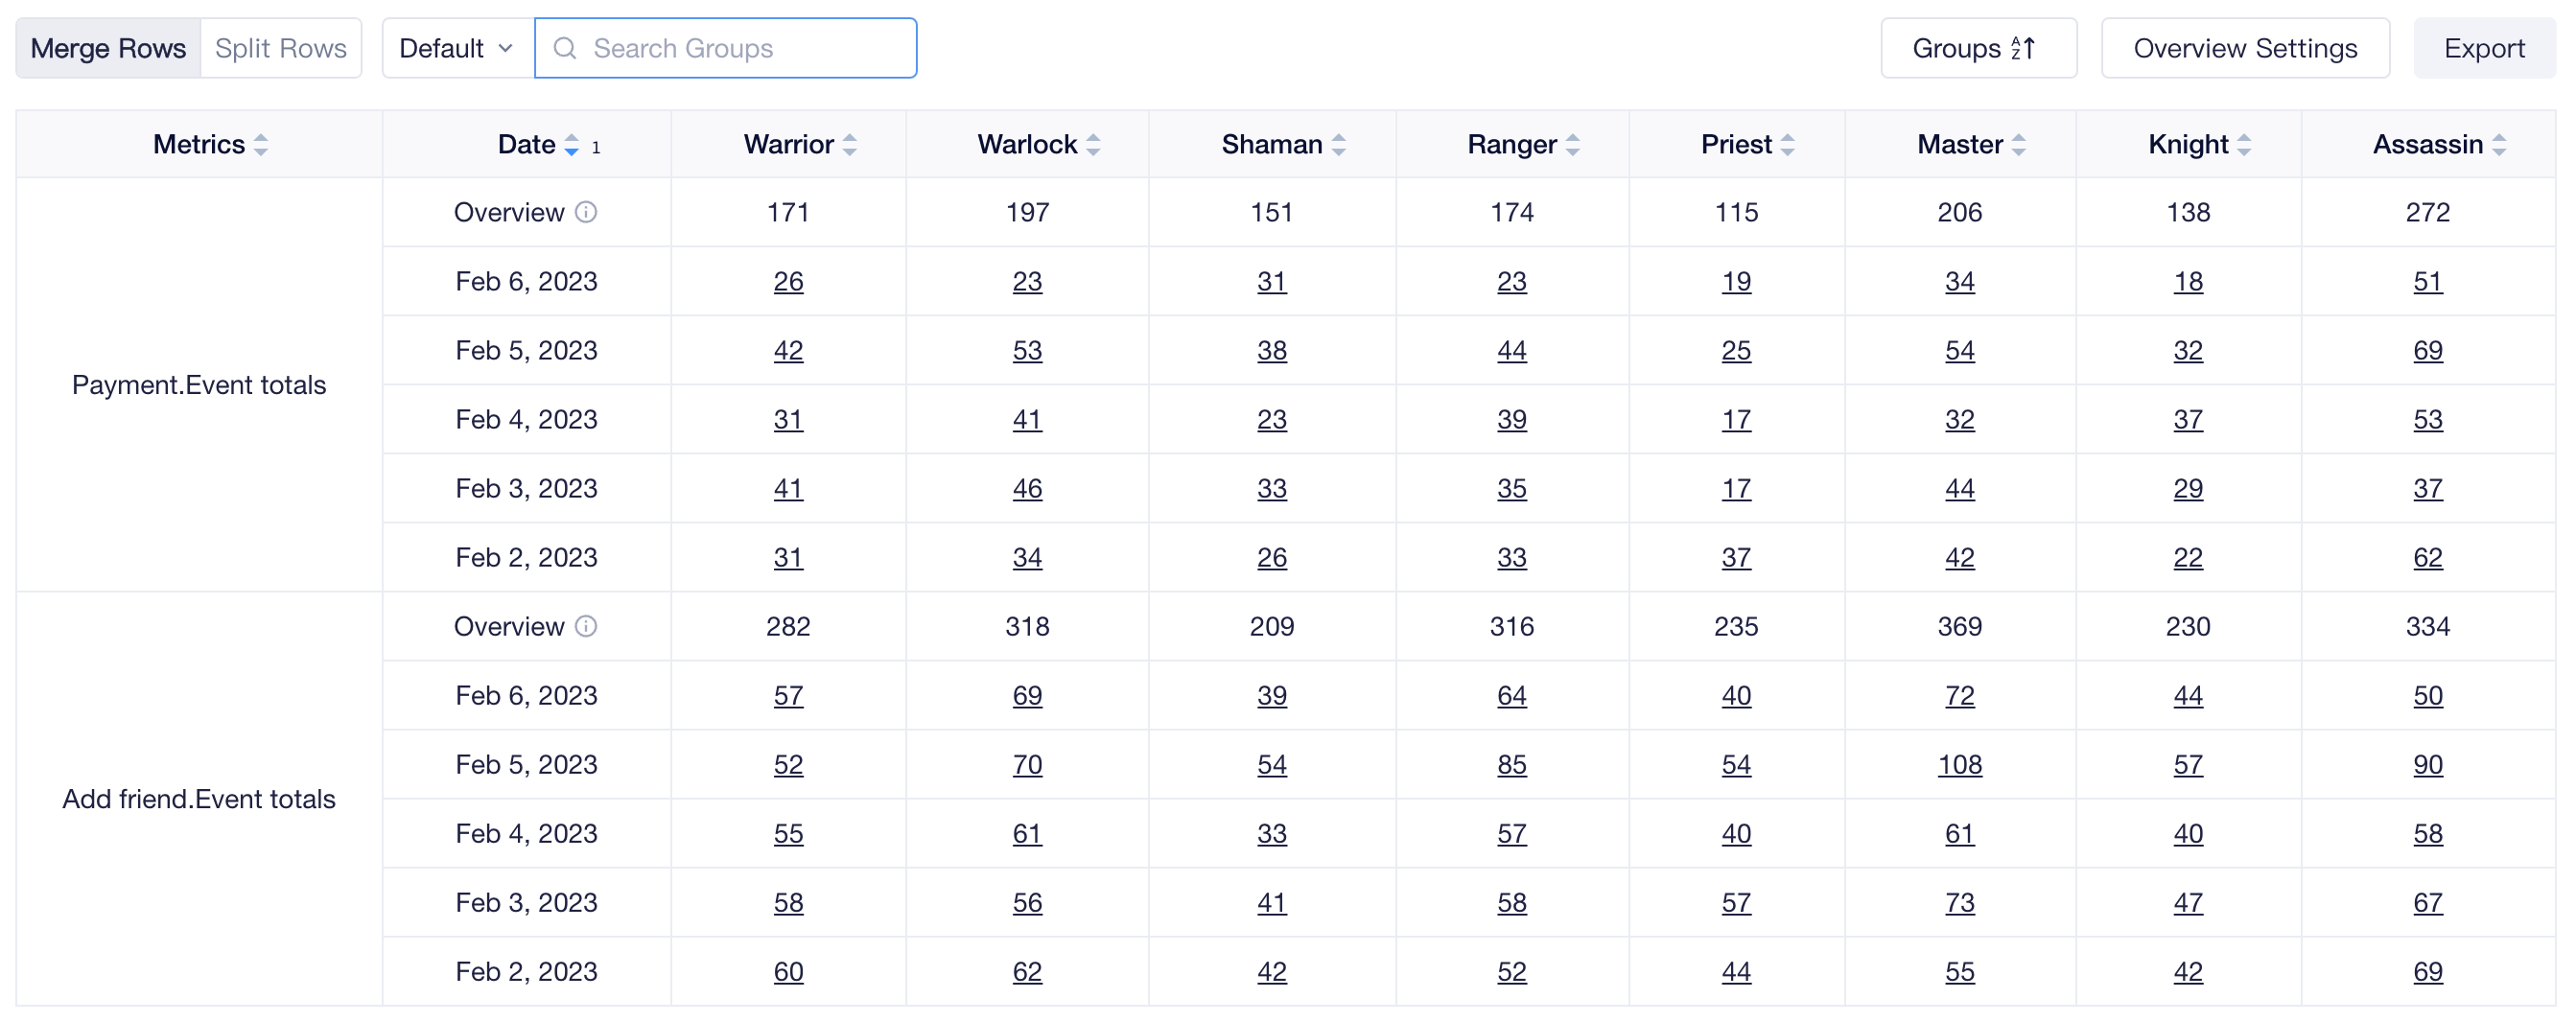
If you use "Group by" or "Event Breakdown", you can also select "Groups" to display data with subgroup values as table headers. The default sorting method of "Groups" tables have data sorted by the Period Total of the first analysis metric in a descending order. You can switch to sort by subgroup value in an ascending or descending dictionary order.
When displayed in a "Groups" table in the dashboard, you can also select to display the date outside the table for easier date switch and comparison between subgroups.
# Overview Settings
When a non-total analysis granularity is selected, Event Analysis will automatically calculate period total for analysis metrics. You can click "Overview Settings" to select the appropriate Period Total calculation method for each analysis metric. Then, in addition to the data of different dates, the overview results will be calculated and displayed based on the data of each date.
If you do not need to show Overview Settings, you can uncheck this option.
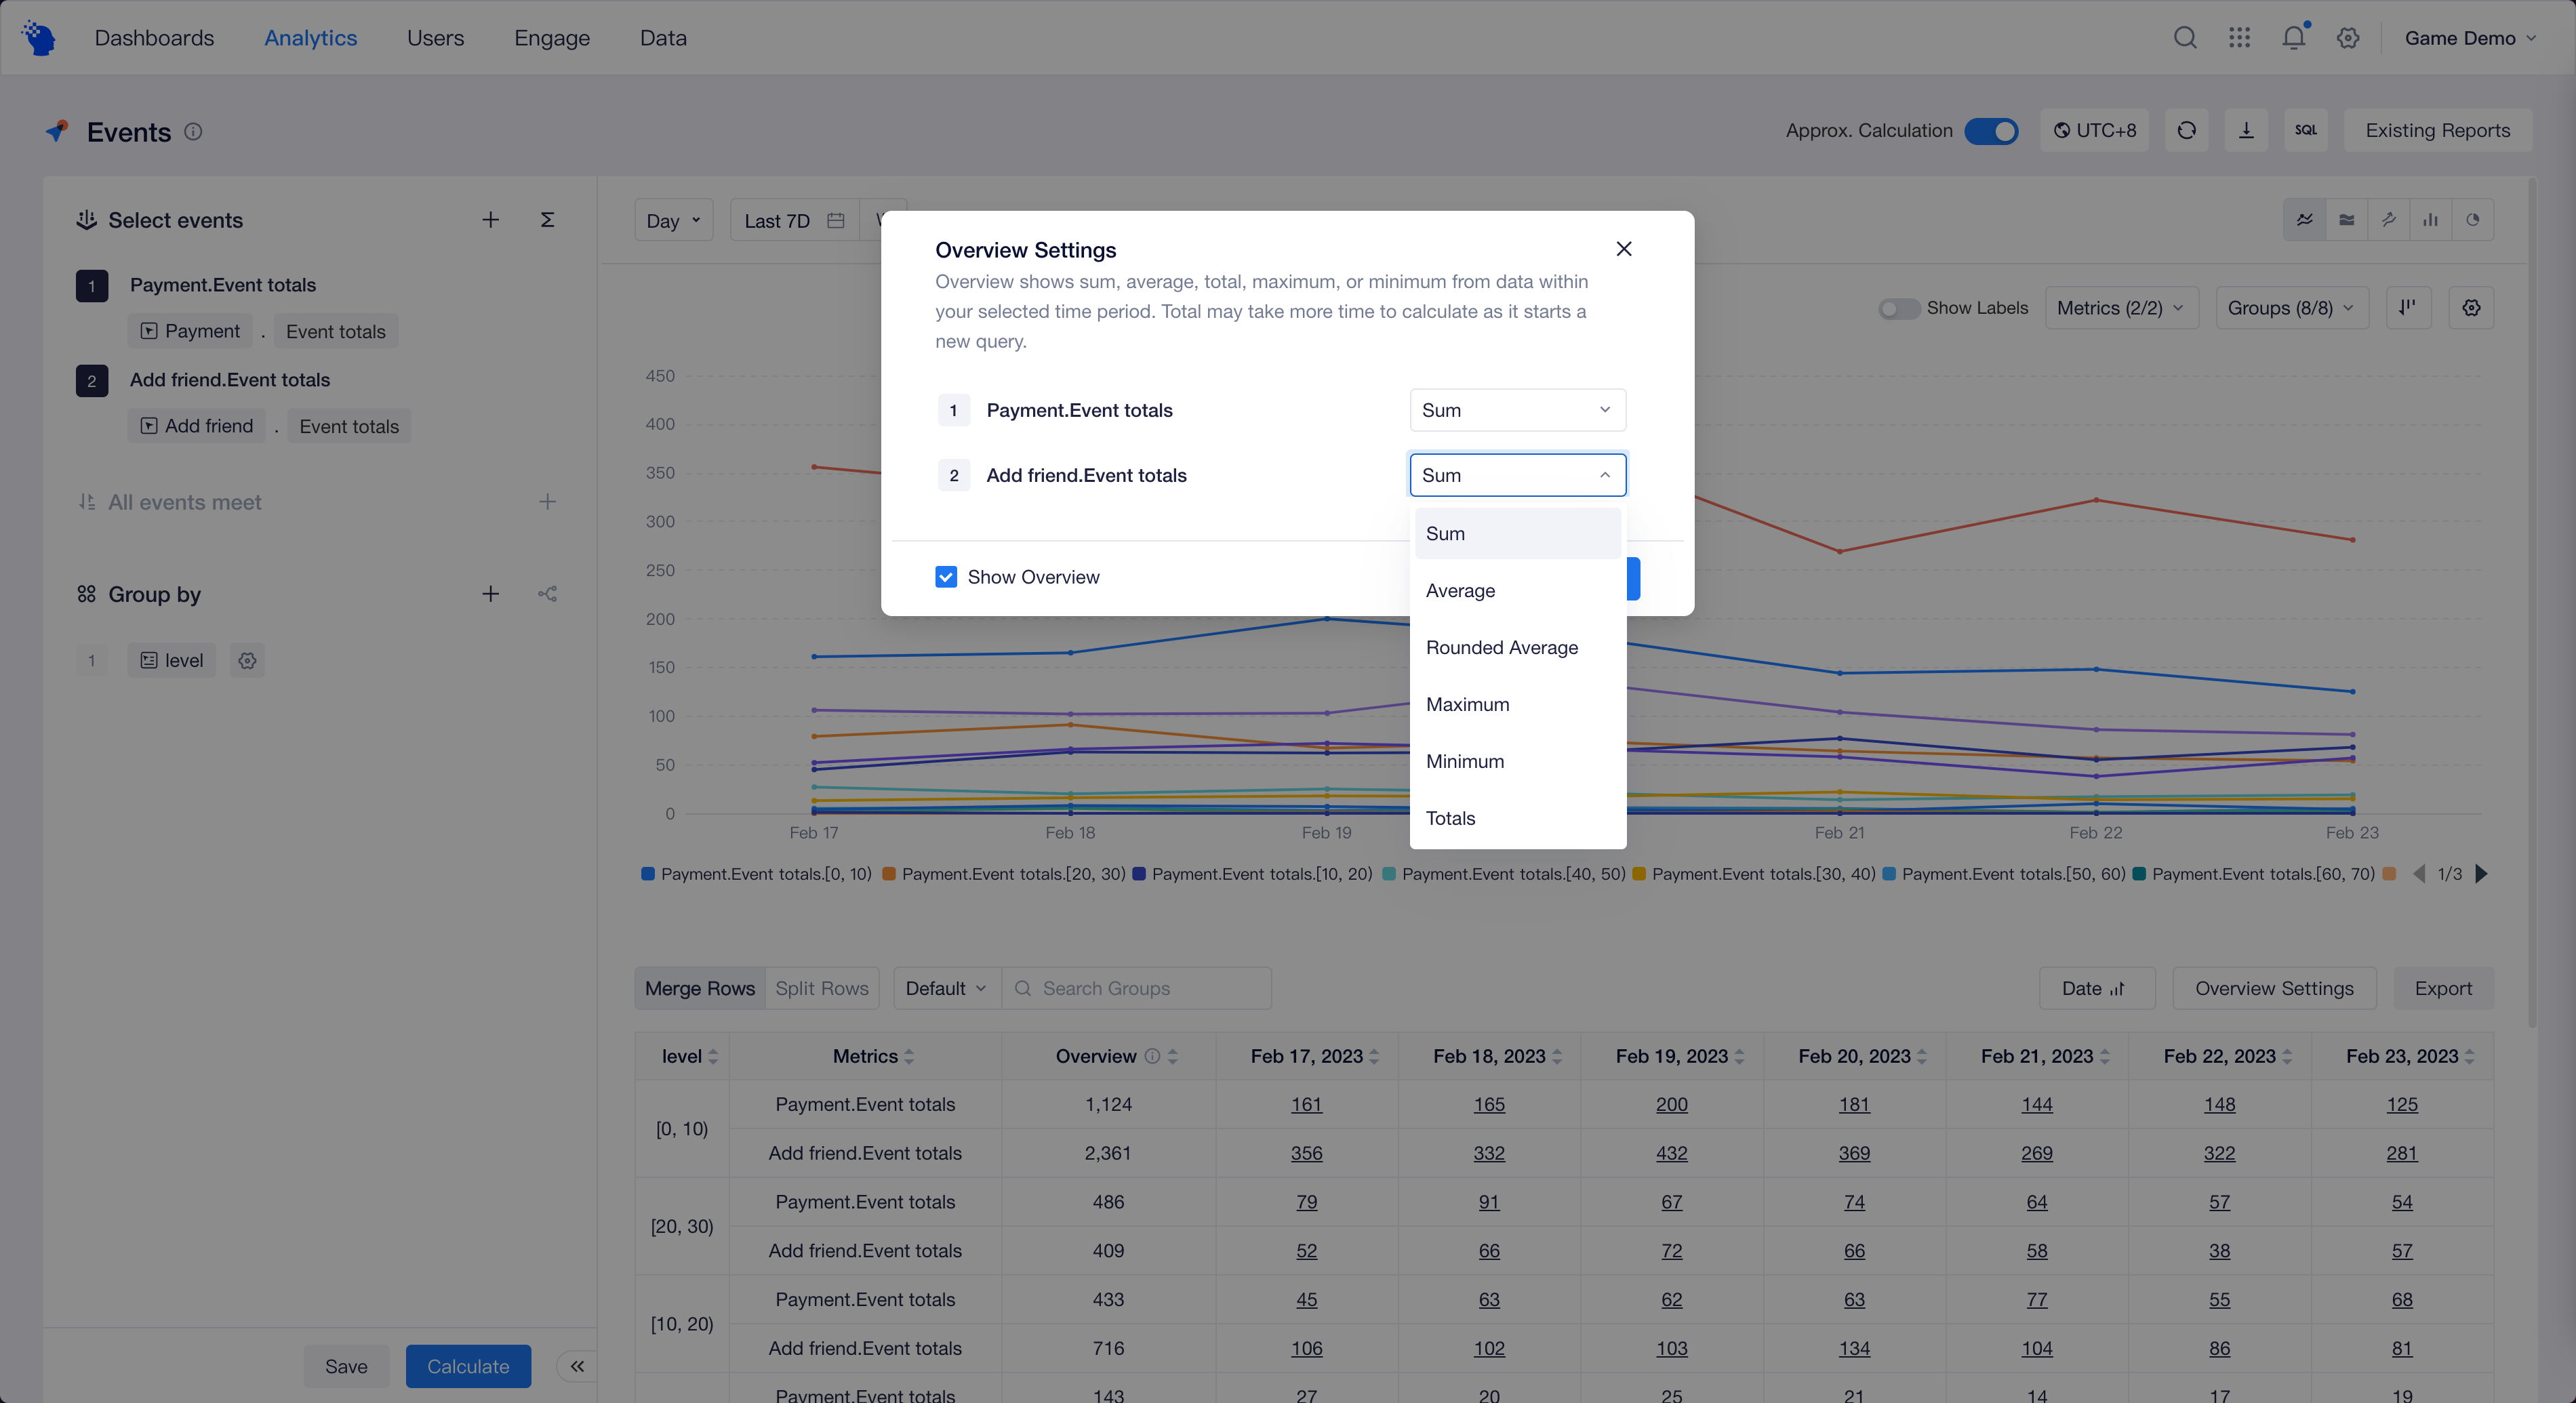
The calculation methods for Overview Settings:
- Sum: simple sum of the values of each date.
- Average (Rounded Average): Arithmetic average (rounded) of the values of each date.
- Maximum: the maximum value among the values of each date.
- Minimum: the minimum value among the values of each date.
- Totals: calculated based on the selected date range as a whole, the same as the result obtained when the analysis granularity is set as "Total"; since this option can slow down the query, it is recommended to select it only when the chosen calculation method is the number of triggering users, the number of unique objects, etc.
If a Product Metric is selected, "Weighted Average" calculation can be chosen; "Weighted Average" is applicable to ratio or per user metric such as retention rate, TE system will add the numerator and denominator respectively based on different dates and then calculate, the higher the denominator is, the greater the weight is in that date.
When "Weighted Average" of Retention metric is computed, incomplete data will be ruled out like Overview in Rentention. That is to say, the phase value is computed only based on complete data.
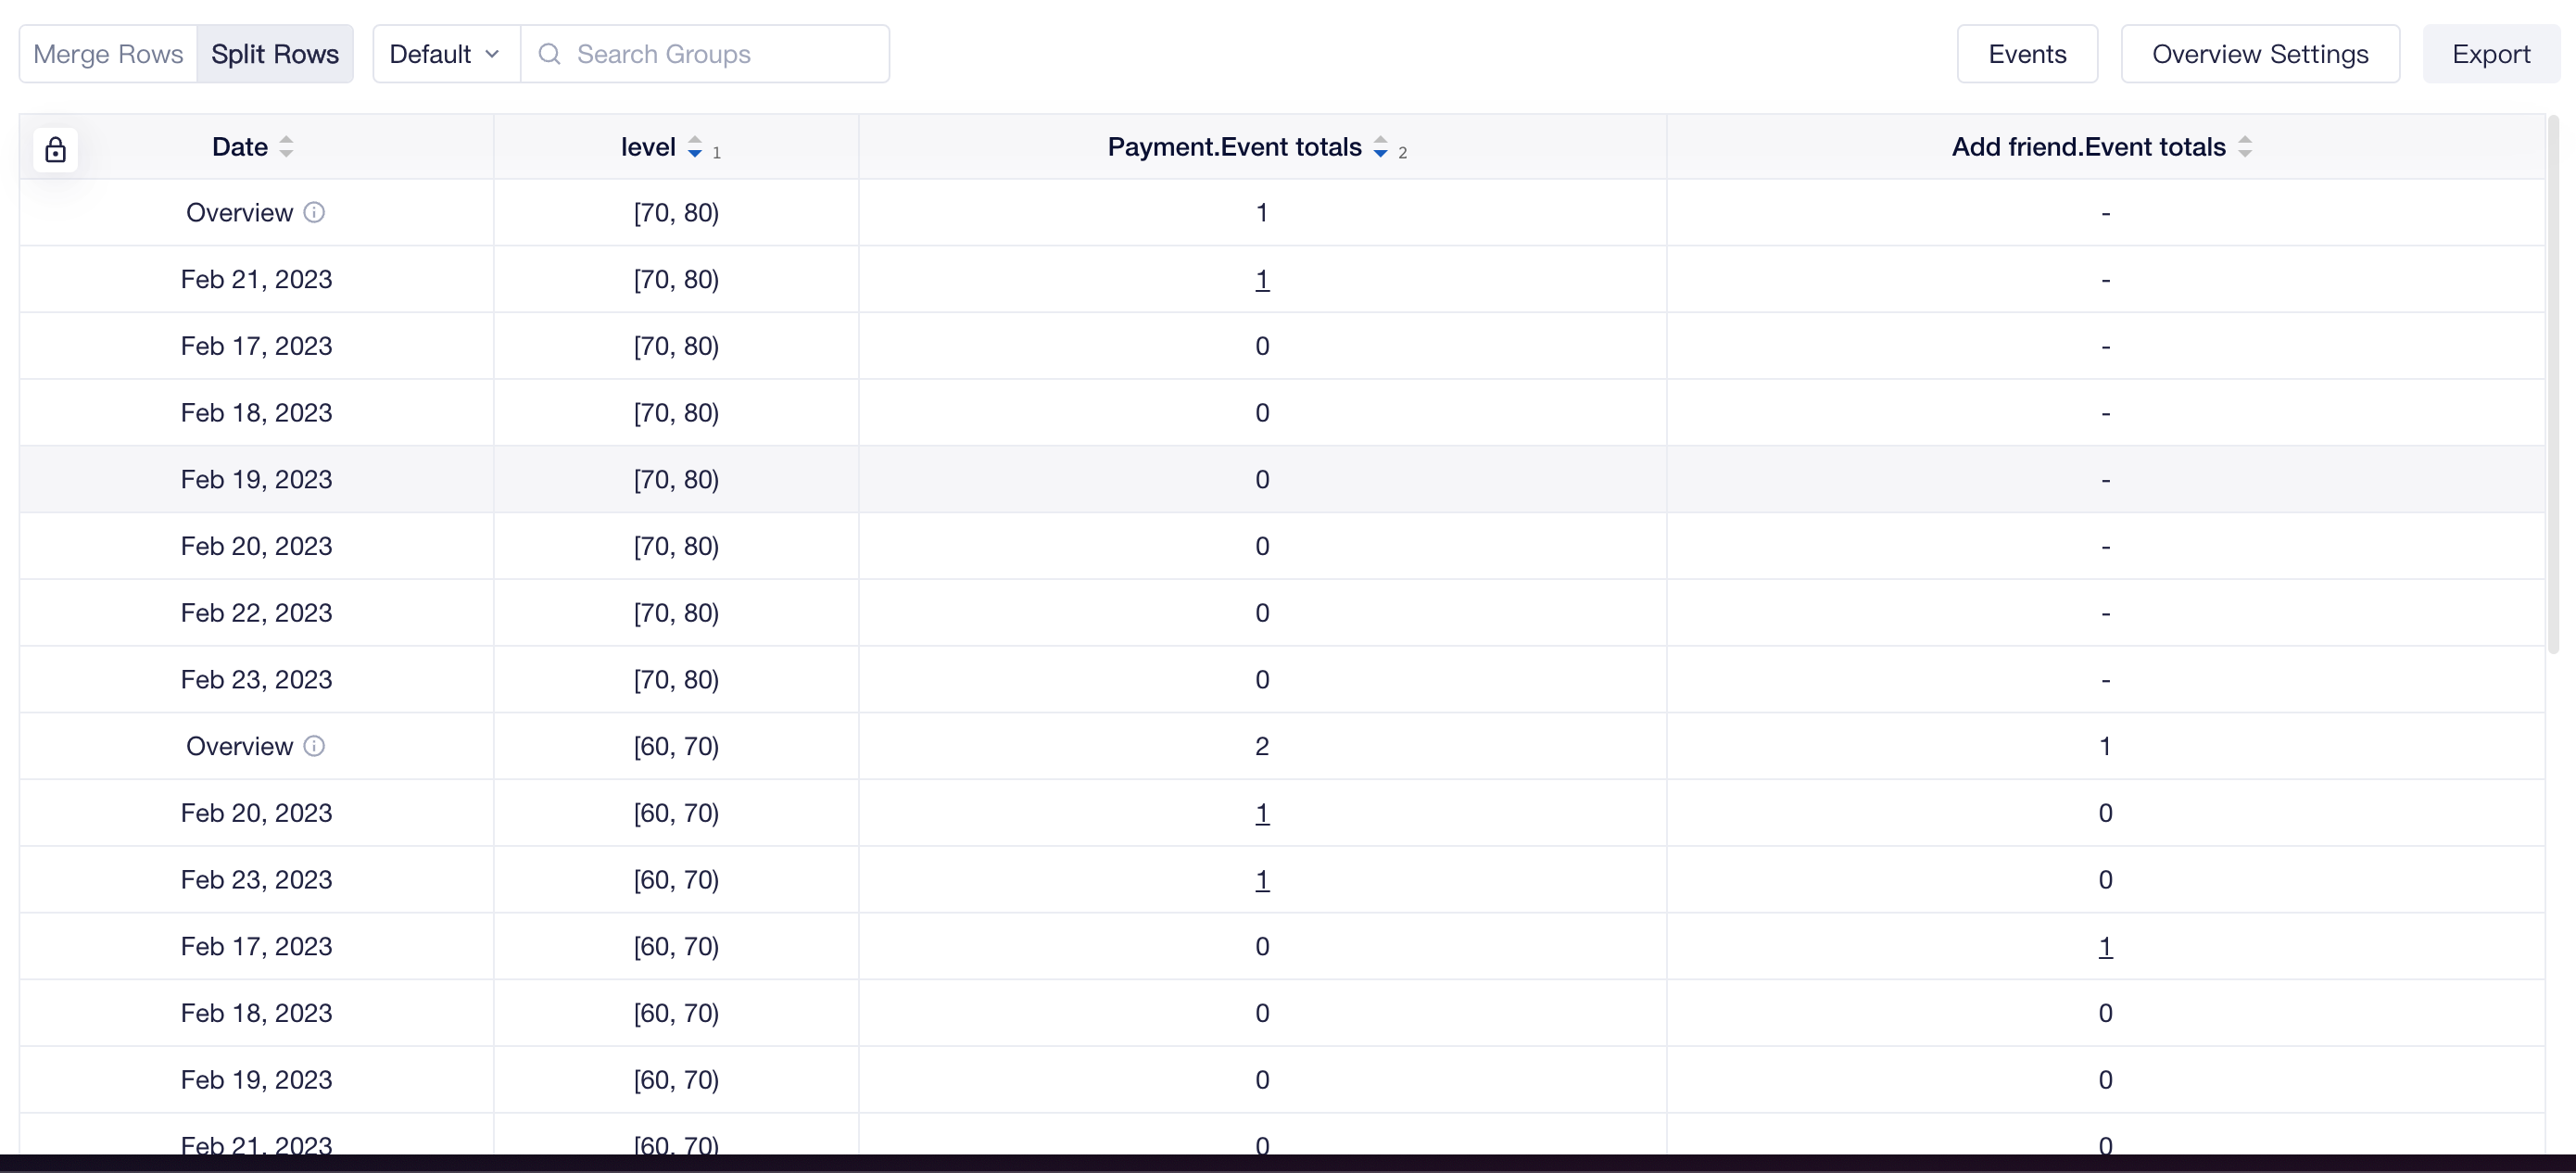
# Multiple-level Sorting
For easier reading, by default, the table is displayed with "Merge Rows" and you can sort a specified column. Or, you can switch to "Split Rows" display, then you can sort the data at multiple levels according to the order in which you click on the header metrics.