# Filebeat + Logstash User Guide
This section mainly introduces how to use the file transmission tool Filebeat + Logstash:
Before docking, you need to read the data rules first, and then read this user guide after you have been familiar with TA's data format and data rules.
Filebeat + Logstash must upload data in the data format of the TA
Note: Logstash has low throughput. If you import bulk historical data, DataX engine or Logbus tool is recommended
# I. Introduction to Filebeat + Logstash
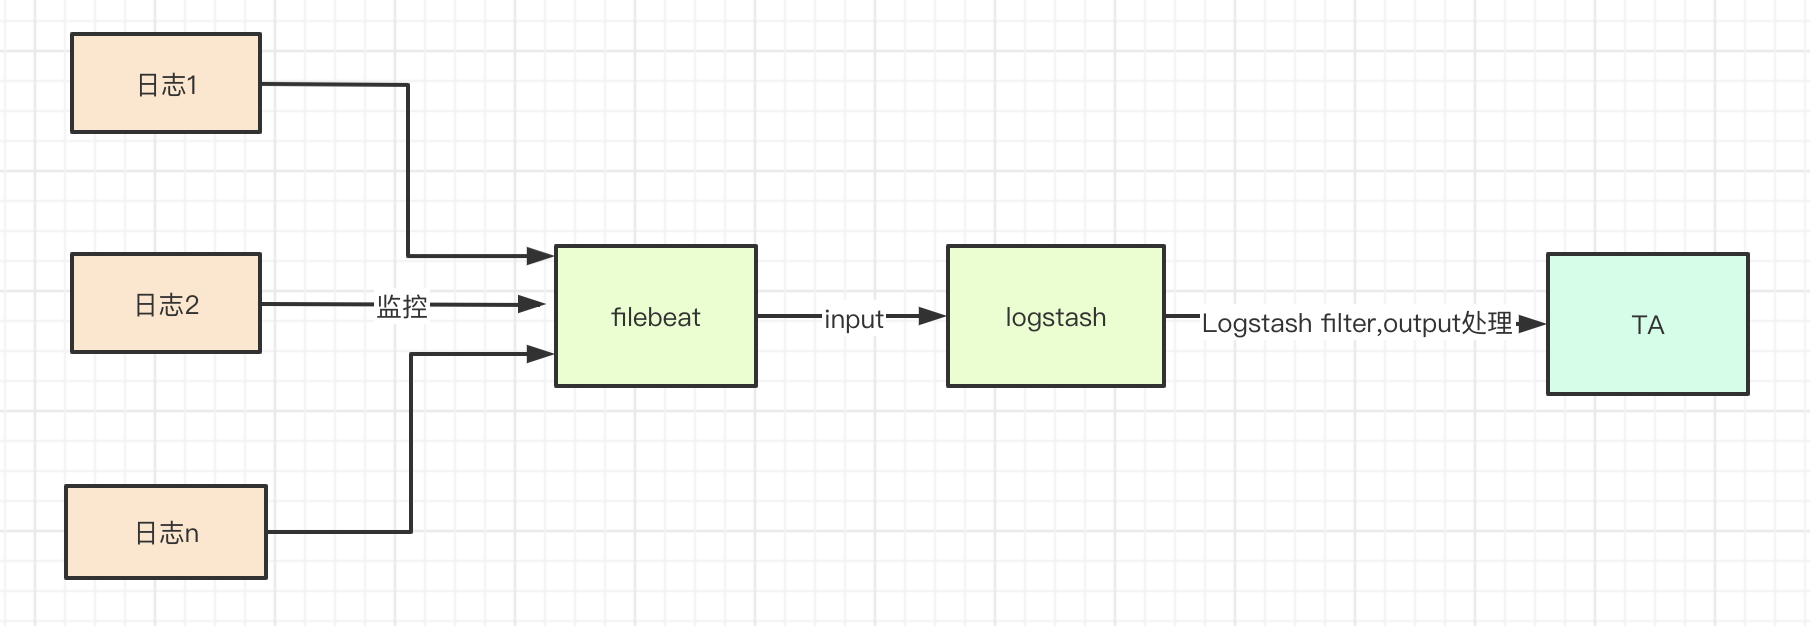
Filebeat + Logstash is mainly used to import log data to the TA background in real time. It will monitor the file flow in the log directory of the server. When any log file in the directory has new data, it will send it to the TA background in real time.
Logstash is an open source data collection engine with real-time pipelining capabilities. Logstash can dynamically unify data from disparate sources and normalize the data into destinations of your choice. introduction to Logstash's official website (opens new window)
Filebeat is a lightweight shipper for forwarding and centralizing log data. Installed as an agent on your servers, Filebeat monitors the log files or locations that you specify, collects log events, and forwards them either to Elasticsearch or Logstash for indexing. introduction to Filebeat's official website (opens new window)
The acquisition flow chart based on Filebeat + Logstash is shown in the following figure:
# II. Download and install Filebeat + Logstash
Note: For Logstash-6.x and above, its server has a JDK environment
# 2.2 Download and install Logstash
Refer to the installation document on Logstash's official website (opens new window), and choose the download method
# 2.3 logstash-output-thinkingdata plugin
Latest version:1.0.0
Update time: 2020-06-09
# 2.3.1 Install and uninstall the logstash-output-thinkingdata plugin
This plugin is used to check whether the data is json data and send the packaged data to TA
Execute in the logstash directory:
bin/logstash-plugin install logstash-output-thinkingdata
Its installation will take a while. Please wait patiently, and then execute:
bin/logstash-plugin list
If the list has logstash-output-thinkingdata, it means that it has been successfully installed.
Other commands are shown below:
To update the plugin, you can execute:
bin/logstash-plugin update logstash-output-thinkingdata
To uninstall the plugin, you can execute:
bin/logstash-plugin uninstall logstash-output-thinkingdata
# 2.3.2 Change Log
# v1.0.0 2020/06/09
- Receive the message from the event in Logstash and send it to TA
# 2.4 Download and install Filebeat
Refer to the installation document on Filebeat's official website (opens new window), and choose the download method
# III. Filebeat + Logstash use instructions
# 3.1 Data preparation
First, convert the to-be-transmitted data into TA's data format by ETL, and write it locally or transmit it to the Kafka cluster. If TE's SDKs is involved to generate these data, the data has been correctly formatted without further conversion.
Determine the directory where the uploaded data files are stored, or the address and topic of Kafka, and configure Filebeat + Logstash. In this case, Filebeat + Logstash will monitor the file changes in the file directory (monitor new files or tail existing files) or subscribe to data in Kafka.
Do not directly rename the uploaded data logs stored in the monitoring directory. Renaming the log is equivalent to creating a new file, and Filebeat may re-upload these files, resulting in data duplication.
# 3.2 Logstash configuration
# 3.2.1 Logstash Pipeline configuration
Logstash supports running multiple Pipelines at the same time. Pipelines do not affect each other and have their own independent input and output configurations. The configuration file of Pipeline is located in config/pipelines.yml.If you are currently using Logstash to complete some other log acquisition tasks, you can acquire TA's log data by adding a pipeline to the original Logstash and send it to TA
The new Pipeline is configured as follows:
#  Pipeline configuration of thinkingdata
- pipeline.id: thinkingdata-output
  #  If the number of cores for uploading user property is set to 1, only the upload event property can be set to be less than or equal to the number of local CPUs
  pipeline.workers: 1
  # Buffer queue type
  queue.type: persisted
  # Different input and output configurations
  path.config: "/home/elk/conf/ta_output.conf"
For more Pipeline configurations, please visit the official website: Pipeline (opens new window)
# 3.2.2 Logstash input and output configurations
ta_output.conf reference example:
Note: This scenario is based on the data file generated by the SDK, the output and input configurations of Logstash
# use beats as input
input {
    beats {
        port => "5044"
    }
}
# if the data is not generated by the server SDK or is in the TA format, a filter is required to filter the metadata. The ruby plugin filter is recommended here. The fourth module has a case
#filter {
#   if "log4j" in [tags] {
#    ruby {
#      path => "/home/elk/conf/rb/log4j_filter.rb"
#    }
#  }
#}
# Use thinkingdata as output
output{
   thinkingdata {
        url => "http://data acquisition address/logbus"
           appid =>"your AppID"
    }
}
thinkingdata parameter description:
| Parameter name | Type | Required field | Default value | Description |
|---|---|---|---|---|
| url | string | true | None | TA data receiving address |
| appid | string | true | None | Project APPID |
| flush_interval_sec | number | false | 2 | flush interval, unit: second |
| flush_batch_size | number | false | 500 | flush json data, unit: pcs |
| compress | number | false | 1 | Data compression. 0 means no data compression, which can be set in the intranet; 1 means gzip compression (by default) |
| uuid | boolean | false | false | Enable the UUID switch or not, to de-duplicate network fluctuations that may occur in short time intervals |
| is_filebeat_status_record | boolean | false | true | Enable Filebeat monitoring log status or not, such as offset and file name |
# 3.2.3 Logstash running configuration
Logstash uses config/logstash.yml as the running configuration by default.
pipeline.workers: 1
queue.type: persisted
queue.drain: true
Suggestions
- User_set is used to change the value of pipeline.workers to 1 when reporting the user property. When the value of workers is greater than 1, the order of data processing will change. Track event can be set greater than 1.
- To ensure that the to-be-transmitted data will not be lost due to the unexpected termination of the program, please set queue.type: persisted, which represents the buffer queue type of Logstash, so that you can continue to send the data in the buffer queue after restarting Logstash.
For more information about data persistence, please refer to the official website persistent-queues (opens new window)
- Set the value of queue.drain to true. In this case, Logstash will send all the data in all buffer queues before normal exit.
For more details, please refer to the official website logstash.yml (opens new window)
# 3.2.4 Logstash start
In the Logstash installation directory
- Start directly, use config/pipelines.yml as Pipeline configuration and running configuration
bin/logstash
- Specify ta_output.conf as the input and output configuration file, and use config/logstash.yml as the running configuration
bin/logstash -f /youpath/ta_output.conf
- Start at the background
nohup bin/logstash -f /youpath/ta_output.conf > /dev/null 2>&1 &
For more information, you can view the startup document on Logstash's official website (opens new window)
# 3.3 Filebeat configuration
# 3.3.1 Filebeat running configuration
Filebeat reads backend SDK log files. Filebeat default configuration file: filebeat.yml. The reference configuration of config/filebeat.yml is as follows:
#======================= Filebeat inputs =========================
filebeat.shutdown_timeout: 5s
filebeat.inputs:
- type: log
  enabled: true
  paths:
     - /var/log/log.*
    #- c:\programdata\elasticsearch\logs\*
#------------------------- Logstash output ----------------------------
output.logstash:
 # you can fill in the process of a server, or you can fill in the Logstash process on multiple servers
  hosts: ["ip1:5044","ip2:5044"]
  loadbalance: false
- shutdown_timeout (opens new window): The shutdown time that Filebeat waits for the publisher to send all events before shutdown
- paths: Specify the logs to be monitored. Currently, it is processed according to the glob function of the Go language, and the configuration directory is not recursively processed.
- hosts: The sending address is multiple Logstash hosts. When loadbalance is false, it is similar to the active/standby function, true means load balance
- loadbalance: Do not set loadbalance: true if the user_set user property is reported, send data to all Logstash by poll, which may cause the data sequence to be disrupted.
If you only import track events, you can set multiple Logstash processes, and set loadbalance: true. The default configuration of Filebeat is loadbalance: false
Filebeat information is available on Filebeat official document (opens new window)
# 3.3.2 Filebeat start
After filebeat starts, you can check the relevant output information:
./filebeat -e -c filebeat.yml
Start at the background
nohup ./filebeat -c filebeat.yml > /dev/null 2>&1 &
# IV. Case reference configuration
# 4.1 filebeat monitors data configuration in different log formats
The filebeat.xml of a single Filebeat can be set as follows. The running memory is about 10 MB, and multiple filebeat processes can be started to monitor different log formats. For details, please visit the official website
#=========================== Filebeat inputs =============================

filebeat.inputs:
- type: log
  enabled: true
  # monitored directory
  paths:
     - /home/elk/sdk/*/log.*
  # tag the data. Logstash will match the data, but will not filter the data
  tags: ["sdklog"]
 #data split by special characters
- type: log
  enable: true
  paths: /home/txt/split.*
  # tag the data. Logstash will match and filter the data
  tags: ["split"]
 # data received by log4j
- type: log
  enable: true
  paths: /home/web/logs/*.log
  # filter
  tags: ["log4j"]
   # data received by log4j
 # nginx log data
- type: log
  enable: true
  paths: /home/web/logs/*.log
  tags: ["nginx"]
# 4.2 Logstash configuration
Test whether the configuration file of Logstash is incorrect
bin/logstash -f /home/elk/ta_output.conf --config.test_and_exit
Note: All ruby plugins in the following scripts are written based on ruby syntax. If you are familiar with java, you can use the custom parser in the logbus directory
# 4.2.1 Server SDK log
ta_output.conf can be set as follows
input {
    beats {
        port => "5044"
    }
}
# use thinkingdata as output
output{
   thinkingdata {
        url => "url"
        appid =>"appid"
        # compress => 0
        # uuid => true
    }
}
# 4.2.2 log4j log
The log4j format can be set as follows according to the business log:
 //log format
 //[%d{yyyy-MM-dd HH:mm:ss.SSS}] the log has the input time of TA, which can also be yyyy-MM-dd HH:mm:ss
 //[%level{length=5}]    log level, debug, info, warn, error
 //[%thread-%tid]    current thread information
 //[%logger] full path of the class to which the current log information belongs
 //[%X{hostName}]    current node hostname. To be customized through MDC.
 //[%X{ip}]  current node ip. To be customized through MDC.。
 //[%X{userId}]  the unique ID for user login can be set to account_id or other values. TA requires that account_id and distinct_id cannot be empty at the same time. You can set other properties according to business settings. It needs to be customized through MDC.
 //[%X{applicationName}] current application name. You need to customize it through MDC.
 //[%F,%L,%C,%M] %F: the name of the file (class) to which the current log information belongs, %L: the line number of the log information in the file, %C: the full class name of the file to which the current log belongs, %M: method name in the current log
 //[%m]  log details
 //%ex   exception information
 //%n    new line
 <property name="patternLayout">[%d{yyyy-MM-dd HH:mm:ss.SSS}] [%level{length=5}] [%thread-%tid] [%logger] [%X{hostName}] [%X{ip}] [%X{userId}] [%X{applicationName}] [%F,%L,%C,%M] [%m] ## '%ex'%n
</property>
ta_output.conf configuration
input {
    beats {
        port => "5044"
    }
}
filter {
if "log4j" in [tags]{
    #you can also process other filter data
   ruby {
     path => "/home/conf/log4j.rb"
    }
 }
}
# use thinkingdata as output
output{
  thinkingdata {
        url => "url"
        appid =>"appid"
    }
}
/home/conf/log4j.rb script is as follows
# here you can get all the properties in the input through the parameter event
def filter(event)
  _message = event.get('message') #message is every log you upload
begin
  # here is the format for regularizing the correct data. If it is an error log, it is recommended to put it in a separate file. The error log is too long without an analysis scenario, and a new line is generated
  # the format of the data is similar to the following _message="[2020-06-08 23:19:56.003] [INFO] [main-1] [cn.thinkingdata] [x] [123.123.123.123] [x] [x ] [StartupInfoLogger.java,50,o)] ## ''"
 mess = /\[(.*?)\] \[(.*?)\] \[(.*?)\] \[(.*?)\] \[(.*?)\] \[(.*?)\] \[(.*?)\] \[(.*?)\] \[(.*?)\] ## '(.*?)'/.match(_message)
time = mess[1]
level = mess[2]
thread = mess[3]
class_name_all = mess[4]
event_name = mess[5]
ip = mess[6]
account_id = mess[7]
application_name = mess[8]
other_mess = mess[9]
exp = mess[10]

if event_name.empty? || account_id.empty?
  return []
end

properties = {
      'level' => level,
      'thread' => thread,
      'application_name' => application_name,
      'class_name_all' => class_name_all,
      'other_mess' => other_mess,
      'exp' => exp
}

  data = {
      '#ip' => ip,
      '#time' => time,
      '#account_id'=>account_id,
      '#event_name'=>event_name,   #if the type is track, it can be used, if there is no #event_name, no data needs to be uploaded
      '#type' =>'track',           # get from the file. If found in the file, confirm whether the reported data is a user property or an event property
      'properties' => properties
  }

  event.set('message',data.to_json)
  return [event]
  rescue
      # puts _message
      puts "The data is not in the regular format"
      return [] #no reporting
  end
end
# 4.2.3 Nginx log
First define the format of the Nginx log. If it is set to json format
input {
    beats {
        port => "5044"
    }
}
filter {
#if the data format is the same, there is no need to determine the tags
if "nginx" in [tags]{
   ruby {
     path => "/home/conf/nginx.rb"
    }
 }
}
# use thinkingdata as output
output{
  thinkingdata {
        url => "url"
        appid =>"appid"
    }
}
/home/conf/nginx.rb script is as follows:
  require 'date'
   def filter(event)
      # retrieve similar log information
      # {"accessip_list":"124.207.82.22","client_ip":"123.207.82.22","http_host":"203.195.163.239","@timestamp":"2020-06-03T19:47:42+08:00","method":"GET","url":"/urlpath","status":"304","http_referer":"-","body_bytes_sent":"0","request_time":"0.000","user_agent":"s","total_bytes_sent":"180","server_ip":"10.104.137.230"}
      logdata= event.get('message')
       # parse the log level and request time, and save it in the event object
         # Parse json log
    # Get log content
    # Convert to json object
    logInfoJson=JSON.parse logdata
    time = DateTime.parse(logInfoJson['@timestamp']).to_time.localtime.strftime('%Y-%m-%d %H:%M:%S')
    url = logInfoJson['url']
    account_id = logInfoJson['user_agent']
    #event_name
    #account_id or #distinct_id are both null,skip
    if url.empty? || url == "/" || account_id.empty?
      return []
    end
    properties = {
      "accessip_list" => logInfoJson['accessip_list'],
      "http_host"=>logInfoJson['http_host'],
      "method" => logInfoJson['method'],
      "url"=>logInfoJson['url'],
      "status" => logInfoJson['status'].to_i,
      "http_referer" => logInfoJson['http_referer'],
      "body_bytes_sent" =>logInfoJson['body_bytes_sent'],
      "request_time" =>  logInfoJson['request_time'],
      "total_bytes_sent" => logInfoJson['total_bytes_sent'],
      "server_ip" => logInfoJson['server_ip'],
    }
  data = {
      '#ip' => logInfoJson['client_ip'],# null
      '#time' => time, # not null
      '#account_id'=>account_id, # account_id and distinct_id cannot be both null
      '#event_name'=>url,   # if the type is track, it can be used, if there is no #event_name, no data needs to be uploaded
      '#type' =>'track',           # get from the file. If found in the file, confirm whether the reported data is a user property or an event property
      'properties' => properties
  }
   event.set('message',data.to_json)
   return [event]

  end
# 4.2.4 Other logs
ta_output.conf is configured as follows
input {
    beats {
        port => "5044"
    }
}
filter {
if "other" in [tags]{
    # you can also process other filter data
   ruby {
     path => "/home/conf/outher.rb"
    }
 }
}
# use thinkingdata as output
output{
  thinkingdata {
        url => "url"
        appid =>"appid"
    }
}
/home/conf/outher.rb script is as follows
# def register(params)
#   # the parameters obtained through params here are passed in through script_params in the logstash file
#   #@message = params["xx"]
# end
def filter(event)
  # business data is processed here. If there is no series of processing such as grok, directly obtain metadata in message
  begin
  _message = event.get('message') #message is every log you upload
  # the log processed here is similar to the following data
  #2020-06-01 22:20:11.222,123455,123.123.123.123,login,nihaoaaaaa,400
  time,account_id,ip,event_name,msg,intdata=_message.split(/,/)
  # or through regular matching data, or json data, ruby syntax can parse json, and data can be processed here for data reporting
  #mess = /regular/.match(_message)
  #time = mess[1]
  #level = mess[2]
  #thread = mess[3]
  #class_name_all = mess[4]
  #event_name = mess[5]
  #account_id = mess[6]
  #api = mess[7]

  properties = {
      'msg' => msg,
      'int_data' => intdata.to_i #to_i is int type, to_f is float type, to_s is string type (default)
  }
  data = {
      '#time' => time,
      '#account_id'=>account_id,
      '#event_name'=>event_name,
      '#ip' => ip,
      '#type' =>'track',
      'properties' => properties
  }
  event.set('message',data.to_json)

  return [event]
  rescue
       # if you don't want a certain data to be null or incorrect, you can return null, for example, account_id or distinct_id are null and return [] directly
       return []
  end
end